

Key Insights
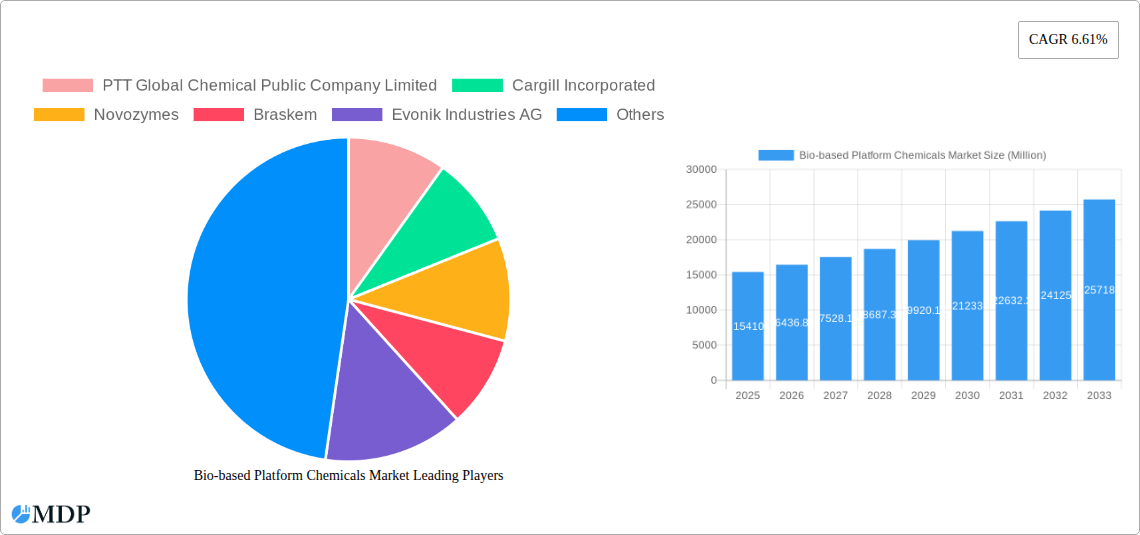
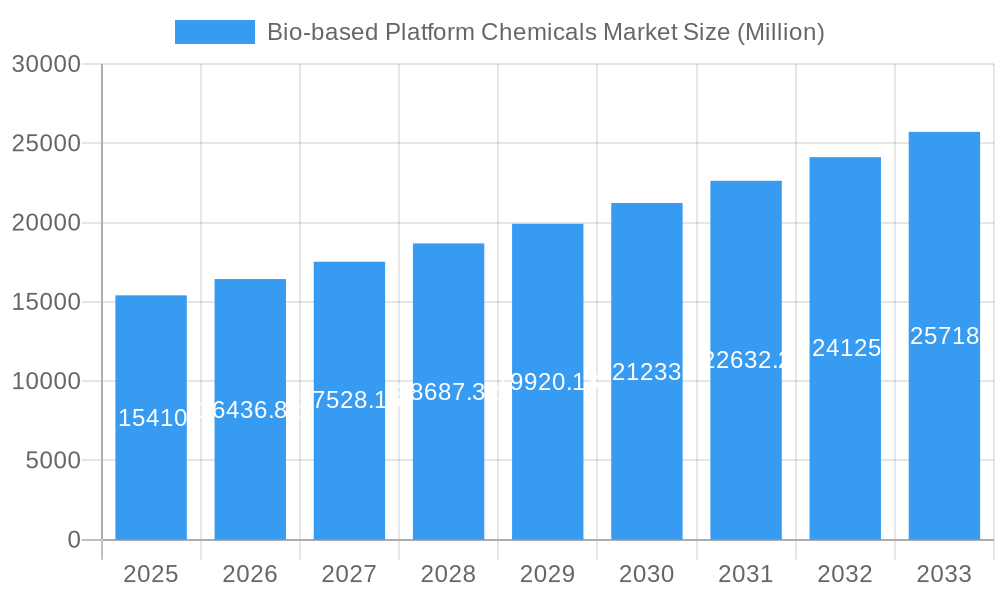
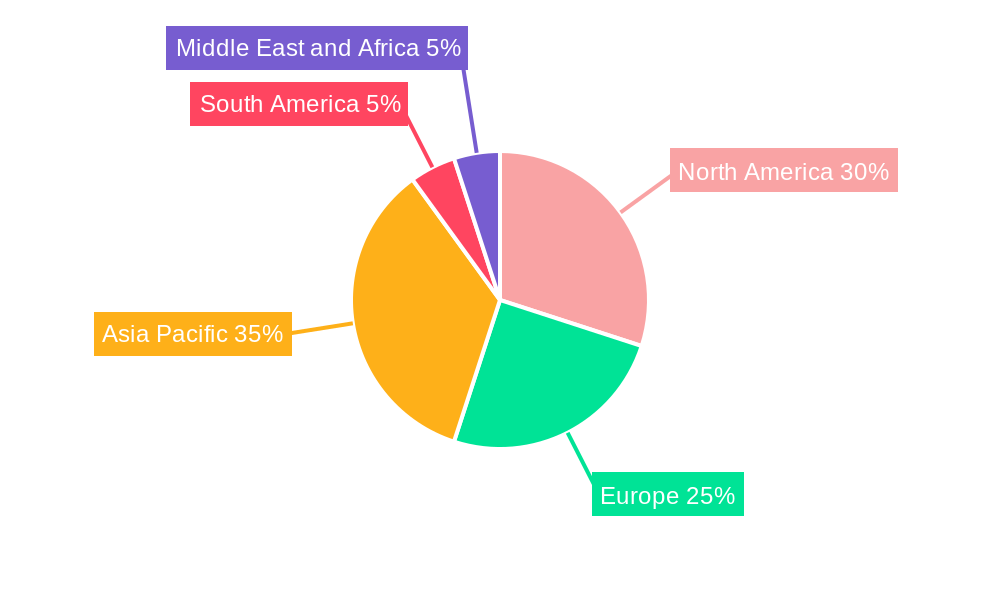
The bio-based platform chemicals market is experiencing robust growth, projected to reach \$15.41 billion in 2025 and expand significantly over the forecast period (2025-2033). A compound annual growth rate (CAGR) of 6.61% reflects the increasing demand for sustainable and environmentally friendly alternatives to traditional petrochemical-based products. Key drivers include the rising global focus on reducing carbon emissions and dependence on fossil fuels, coupled with stringent environmental regulations. Growing consumer awareness of sustainability and the increasing adoption of bio-based materials across various industries, including food and beverage, pharmaceuticals, and plastics, further fuel this expansion. The market segmentation reveals a diverse range of bio-based platform chemicals, with bio-glycerol, bio-glutamic acid, and bio-succinic acid leading the way due to their established applications and expanding market penetration. Competition is fierce, with major players like Cargill, Novozymes, BASF, and Evonik driving innovation and market expansion through strategic partnerships, R&D investments, and capacity expansions. Regional analysis shows strong growth across Asia Pacific, North America, and Europe, driven by varying levels of government support, industrial development, and consumer preferences.
Bio-based Platform Chemicals Market Market Size (In Billion)
The market's future growth trajectory hinges on technological advancements that improve the cost-effectiveness and scalability of bio-based production processes. Overcoming challenges related to raw material sourcing and fluctuating prices, as well as addressing potential regulatory hurdles in different regions, will be crucial for sustained growth. Continued research and development focusing on novel bio-based platform chemicals with wider applications will also be pivotal in unlocking new market segments and driving further expansion. The increasing integration of circular economy principles and the potential for bio-based platform chemicals to contribute to a more sustainable chemical industry will underpin the long-term growth potential of this market.
Bio-based Platform Chemicals Market Company Market Share
Bio-based Platform Chemicals Market: A Comprehensive Report (2019-2033)
This in-depth report provides a comprehensive analysis of the Bio-based Platform Chemicals Market, offering invaluable insights for industry stakeholders, investors, and researchers. Covering the period 2019-2033, with a focus on 2025, this report meticulously examines market dynamics, trends, leading players, and future growth opportunities. The market is projected to reach xx Million by 2033, exhibiting a CAGR of xx% during the forecast period (2025-2033).
Bio-based Platform Chemicals Market Market Dynamics & Concentration
The Bio-based Platform Chemicals market is characterized by moderate concentration, with key players such as PTT Global Chemical, Cargill, Novozymes, Braskem, and Evonik holding significant market share. However, the emergence of smaller, specialized firms is increasing competition. Innovation is a key driver, fueled by the need for sustainable alternatives to petrochemical-based products. Stringent environmental regulations are further propelling market growth, incentivizing the adoption of bio-based solutions. The market also witnesses consistent M&A activity, with xx major deals recorded between 2019 and 2024. This consolidation reflects the strategic importance of securing supply chains and expanding product portfolios. Product substitutes, primarily petrochemical-based chemicals, pose a challenge, though bio-based options are gaining traction due to increasing consumer demand for sustainable products. End-user trends reflect a growing preference for environmentally friendly materials across various sectors, including food and beverages, packaging, and plastics.
- Market Share: Top 5 players hold approximately xx% of the market.
- M&A Activity: xx major mergers and acquisitions recorded between 2019 and 2024.
- Innovation Drivers: Growing demand for sustainable alternatives, stringent environmental regulations.
- Regulatory Framework: Government incentives and policies supporting bio-based industries play a significant role.
Bio-based Platform Chemicals Market Industry Trends & Analysis
The Bio-based Platform Chemicals market is experiencing robust growth, driven by several key factors. Increasing consumer awareness of environmental issues and the growing demand for sustainable products are primary catalysts. Technological advancements in bio-based chemical production, including improved fermentation processes and enzyme technologies, are enhancing efficiency and reducing costs. This has led to increased market penetration of bio-based products, particularly in niche segments such as food additives and specialty chemicals. The competitive landscape is dynamic, with established players expanding their product portfolios and new entrants bringing innovative solutions to the market. The market's CAGR is projected to be xx% from 2025 to 2033, driven by these factors, with significant growth expected in specific regional markets. Consumer preferences towards eco-friendly and ethically sourced products contribute to this upward trend.
Leading Markets & Segments in Bio-based Platform Chemicals Market
The Bio Glycerol segment currently dominates the product type landscape, owing to its widespread applications in food, pharmaceuticals, and cosmetics. However, Bio Succinic Acid and Bio-3-Hydroxypropionic Acid are emerging as high-growth segments due to their increasing utilization in bioplastics and other high-value applications. Geographically, [Dominant Region, e.g., North America] is the leading market due to supportive government policies, robust research and development infrastructure, and high consumer awareness of environmental sustainability.
Key Drivers in [Dominant Region]:
- Strong government support for renewable energy and sustainable development.
- Well-established infrastructure for bio-based chemical production and distribution.
- High consumer demand for eco-friendly products.
Segment Dominance Analysis: Bio Glycerol currently holds the largest market share due to its established applications and readily available feedstock. Bio Succinic acid exhibits the highest growth potential due to its wide range of applications, particularly in bioplastics.
Bio-based Platform Chemicals Market Product Developments
Significant advancements in bio-based platform chemical production have resulted in improved yields, reduced costs, and expanded applications. Braskem's bio-based polyethylene (PE) resin derived from sugarcane and Evonik's bio-based polyamide 12 from renewable castor oil exemplify the innovation driving the market. These developments are improving the cost-competitiveness of bio-based chemicals while also enhancing their performance characteristics, making them attractive alternatives to their petrochemical counterparts. The focus on creating bio-based chemicals with similar or superior properties to their traditional counterparts is pivotal in achieving market acceptance and expanding adoption rates.
Key Drivers of Bio-based Platform Chemicals Market Growth
The growth of the bio-based platform chemicals market is propelled by several key factors. Firstly, the increasing global concern over climate change and environmental sustainability drives the demand for eco-friendly alternatives to petroleum-based chemicals. Government regulations and incentives promoting the adoption of bio-based products further contribute to this trend. Technological advancements in fermentation processes and enzyme engineering have also played a crucial role in reducing production costs and enhancing efficiency.
Challenges in the Bio-based Platform Chemicals Market Market
Despite its significant growth potential, the bio-based platform chemicals market faces certain challenges. The relatively high production cost compared to petrochemical-based alternatives remains a significant barrier to widespread adoption. Supply chain complexities and the inconsistent availability of biomass feedstock can also hinder market growth. Furthermore, competition from established petrochemical companies poses a considerable challenge. These factors combine to limit the market's expansion, with the cost differential potentially restricting adoption in price-sensitive applications.
Emerging Opportunities in Bio-based Platform Chemicals Market
The long-term outlook for the bio-based platform chemicals market is positive. Technological breakthroughs in areas like metabolic engineering and synthetic biology are expected to significantly reduce production costs and improve the performance of bio-based chemicals. Strategic partnerships and collaborations between chemical companies and biotechnology firms will accelerate innovation and market penetration. Expansion into new applications and markets, especially in developing economies with growing demand for sustainable products, represents a significant opportunity for growth.
Leading Players in the Bio-based Platform Chemicals Market Sector
- PTT Global Chemical Public Company Limited
- Cargill Incorporated
- Novozymes
- Braskem
- Evonik Industries AG
- Tokyo Chemical Industry Co Ltd
- BASF SE
- LyondellBasell Industries Holdings B.V.
- Aktin Chemicals Inc
- DSM
- DuPont
- NIPPON SHOKUBAI CO LTD
- Champlor (Valtris Specialty Chemicals)
- GFBiochemicals Ltd
Key Milestones in Bio-based Platform Chemicals Market Industry
- 2020: Braskem announces the launch of its bio-based polyethylene (PE) resin.
- 2021: Evonik introduces its bio-based polyamide 12.
- 2022: Novozymes and Cargill partner to develop bio-based ingredients.
- 2023: BASF and Toyota Tsusho form a joint venture for bio-based succinic acid production.
Strategic Outlook for Bio-based Platform Chemicals Market Market
The future of the bio-based platform chemicals market is bright, driven by increasing environmental concerns and technological advancements. Strategic investments in research and development, coupled with strategic partnerships and collaborations, will be crucial for companies to capitalize on the market's growth potential. Focusing on improving the cost-competitiveness and performance of bio-based chemicals while simultaneously exploring new applications will be key to unlocking further market expansion and securing a sustainable future for the industry.
Bio-based Platform Chemicals Market Segmentation
-
1. Product Type
- 1.1. Bio Glycerol
- 1.2. Bio Glutamic Acid
- 1.3. Bio Itaconic Acid
- 1.4. Bio-3-Hydroxypropionic Acid
- 1.5. Bio Succinic Acid
- 1.6. Other Product Types
Bio-based Platform Chemicals Market Segmentation By Geography
-
1. Asia Pacific
- 1.1. China
- 1.2. India
- 1.3. Japan
- 1.4. South Korea
- 1.5. Rest of Asia Pacific
-
2. North America
- 2.1. United States
- 2.2. Canada
- 2.3. Mexico
-
3. Europe
- 3.1. Germany
- 3.2. United Kingdom
- 3.3. Italy
- 3.4. France
- 3.5. Rest of Europe
-
4. South America
- 4.1. Brazil
- 4.2. Argentina
- 4.3. Rest of South America
-
5. Middle East and Africa
- 5.1. South Africa
- 5.2. Saudi Arabia
- 5.3. Rest of Middle East and Africa
Bio-based Platform Chemicals Market Regional Market Share
Geographic Coverage of Bio-based Platform Chemicals Market
Bio-based Platform Chemicals Market REPORT HIGHLIGHTS
| Aspects | Details |
|---|---|
| Study Period | 2020-2034 |
| Base Year | 2025 |
| Estimated Year | 2026 |
| Forecast Period | 2026-2034 |
| Historical Period | 2020-2025 |
| Growth Rate | CAGR of 6.61% from 2020-2034 |
| Segmentation |
|
Table of Contents
- 1. Introduction
- 1.1. Research Scope
- 1.2. Market Segmentation
- 1.3. Research Objective
- 1.4. Definitions and Assumptions
- 2. Executive Summary
- 2.1. Market Snapshot
- 3. Market Dynamics
- 3.1. Market Drivers
- 3.2. Market Restrains
- 3.3. Market Trends
- 3.4. Market Opportunities
- 4. Market Factor Analysis
- 4.1. Porters Five Forces
- 4.1.1. Bargaining Power of Suppliers
- 4.1.2. Bargaining Power of Buyers
- 4.1.3. Threat of New Entrants
- 4.1.4. Threat of Substitutes
- 4.1.5. Competitive Rivalry
- 4.2. PESTEL analysis
- 4.3. BCG Analysis
- 4.3.1. Stars (High Growth, High Market Share)
- 4.3.2. Cash Cows (Low Growth, High Market Share)
- 4.3.3. Question Mark (High Growth, Low Market Share)
- 4.3.4. Dogs (Low Growth, Low Market Share)
- 4.4. Ansoff Matrix Analysis
- 4.5. Supply Chain Analysis
- 4.6. Regulatory Landscape
- 4.7. Current Market Potential and Opportunity Assessment (TAM–SAM–SOM Framework)
- 4.8. MDP Analyst Note
- 4.1. Porters Five Forces
- 5. Market Analysis, Insights and Forecast 2021-2033
- 5.1. Market Analysis, Insights and Forecast - by Product Type
- 5.1.1. Bio Glycerol
- 5.1.2. Bio Glutamic Acid
- 5.1.3. Bio Itaconic Acid
- 5.1.4. Bio-3-Hydroxypropionic Acid
- 5.1.5. Bio Succinic Acid
- 5.1.6. Other Product Types
- 5.2. Market Analysis, Insights and Forecast - by Region
- 5.2.1. Asia Pacific
- 5.2.2. North America
- 5.2.3. Europe
- 5.2.4. South America
- 5.2.5. Middle East and Africa
- 5.1. Market Analysis, Insights and Forecast - by Product Type
- 6. Global Bio-based Platform Chemicals Market Analysis, Insights and Forecast, 2021-2033
- 6.1. Market Analysis, Insights and Forecast - by Product Type
- 6.1.1. Bio Glycerol
- 6.1.2. Bio Glutamic Acid
- 6.1.3. Bio Itaconic Acid
- 6.1.4. Bio-3-Hydroxypropionic Acid
- 6.1.5. Bio Succinic Acid
- 6.1.6. Other Product Types
- 6.1. Market Analysis, Insights and Forecast - by Product Type
- 7. Asia Pacific Bio-based Platform Chemicals Market Analysis, Insights and Forecast, 2020-2032
- 7.1. Market Analysis, Insights and Forecast - by Product Type
- 7.1.1. Bio Glycerol
- 7.1.2. Bio Glutamic Acid
- 7.1.3. Bio Itaconic Acid
- 7.1.4. Bio-3-Hydroxypropionic Acid
- 7.1.5. Bio Succinic Acid
- 7.1.6. Other Product Types
- 7.1. Market Analysis, Insights and Forecast - by Product Type
- 8. North America Bio-based Platform Chemicals Market Analysis, Insights and Forecast, 2020-2032
- 8.1. Market Analysis, Insights and Forecast - by Product Type
- 8.1.1. Bio Glycerol
- 8.1.2. Bio Glutamic Acid
- 8.1.3. Bio Itaconic Acid
- 8.1.4. Bio-3-Hydroxypropionic Acid
- 8.1.5. Bio Succinic Acid
- 8.1.6. Other Product Types
- 8.1. Market Analysis, Insights and Forecast - by Product Type
- 9. Europe Bio-based Platform Chemicals Market Analysis, Insights and Forecast, 2020-2032
- 9.1. Market Analysis, Insights and Forecast - by Product Type
- 9.1.1. Bio Glycerol
- 9.1.2. Bio Glutamic Acid
- 9.1.3. Bio Itaconic Acid
- 9.1.4. Bio-3-Hydroxypropionic Acid
- 9.1.5. Bio Succinic Acid
- 9.1.6. Other Product Types
- 9.1. Market Analysis, Insights and Forecast - by Product Type
- 10. South America Bio-based Platform Chemicals Market Analysis, Insights and Forecast, 2020-2032
- 10.1. Market Analysis, Insights and Forecast - by Product Type
- 10.1.1. Bio Glycerol
- 10.1.2. Bio Glutamic Acid
- 10.1.3. Bio Itaconic Acid
- 10.1.4. Bio-3-Hydroxypropionic Acid
- 10.1.5. Bio Succinic Acid
- 10.1.6. Other Product Types
- 10.1. Market Analysis, Insights and Forecast - by Product Type
- 11. Middle East and Africa Bio-based Platform Chemicals Market Analysis, Insights and Forecast, 2020-2032
- 11.1. Market Analysis, Insights and Forecast - by Product Type
- 11.1.1. Bio Glycerol
- 11.1.2. Bio Glutamic Acid
- 11.1.3. Bio Itaconic Acid
- 11.1.4. Bio-3-Hydroxypropionic Acid
- 11.1.5. Bio Succinic Acid
- 11.1.6. Other Product Types
- 11.1. Market Analysis, Insights and Forecast - by Product Type
- 12. Competitive Analysis
- 12.1. Company Profiles
- 12.1.1 PTT Global Chemical Public Company Limited
- 12.1.1.1. Company Overview
- 12.1.1.2. Products
- 12.1.1.3. Company Financials
- 12.1.1.4. SWOT Analysis
- 12.1.2 Cargill Incorporated
- 12.1.2.1. Company Overview
- 12.1.2.2. Products
- 12.1.2.3. Company Financials
- 12.1.2.4. SWOT Analysis
- 12.1.3 Novozymes
- 12.1.3.1. Company Overview
- 12.1.3.2. Products
- 12.1.3.3. Company Financials
- 12.1.3.4. SWOT Analysis
- 12.1.4 Braskem
- 12.1.4.1. Company Overview
- 12.1.4.2. Products
- 12.1.4.3. Company Financials
- 12.1.4.4. SWOT Analysis
- 12.1.5 Evonik Industries AG
- 12.1.5.1. Company Overview
- 12.1.5.2. Products
- 12.1.5.3. Company Financials
- 12.1.5.4. SWOT Analysis
- 12.1.6 Tokyo Chemical Industry Co Ltd *List Not Exhaustive
- 12.1.6.1. Company Overview
- 12.1.6.2. Products
- 12.1.6.3. Company Financials
- 12.1.6.4. SWOT Analysis
- 12.1.7 BASF SE
- 12.1.7.1. Company Overview
- 12.1.7.2. Products
- 12.1.7.3. Company Financials
- 12.1.7.4. SWOT Analysis
- 12.1.8 LyondellBasell Industries Holdings B V
- 12.1.8.1. Company Overview
- 12.1.8.2. Products
- 12.1.8.3. Company Financials
- 12.1.8.4. SWOT Analysis
- 12.1.9 Aktin Chemicals Inc
- 12.1.9.1. Company Overview
- 12.1.9.2. Products
- 12.1.9.3. Company Financials
- 12.1.9.4. SWOT Analysis
- 12.1.10 DSM
- 12.1.10.1. Company Overview
- 12.1.10.2. Products
- 12.1.10.3. Company Financials
- 12.1.10.4. SWOT Analysis
- 12.1.11 DuPont
- 12.1.11.1. Company Overview
- 12.1.11.2. Products
- 12.1.11.3. Company Financials
- 12.1.11.4. SWOT Analysis
- 12.1.12 NIPPON SHOKUBAI CO LTD
- 12.1.12.1. Company Overview
- 12.1.12.2. Products
- 12.1.12.3. Company Financials
- 12.1.12.4. SWOT Analysis
- 12.1.13 Champlor (Valtris Specialty Chemicals)
- 12.1.13.1. Company Overview
- 12.1.13.2. Products
- 12.1.13.3. Company Financials
- 12.1.13.4. SWOT Analysis
- 12.1.14 GFBiochemicals Ltd
- 12.1.14.1. Company Overview
- 12.1.14.2. Products
- 12.1.14.3. Company Financials
- 12.1.14.4. SWOT Analysis
- 12.1.1 PTT Global Chemical Public Company Limited
- 12.2. Market Entropy
- 12.2.1 Company's Key Areas Served
- 12.2.2 Recent Developments
- 12.3. Company Market Share Analysis 2025
- 12.3.1 Top 5 Companies Market Share Analysis
- 12.3.2 Top 3 Companies Market Share Analysis
- 12.4. List of Potential Customers
- 13. Research Methodology
List of Figures
- Figure 1: Global Bio-based Platform Chemicals Market Revenue Breakdown (Million, %) by Region 2025 & 2033
- Figure 2: Global Bio-based Platform Chemicals Market Volume Breakdown (K Tons, %) by Region 2025 & 2033
- Figure 3: Asia Pacific Bio-based Platform Chemicals Market Revenue (Million), by Product Type 2025 & 2033
- Figure 4: Asia Pacific Bio-based Platform Chemicals Market Volume (K Tons), by Product Type 2025 & 2033
- Figure 5: Asia Pacific Bio-based Platform Chemicals Market Revenue Share (%), by Product Type 2025 & 2033
- Figure 6: Asia Pacific Bio-based Platform Chemicals Market Volume Share (%), by Product Type 2025 & 2033
- Figure 7: Asia Pacific Bio-based Platform Chemicals Market Revenue (Million), by Country 2025 & 2033
- Figure 8: Asia Pacific Bio-based Platform Chemicals Market Volume (K Tons), by Country 2025 & 2033
- Figure 9: Asia Pacific Bio-based Platform Chemicals Market Revenue Share (%), by Country 2025 & 2033
- Figure 10: Asia Pacific Bio-based Platform Chemicals Market Volume Share (%), by Country 2025 & 2033
- Figure 11: North America Bio-based Platform Chemicals Market Revenue (Million), by Product Type 2025 & 2033
- Figure 12: North America Bio-based Platform Chemicals Market Volume (K Tons), by Product Type 2025 & 2033
- Figure 13: North America Bio-based Platform Chemicals Market Revenue Share (%), by Product Type 2025 & 2033
- Figure 14: North America Bio-based Platform Chemicals Market Volume Share (%), by Product Type 2025 & 2033
- Figure 15: North America Bio-based Platform Chemicals Market Revenue (Million), by Country 2025 & 2033
- Figure 16: North America Bio-based Platform Chemicals Market Volume (K Tons), by Country 2025 & 2033
- Figure 17: North America Bio-based Platform Chemicals Market Revenue Share (%), by Country 2025 & 2033
- Figure 18: North America Bio-based Platform Chemicals Market Volume Share (%), by Country 2025 & 2033
- Figure 19: Europe Bio-based Platform Chemicals Market Revenue (Million), by Product Type 2025 & 2033
- Figure 20: Europe Bio-based Platform Chemicals Market Volume (K Tons), by Product Type 2025 & 2033
- Figure 21: Europe Bio-based Platform Chemicals Market Revenue Share (%), by Product Type 2025 & 2033
- Figure 22: Europe Bio-based Platform Chemicals Market Volume Share (%), by Product Type 2025 & 2033
- Figure 23: Europe Bio-based Platform Chemicals Market Revenue (Million), by Country 2025 & 2033
- Figure 24: Europe Bio-based Platform Chemicals Market Volume (K Tons), by Country 2025 & 2033
- Figure 25: Europe Bio-based Platform Chemicals Market Revenue Share (%), by Country 2025 & 2033
- Figure 26: Europe Bio-based Platform Chemicals Market Volume Share (%), by Country 2025 & 2033
- Figure 27: South America Bio-based Platform Chemicals Market Revenue (Million), by Product Type 2025 & 2033
- Figure 28: South America Bio-based Platform Chemicals Market Volume (K Tons), by Product Type 2025 & 2033
- Figure 29: South America Bio-based Platform Chemicals Market Revenue Share (%), by Product Type 2025 & 2033
- Figure 30: South America Bio-based Platform Chemicals Market Volume Share (%), by Product Type 2025 & 2033
- Figure 31: South America Bio-based Platform Chemicals Market Revenue (Million), by Country 2025 & 2033
- Figure 32: South America Bio-based Platform Chemicals Market Volume (K Tons), by Country 2025 & 2033
- Figure 33: South America Bio-based Platform Chemicals Market Revenue Share (%), by Country 2025 & 2033
- Figure 34: South America Bio-based Platform Chemicals Market Volume Share (%), by Country 2025 & 2033
- Figure 35: Middle East and Africa Bio-based Platform Chemicals Market Revenue (Million), by Product Type 2025 & 2033
- Figure 36: Middle East and Africa Bio-based Platform Chemicals Market Volume (K Tons), by Product Type 2025 & 2033
- Figure 37: Middle East and Africa Bio-based Platform Chemicals Market Revenue Share (%), by Product Type 2025 & 2033
- Figure 38: Middle East and Africa Bio-based Platform Chemicals Market Volume Share (%), by Product Type 2025 & 2033
- Figure 39: Middle East and Africa Bio-based Platform Chemicals Market Revenue (Million), by Country 2025 & 2033
- Figure 40: Middle East and Africa Bio-based Platform Chemicals Market Volume (K Tons), by Country 2025 & 2033
- Figure 41: Middle East and Africa Bio-based Platform Chemicals Market Revenue Share (%), by Country 2025 & 2033
- Figure 42: Middle East and Africa Bio-based Platform Chemicals Market Volume Share (%), by Country 2025 & 2033
List of Tables
- Table 1: Global Bio-based Platform Chemicals Market Revenue Million Forecast, by Product Type 2020 & 2033
- Table 2: Global Bio-based Platform Chemicals Market Volume K Tons Forecast, by Product Type 2020 & 2033
- Table 3: Global Bio-based Platform Chemicals Market Revenue Million Forecast, by Region 2020 & 2033
- Table 4: Global Bio-based Platform Chemicals Market Volume K Tons Forecast, by Region 2020 & 2033
- Table 5: Global Bio-based Platform Chemicals Market Revenue Million Forecast, by Product Type 2020 & 2033
- Table 6: Global Bio-based Platform Chemicals Market Volume K Tons Forecast, by Product Type 2020 & 2033
- Table 7: Global Bio-based Platform Chemicals Market Revenue Million Forecast, by Country 2020 & 2033
- Table 8: Global Bio-based Platform Chemicals Market Volume K Tons Forecast, by Country 2020 & 2033
- Table 9: China Bio-based Platform Chemicals Market Revenue (Million) Forecast, by Application 2020 & 2033
- Table 10: China Bio-based Platform Chemicals Market Volume (K Tons) Forecast, by Application 2020 & 2033
- Table 11: India Bio-based Platform Chemicals Market Revenue (Million) Forecast, by Application 2020 & 2033
- Table 12: India Bio-based Platform Chemicals Market Volume (K Tons) Forecast, by Application 2020 & 2033
- Table 13: Japan Bio-based Platform Chemicals Market Revenue (Million) Forecast, by Application 2020 & 2033
- Table 14: Japan Bio-based Platform Chemicals Market Volume (K Tons) Forecast, by Application 2020 & 2033
- Table 15: South Korea Bio-based Platform Chemicals Market Revenue (Million) Forecast, by Application 2020 & 2033
- Table 16: South Korea Bio-based Platform Chemicals Market Volume (K Tons) Forecast, by Application 2020 & 2033
- Table 17: Rest of Asia Pacific Bio-based Platform Chemicals Market Revenue (Million) Forecast, by Application 2020 & 2033
- Table 18: Rest of Asia Pacific Bio-based Platform Chemicals Market Volume (K Tons) Forecast, by Application 2020 & 2033
- Table 19: Global Bio-based Platform Chemicals Market Revenue Million Forecast, by Product Type 2020 & 2033
- Table 20: Global Bio-based Platform Chemicals Market Volume K Tons Forecast, by Product Type 2020 & 2033
- Table 21: Global Bio-based Platform Chemicals Market Revenue Million Forecast, by Country 2020 & 2033
- Table 22: Global Bio-based Platform Chemicals Market Volume K Tons Forecast, by Country 2020 & 2033
- Table 23: United States Bio-based Platform Chemicals Market Revenue (Million) Forecast, by Application 2020 & 2033
- Table 24: United States Bio-based Platform Chemicals Market Volume (K Tons) Forecast, by Application 2020 & 2033
- Table 25: Canada Bio-based Platform Chemicals Market Revenue (Million) Forecast, by Application 2020 & 2033
- Table 26: Canada Bio-based Platform Chemicals Market Volume (K Tons) Forecast, by Application 2020 & 2033
- Table 27: Mexico Bio-based Platform Chemicals Market Revenue (Million) Forecast, by Application 2020 & 2033
- Table 28: Mexico Bio-based Platform Chemicals Market Volume (K Tons) Forecast, by Application 2020 & 2033
- Table 29: Global Bio-based Platform Chemicals Market Revenue Million Forecast, by Product Type 2020 & 2033
- Table 30: Global Bio-based Platform Chemicals Market Volume K Tons Forecast, by Product Type 2020 & 2033
- Table 31: Global Bio-based Platform Chemicals Market Revenue Million Forecast, by Country 2020 & 2033
- Table 32: Global Bio-based Platform Chemicals Market Volume K Tons Forecast, by Country 2020 & 2033
- Table 33: Germany Bio-based Platform Chemicals Market Revenue (Million) Forecast, by Application 2020 & 2033
- Table 34: Germany Bio-based Platform Chemicals Market Volume (K Tons) Forecast, by Application 2020 & 2033
- Table 35: United Kingdom Bio-based Platform Chemicals Market Revenue (Million) Forecast, by Application 2020 & 2033
- Table 36: United Kingdom Bio-based Platform Chemicals Market Volume (K Tons) Forecast, by Application 2020 & 2033
- Table 37: Italy Bio-based Platform Chemicals Market Revenue (Million) Forecast, by Application 2020 & 2033
- Table 38: Italy Bio-based Platform Chemicals Market Volume (K Tons) Forecast, by Application 2020 & 2033
- Table 39: France Bio-based Platform Chemicals Market Revenue (Million) Forecast, by Application 2020 & 2033
- Table 40: France Bio-based Platform Chemicals Market Volume (K Tons) Forecast, by Application 2020 & 2033
- Table 41: Rest of Europe Bio-based Platform Chemicals Market Revenue (Million) Forecast, by Application 2020 & 2033
- Table 42: Rest of Europe Bio-based Platform Chemicals Market Volume (K Tons) Forecast, by Application 2020 & 2033
- Table 43: Global Bio-based Platform Chemicals Market Revenue Million Forecast, by Product Type 2020 & 2033
- Table 44: Global Bio-based Platform Chemicals Market Volume K Tons Forecast, by Product Type 2020 & 2033
- Table 45: Global Bio-based Platform Chemicals Market Revenue Million Forecast, by Country 2020 & 2033
- Table 46: Global Bio-based Platform Chemicals Market Volume K Tons Forecast, by Country 2020 & 2033
- Table 47: Brazil Bio-based Platform Chemicals Market Revenue (Million) Forecast, by Application 2020 & 2033
- Table 48: Brazil Bio-based Platform Chemicals Market Volume (K Tons) Forecast, by Application 2020 & 2033
- Table 49: Argentina Bio-based Platform Chemicals Market Revenue (Million) Forecast, by Application 2020 & 2033
- Table 50: Argentina Bio-based Platform Chemicals Market Volume (K Tons) Forecast, by Application 2020 & 2033
- Table 51: Rest of South America Bio-based Platform Chemicals Market Revenue (Million) Forecast, by Application 2020 & 2033
- Table 52: Rest of South America Bio-based Platform Chemicals Market Volume (K Tons) Forecast, by Application 2020 & 2033
- Table 53: Global Bio-based Platform Chemicals Market Revenue Million Forecast, by Product Type 2020 & 2033
- Table 54: Global Bio-based Platform Chemicals Market Volume K Tons Forecast, by Product Type 2020 & 2033
- Table 55: Global Bio-based Platform Chemicals Market Revenue Million Forecast, by Country 2020 & 2033
- Table 56: Global Bio-based Platform Chemicals Market Volume K Tons Forecast, by Country 2020 & 2033
- Table 57: South Africa Bio-based Platform Chemicals Market Revenue (Million) Forecast, by Application 2020 & 2033
- Table 58: South Africa Bio-based Platform Chemicals Market Volume (K Tons) Forecast, by Application 2020 & 2033
- Table 59: Saudi Arabia Bio-based Platform Chemicals Market Revenue (Million) Forecast, by Application 2020 & 2033
- Table 60: Saudi Arabia Bio-based Platform Chemicals Market Volume (K Tons) Forecast, by Application 2020 & 2033
- Table 61: Rest of Middle East and Africa Bio-based Platform Chemicals Market Revenue (Million) Forecast, by Application 2020 & 2033
- Table 62: Rest of Middle East and Africa Bio-based Platform Chemicals Market Volume (K Tons) Forecast, by Application 2020 & 2033
Frequently Asked Questions
1. What is the projected Compound Annual Growth Rate (CAGR) of the Bio-based Platform Chemicals Market?
The projected CAGR is approximately 6.61%.
2. Which companies are prominent players in the Bio-based Platform Chemicals Market?
Key companies in the market include PTT Global Chemical Public Company Limited, Cargill Incorporated, Novozymes, Braskem, Evonik Industries AG, Tokyo Chemical Industry Co Ltd *List Not Exhaustive, BASF SE, LyondellBasell Industries Holdings B V, Aktin Chemicals Inc, DSM, DuPont, NIPPON SHOKUBAI CO LTD, Champlor (Valtris Specialty Chemicals), GFBiochemicals Ltd.
3. What are the main segments of the Bio-based Platform Chemicals Market?
The market segments include Product Type.
4. Can you provide details about the market size?
The market size is estimated to be USD 15.41 Million as of 2022.
5. What are some drivers contributing to market growth?
Favorable Government Regulations for Bio-Based Platform Chemicals; Consumer Inclination Towards the Use of Environmental Friendly and Sustainable Products; Other Drivers.
6. What are the notable trends driving market growth?
Bio-Itaconic acid (IA) Segment to Witness Strong Growth.
7. Are there any restraints impacting market growth?
High Cost of Production; Other Restraints.
8. Can you provide examples of recent developments in the market?
Product Launches: Braskem announced the launch of its bio-based polyethylene (PE) resin, which is derived from sugarcane. Evonik introduced its bio-based polyamide 12, which is produced from renewable castor oil.
9. What pricing options are available for accessing the report?
Pricing options include single-user, multi-user, and enterprise licenses priced at USD 4750, USD 5250, and USD 8750 respectively.
10. Is the market size provided in terms of value or volume?
The market size is provided in terms of value, measured in Million and volume, measured in K Tons.
11. Are there any specific market keywords associated with the report?
Yes, the market keyword associated with the report is "Bio-based Platform Chemicals Market," which aids in identifying and referencing the specific market segment covered.
12. How do I determine which pricing option suits my needs best?
The pricing options vary based on user requirements and access needs. Individual users may opt for single-user licenses, while businesses requiring broader access may choose multi-user or enterprise licenses for cost-effective access to the report.
13. Are there any additional resources or data provided in the Bio-based Platform Chemicals Market report?
While the report offers comprehensive insights, it's advisable to review the specific contents or supplementary materials provided to ascertain if additional resources or data are available.
14. How can I stay updated on further developments or reports in the Bio-based Platform Chemicals Market?
To stay informed about further developments, trends, and reports in the Bio-based Platform Chemicals Market, consider subscribing to industry newsletters, following relevant companies and organizations, or regularly checking reputable industry news sources and publications.
Methodology
Step 1 - Identification of Relevant Samples Size from Population Database


Step 2 - Approaches for Defining Global Market Size (Value, Volume* & Price*)

Note*: In applicable scenarios
Step 3 - Data Sources
Primary Research
- Web Analytics
- Survey Reports
- Research Institute
- Latest Research Reports
- Opinion Leaders
Secondary Research
- Annual Reports
- White Paper
- Latest Press Release
- Industry Association
- Paid Database
- Investor Presentations

Step 4 - Data Triangulation
Involves using different sources of information in order to increase the validity of a study
These sources are likely to be stakeholders in a program - participants, other researchers, program staff, other community members, and so on.
Then we put all data in single framework & apply various statistical tools to find out the dynamic on the market.
During the analysis stage, feedback from the stakeholder groups would be compared to determine areas of agreement as well as areas of divergence