

Key Insights
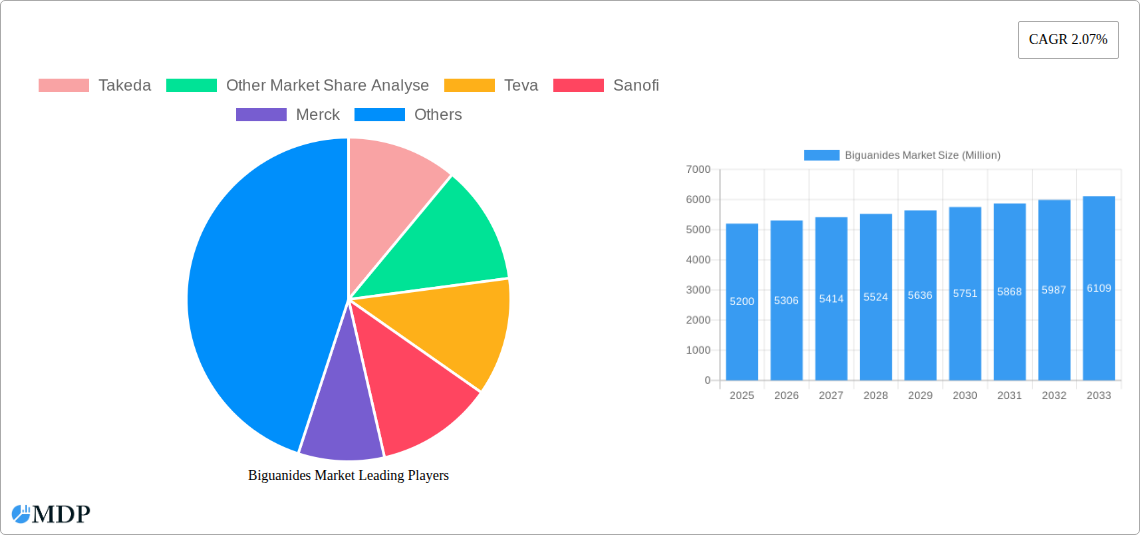
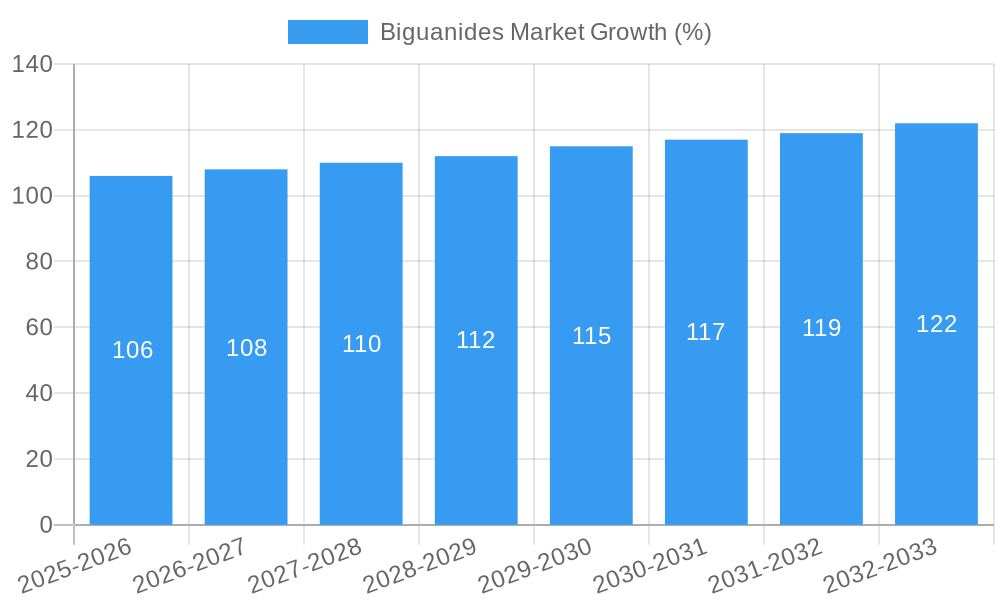
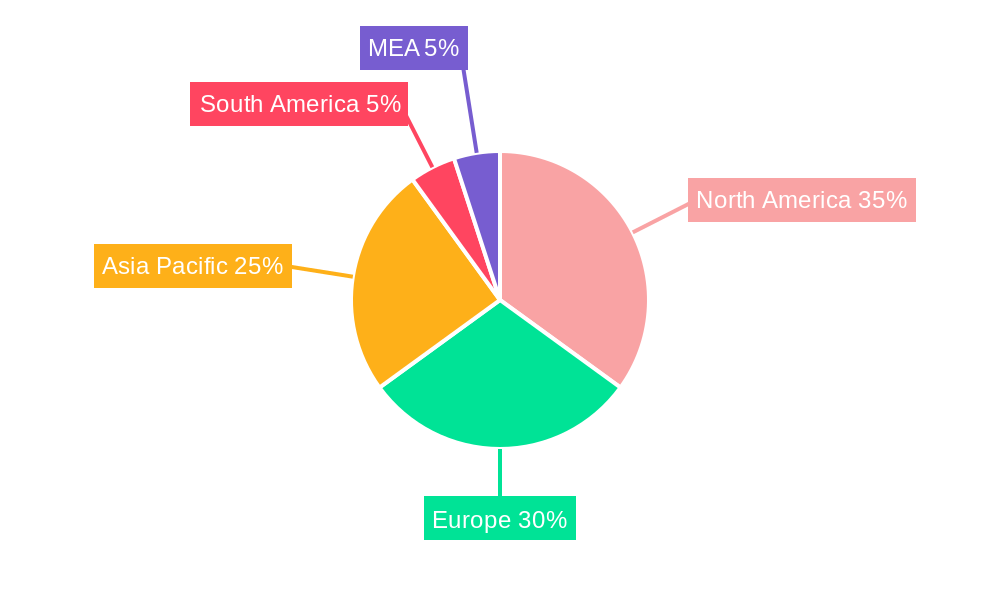
The global Biguanides market, valued at $5.20 billion in 2025, is projected to experience steady growth, driven primarily by the increasing prevalence of type 2 diabetes worldwide. This growth is expected to continue at a Compound Annual Growth Rate (CAGR) of 2.07% from 2025 to 2033, reaching an estimated value exceeding $6.5 billion by the end of the forecast period. Key market drivers include the rising diabetic population, particularly in developing nations, coupled with the cost-effectiveness and established efficacy of biguanides as a first-line treatment for type 2 diabetes. The market is segmented by product type (Metformin and Buformin), with Metformin dominating due to its wider acceptance and established safety profile. The application segment is largely driven by the increasing incidence of type 2 diabetes, though type 1 diabetes also contributes to market demand. While generic competition keeps prices relatively low, innovation in drug delivery systems and formulations could potentially drive future growth. Geographical analysis reveals that North America and Europe currently hold significant market shares, owing to higher healthcare expenditure and advanced healthcare infrastructure. However, rapidly growing economies in Asia Pacific are expected to witness significant growth in the coming years, fuelled by rising diabetes prevalence and increasing healthcare accessibility in these regions. Competitive dynamics are shaped by established pharmaceutical players like Takeda, Sanofi, and Merck, alongside other significant contributors such as Teva, Bristol-Myers Squibb, Glenmark, GlaxoSmithKline, Boehringer Ingelheim, and Zydus. These companies are constantly engaged in strategic initiatives, including research and development of improved formulations, to maintain and enhance their market positions.
The relatively modest CAGR reflects the mature nature of the Biguanides market and the established presence of generic medications. However, the market will continue to expand due to the persistent global rise in diabetes cases. Opportunities for market expansion exist in developing nations through improved access to healthcare and patient education programs. Furthermore, the potential for new formulations or delivery systems that enhance patient adherence and efficacy could create new avenues for growth and differentiation within the market. Regulatory landscape and pricing pressures will continue to influence the market dynamics and profitability of major players. Continuous monitoring of these factors is critical for stakeholders involved in the Biguanides market.
This comprehensive report provides a detailed analysis of the Biguanides market, offering invaluable insights for stakeholders across the pharmaceutical and healthcare industries. Covering the period from 2019 to 2033, with a focus on 2025, this report examines market dynamics, trends, leading players, and future growth opportunities. The Biguanides market, valued at xx Million in 2025, is projected to experience significant growth, reaching xx Million by 2033, exhibiting a CAGR of xx% during the forecast period (2025-2033).
Biguanides Market Dynamics & Concentration
The Biguanides market is characterized by a moderately concentrated landscape, with key players holding significant market share. Market concentration is influenced by factors including regulatory approvals, R&D investments, and successful product launches. The market is primarily driven by the increasing prevalence of Type 2 diabetes globally, fueling demand for effective and affordable treatment options. Furthermore, ongoing innovation in formulation and delivery systems contributes to market growth. Stringent regulatory frameworks, however, pose challenges for new entrants. The existence of substitute treatments also influences market dynamics. Consolidation through mergers and acquisitions (M&A) activities has been observed, though the number of deals is currently estimated at xx annually. End-user preferences are shifting towards more convenient and effective formulations.
- Market Share: Top 5 players account for approximately xx% of the market share in 2025. Detailed market share analysis of Takeda, Teva, Sanofi, Merck, Bristol-Myers Squibb, Glenmark, GlaxoSmithKline, Boehringer Ingelheim, and Zydus is included in the full report.
- M&A Activity: xx M&A deals were recorded between 2019 and 2024. The report analyzes the impact of these deals on market dynamics.
- Innovation Drivers: Development of novel formulations (e.g., extended-release metformin) and combination therapies are key innovation drivers.
- Regulatory Framework: Stringent regulatory approvals for new drug launches and ongoing safety monitoring impact market growth.
- Product Substitutes: Other anti-diabetic drugs compete with biguanides, influencing market share.
Biguanides Market Industry Trends & Analysis
The Biguanides market is witnessing robust growth, propelled by several factors. The rising prevalence of diabetes globally is a major driver, with Type 2 diabetes accounting for the majority of cases. Technological advancements in drug delivery systems and combination therapies are enhancing treatment efficacy and patient compliance. Consumer preference is increasingly oriented towards convenient oral formulations with minimal side effects. Competitive dynamics are intense, with established players focusing on expanding their product portfolios and entering new markets. The market exhibits significant regional variations, with developed economies showing higher market penetration due to better healthcare infrastructure and awareness.
- CAGR (2025-2033): xx%
- Market Penetration: xx% in developed economies, xx% in developing economies by 2025.
Leading Markets & Segments in Biguanides Market
The Biguanides market is dominated by the Type 2 diabetes segment, representing approximately xx% of the total market value in 2025. Metformin is the dominant product type, holding the majority of the market share due to its established efficacy, safety profile, and affordability. Geographically, North America and Europe currently hold the largest market share, driven by high diabetes prevalence and advanced healthcare infrastructure. However, developing economies in Asia-Pacific are projected to witness the fastest growth.
- Key Drivers for Type 2 Diabetes Segment: Rising prevalence, increasing awareness, improved access to healthcare.
- Key Drivers for Metformin Segment: Cost-effectiveness, established efficacy, wide availability.
- Dominant Region: North America; however, Asia-Pacific is expected to show the highest growth rate.
- Dominant Country: USA followed by China and India.
Biguanides Market Product Developments
Recent product developments include improved formulations of metformin, such as extended-release versions, designed to improve patient compliance and reduce side effects. The focus is on combination therapies with other anti-diabetic agents to enhance glycemic control. These advancements contribute to the market’s expansion by providing better treatment options for patients with diverse needs and enhancing the overall efficacy of treatment regimens.
Key Drivers of Biguanides Market Growth
The Biguanides market's growth is significantly driven by the escalating prevalence of diabetes, particularly Type 2 diabetes, worldwide. Economic factors, such as rising disposable incomes and increased healthcare spending in emerging markets, also play a significant role. Favorable regulatory environments that facilitate drug approvals and market entry further contribute to market expansion. Finally, technological advancements leading to improved formulations and combination therapies enhance market growth.
Challenges in the Biguanides Market Market
The market faces challenges from the increasing availability of alternative anti-diabetic medications, leading to increased competition. Regulatory hurdles in certain regions can delay drug approvals and market entry. Supply chain disruptions can impact the availability and cost of biguanides. Additionally, the prevalence of side effects associated with metformin, such as gastrointestinal issues, can limit its uptake. These factors collectively impact market growth and profitability.
Emerging Opportunities in Biguanides Market
Emerging opportunities lie in the development of novel, more efficient delivery systems and combination therapies. Strategic partnerships between pharmaceutical companies and healthcare providers can enhance market access and patient reach. Expansion into emerging markets with high diabetes prevalence represents significant untapped potential. These factors present lucrative avenues for future growth and innovation within the Biguanides market.
Leading Players in the Biguanides Market Sector
- Takeda
- Other Market Share Analyse
- Teva
- Sanofi
- Merck
- Bristol-Myers Squibb
- Glenmark
- GlaxoSmithKline
- Boehringer Ingelheim
- Zydus
Key Milestones in Biguanides Market Industry
- February 2023: Zydus Lifesciences Limited received tentative approval from the USFDA for Invokamet tablets (canagliflozin and metformin hydrochloride combination), expanding treatment options for Type 2 diabetes.
- February 2022: Merck received approval for extended use of its metformin products (Glucophage, Glucophage XR, and Stagid) throughout pregnancy in the European Union, based on the CLUE study, potentially increasing market share.
Strategic Outlook for Biguanides Market Market
The Biguanides market is poised for continued growth driven by the persistent increase in diabetes prevalence globally and the ongoing development of innovative formulations and combination therapies. Strategic opportunities lie in expanding into underserved markets, focusing on personalized medicine approaches, and leveraging technological advancements to improve treatment outcomes. These factors will significantly influence the market's future trajectory.
Biguanides Market Segmentation
-
1. Product Type
- 1.1. Metformin
- 1.2. Buformin
-
2. Application
- 2.1. Type 1 Diabetes
- 2.2. Type 2 Diabetes
Biguanides Market Segmentation By Geography
-
1. North America
- 1.1. United States
- 1.2. Canada
- 1.3. Rest of North America
-
2. Europe
- 2.1. Germany
- 2.2. Spain
- 2.3. Italy
- 2.4. France
- 2.5. United Kingdom
- 2.6. Russia
- 2.7. Rest of Europe
-
3. Asia Pacific
- 3.1. Japan
- 3.2. China
- 3.3. Australia
- 3.4. India
- 3.5. South Korea
- 3.6. Malaysia
- 3.7. Indonesia
- 3.8. Thailand
- 3.9. Philippines
- 3.10. Vietnam
- 3.11. Rest of Asia Pacific
-
4. Latin America
- 4.1. Brazil
- 4.2. Mexico
- 4.3. Rest of Latin America
-
5. Middle East and Africa
- 5.1. South Africa
- 5.2. Saudi Arabia
- 5.3. Oman
- 5.4. Egypt
- 5.5. Iran
- 5.6. Rest of Middle East and Africa
Biguanides Market REPORT HIGHLIGHTS
| Aspects | Details |
|---|---|
| Study Period | 2019-2033 |
| Base Year | 2024 |
| Estimated Year | 2025 |
| Forecast Period | 2025-2033 |
| Historical Period | 2019-2024 |
| Growth Rate | CAGR of 2.07% from 2019-2033 |
| Segmentation |
|
Table of Contents
- 1. Introduction
- 1.1. Research Scope
- 1.2. Market Segmentation
- 1.3. Research Methodology
- 1.4. Definitions and Assumptions
- 2. Executive Summary
- 2.1. Introduction
- 3. Market Dynamics
- 3.1. Introduction
- 3.2. Market Drivers
- 3.2.1. Growing Prevalence of Respiratory Diseases; Technological Advancements Owing to Telehealth and Remote Patient Monitoring; Improved Medication Adherence
- 3.3. Market Restrains
- 3.3.1. Availability of Traditional Inhalers as a Substitute; High Cost Associated with These Advanced Devices
- 3.4. Market Trends
- 3.4.1. Rising diabetes prevalence globally
- 4. Market Factor Analysis
- 4.1. Porters Five Forces
- 4.2. Supply/Value Chain
- 4.3. PESTEL analysis
- 4.4. Market Entropy
- 4.5. Patent/Trademark Analysis
- 5. Global Biguanides Market Analysis, Insights and Forecast, 2019-2031
- 5.1. Market Analysis, Insights and Forecast - by Product Type
- 5.1.1. Metformin
- 5.1.2. Buformin
- 5.2. Market Analysis, Insights and Forecast - by Application
- 5.2.1. Type 1 Diabetes
- 5.2.2. Type 2 Diabetes
- 5.3. Market Analysis, Insights and Forecast - by Region
- 5.3.1. North America
- 5.3.2. Europe
- 5.3.3. Asia Pacific
- 5.3.4. Latin America
- 5.3.5. Middle East and Africa
- 5.1. Market Analysis, Insights and Forecast - by Product Type
- 6. North America Biguanides Market Analysis, Insights and Forecast, 2019-2031
- 6.1. Market Analysis, Insights and Forecast - by Product Type
- 6.1.1. Metformin
- 6.1.2. Buformin
- 6.2. Market Analysis, Insights and Forecast - by Application
- 6.2.1. Type 1 Diabetes
- 6.2.2. Type 2 Diabetes
- 6.1. Market Analysis, Insights and Forecast - by Product Type
- 7. Europe Biguanides Market Analysis, Insights and Forecast, 2019-2031
- 7.1. Market Analysis, Insights and Forecast - by Product Type
- 7.1.1. Metformin
- 7.1.2. Buformin
- 7.2. Market Analysis, Insights and Forecast - by Application
- 7.2.1. Type 1 Diabetes
- 7.2.2. Type 2 Diabetes
- 7.1. Market Analysis, Insights and Forecast - by Product Type
- 8. Asia Pacific Biguanides Market Analysis, Insights and Forecast, 2019-2031
- 8.1. Market Analysis, Insights and Forecast - by Product Type
- 8.1.1. Metformin
- 8.1.2. Buformin
- 8.2. Market Analysis, Insights and Forecast - by Application
- 8.2.1. Type 1 Diabetes
- 8.2.2. Type 2 Diabetes
- 8.1. Market Analysis, Insights and Forecast - by Product Type
- 9. Latin America Biguanides Market Analysis, Insights and Forecast, 2019-2031
- 9.1. Market Analysis, Insights and Forecast - by Product Type
- 9.1.1. Metformin
- 9.1.2. Buformin
- 9.2. Market Analysis, Insights and Forecast - by Application
- 9.2.1. Type 1 Diabetes
- 9.2.2. Type 2 Diabetes
- 9.1. Market Analysis, Insights and Forecast - by Product Type
- 10. Middle East and Africa Biguanides Market Analysis, Insights and Forecast, 2019-2031
- 10.1. Market Analysis, Insights and Forecast - by Product Type
- 10.1.1. Metformin
- 10.1.2. Buformin
- 10.2. Market Analysis, Insights and Forecast - by Application
- 10.2.1. Type 1 Diabetes
- 10.2.2. Type 2 Diabetes
- 10.1. Market Analysis, Insights and Forecast - by Product Type
- 11. North America Biguanides Market Analysis, Insights and Forecast, 2019-2031
- 11.1. Market Analysis, Insights and Forecast - By Country/Sub-region
- 11.1.1 United States
- 11.1.2 Canada
- 11.1.3 Mexico
- 12. Europe Biguanides Market Analysis, Insights and Forecast, 2019-2031
- 12.1. Market Analysis, Insights and Forecast - By Country/Sub-region
- 12.1.1 Germany
- 12.1.2 United Kingdom
- 12.1.3 France
- 12.1.4 Spain
- 12.1.5 Italy
- 12.1.6 Spain
- 12.1.7 Belgium
- 12.1.8 Netherland
- 12.1.9 Nordics
- 12.1.10 Rest of Europe
- 13. Asia Pacific Biguanides Market Analysis, Insights and Forecast, 2019-2031
- 13.1. Market Analysis, Insights and Forecast - By Country/Sub-region
- 13.1.1 China
- 13.1.2 Japan
- 13.1.3 India
- 13.1.4 South Korea
- 13.1.5 Southeast Asia
- 13.1.6 Australia
- 13.1.7 Indonesia
- 13.1.8 Phillipes
- 13.1.9 Singapore
- 13.1.10 Thailandc
- 13.1.11 Rest of Asia Pacific
- 14. South America Biguanides Market Analysis, Insights and Forecast, 2019-2031
- 14.1. Market Analysis, Insights and Forecast - By Country/Sub-region
- 14.1.1 Brazil
- 14.1.2 Argentina
- 14.1.3 Peru
- 14.1.4 Chile
- 14.1.5 Colombia
- 14.1.6 Ecuador
- 14.1.7 Venezuela
- 14.1.8 Rest of South America
- 15. MEA Biguanides Market Analysis, Insights and Forecast, 2019-2031
- 15.1. Market Analysis, Insights and Forecast - By Country/Sub-region
- 15.1.1 United Arab Emirates
- 15.1.2 Saudi Arabia
- 15.1.3 South Africa
- 15.1.4 Rest of Middle East and Africa
- 16. Competitive Analysis
- 16.1. Global Market Share Analysis 2024
- 16.2. Company Profiles
- 16.2.1 Takeda
- 16.2.1.1. Overview
- 16.2.1.2. Products
- 16.2.1.3. SWOT Analysis
- 16.2.1.4. Recent Developments
- 16.2.1.5. Financials (Based on Availability)
- 16.2.2 Other Market Share Analyse
- 16.2.2.1. Overview
- 16.2.2.2. Products
- 16.2.2.3. SWOT Analysis
- 16.2.2.4. Recent Developments
- 16.2.2.5. Financials (Based on Availability)
- 16.2.3 Teva
- 16.2.3.1. Overview
- 16.2.3.2. Products
- 16.2.3.3. SWOT Analysis
- 16.2.3.4. Recent Developments
- 16.2.3.5. Financials (Based on Availability)
- 16.2.4 Sanofi
- 16.2.4.1. Overview
- 16.2.4.2. Products
- 16.2.4.3. SWOT Analysis
- 16.2.4.4. Recent Developments
- 16.2.4.5. Financials (Based on Availability)
- 16.2.5 Merck
- 16.2.5.1. Overview
- 16.2.5.2. Products
- 16.2.5.3. SWOT Analysis
- 16.2.5.4. Recent Developments
- 16.2.5.5. Financials (Based on Availability)
- 16.2.6 Bristol-Myers Squibb
- 16.2.6.1. Overview
- 16.2.6.2. Products
- 16.2.6.3. SWOT Analysis
- 16.2.6.4. Recent Developments
- 16.2.6.5. Financials (Based on Availability)
- 16.2.7 Glenmark
- 16.2.7.1. Overview
- 16.2.7.2. Products
- 16.2.7.3. SWOT Analysis
- 16.2.7.4. Recent Developments
- 16.2.7.5. Financials (Based on Availability)
- 16.2.8 GlaxoSmithKline
- 16.2.8.1. Overview
- 16.2.8.2. Products
- 16.2.8.3. SWOT Analysis
- 16.2.8.4. Recent Developments
- 16.2.8.5. Financials (Based on Availability)
- 16.2.9 Boehringer Ingelheim
- 16.2.9.1. Overview
- 16.2.9.2. Products
- 16.2.9.3. SWOT Analysis
- 16.2.9.4. Recent Developments
- 16.2.9.5. Financials (Based on Availability)
- 16.2.10 Zydus
- 16.2.10.1. Overview
- 16.2.10.2. Products
- 16.2.10.3. SWOT Analysis
- 16.2.10.4. Recent Developments
- 16.2.10.5. Financials (Based on Availability)
- 16.2.1 Takeda
List of Figures
- Figure 1: Global Biguanides Market Revenue Breakdown (Million, %) by Region 2024 & 2032
- Figure 2: Global Biguanides Market Volume Breakdown (K Unit, %) by Region 2024 & 2032
- Figure 3: North America Biguanides Market Revenue (Million), by Country 2024 & 2032
- Figure 4: North America Biguanides Market Volume (K Unit), by Country 2024 & 2032
- Figure 5: North America Biguanides Market Revenue Share (%), by Country 2024 & 2032
- Figure 6: North America Biguanides Market Volume Share (%), by Country 2024 & 2032
- Figure 7: Europe Biguanides Market Revenue (Million), by Country 2024 & 2032
- Figure 8: Europe Biguanides Market Volume (K Unit), by Country 2024 & 2032
- Figure 9: Europe Biguanides Market Revenue Share (%), by Country 2024 & 2032
- Figure 10: Europe Biguanides Market Volume Share (%), by Country 2024 & 2032
- Figure 11: Asia Pacific Biguanides Market Revenue (Million), by Country 2024 & 2032
- Figure 12: Asia Pacific Biguanides Market Volume (K Unit), by Country 2024 & 2032
- Figure 13: Asia Pacific Biguanides Market Revenue Share (%), by Country 2024 & 2032
- Figure 14: Asia Pacific Biguanides Market Volume Share (%), by Country 2024 & 2032
- Figure 15: South America Biguanides Market Revenue (Million), by Country 2024 & 2032
- Figure 16: South America Biguanides Market Volume (K Unit), by Country 2024 & 2032
- Figure 17: South America Biguanides Market Revenue Share (%), by Country 2024 & 2032
- Figure 18: South America Biguanides Market Volume Share (%), by Country 2024 & 2032
- Figure 19: MEA Biguanides Market Revenue (Million), by Country 2024 & 2032
- Figure 20: MEA Biguanides Market Volume (K Unit), by Country 2024 & 2032
- Figure 21: MEA Biguanides Market Revenue Share (%), by Country 2024 & 2032
- Figure 22: MEA Biguanides Market Volume Share (%), by Country 2024 & 2032
- Figure 23: North America Biguanides Market Revenue (Million), by Product Type 2024 & 2032
- Figure 24: North America Biguanides Market Volume (K Unit), by Product Type 2024 & 2032
- Figure 25: North America Biguanides Market Revenue Share (%), by Product Type 2024 & 2032
- Figure 26: North America Biguanides Market Volume Share (%), by Product Type 2024 & 2032
- Figure 27: North America Biguanides Market Revenue (Million), by Application 2024 & 2032
- Figure 28: North America Biguanides Market Volume (K Unit), by Application 2024 & 2032
- Figure 29: North America Biguanides Market Revenue Share (%), by Application 2024 & 2032
- Figure 30: North America Biguanides Market Volume Share (%), by Application 2024 & 2032
- Figure 31: North America Biguanides Market Revenue (Million), by Country 2024 & 2032
- Figure 32: North America Biguanides Market Volume (K Unit), by Country 2024 & 2032
- Figure 33: North America Biguanides Market Revenue Share (%), by Country 2024 & 2032
- Figure 34: North America Biguanides Market Volume Share (%), by Country 2024 & 2032
- Figure 35: Europe Biguanides Market Revenue (Million), by Product Type 2024 & 2032
- Figure 36: Europe Biguanides Market Volume (K Unit), by Product Type 2024 & 2032
- Figure 37: Europe Biguanides Market Revenue Share (%), by Product Type 2024 & 2032
- Figure 38: Europe Biguanides Market Volume Share (%), by Product Type 2024 & 2032
- Figure 39: Europe Biguanides Market Revenue (Million), by Application 2024 & 2032
- Figure 40: Europe Biguanides Market Volume (K Unit), by Application 2024 & 2032
- Figure 41: Europe Biguanides Market Revenue Share (%), by Application 2024 & 2032
- Figure 42: Europe Biguanides Market Volume Share (%), by Application 2024 & 2032
- Figure 43: Europe Biguanides Market Revenue (Million), by Country 2024 & 2032
- Figure 44: Europe Biguanides Market Volume (K Unit), by Country 2024 & 2032
- Figure 45: Europe Biguanides Market Revenue Share (%), by Country 2024 & 2032
- Figure 46: Europe Biguanides Market Volume Share (%), by Country 2024 & 2032
- Figure 47: Asia Pacific Biguanides Market Revenue (Million), by Product Type 2024 & 2032
- Figure 48: Asia Pacific Biguanides Market Volume (K Unit), by Product Type 2024 & 2032
- Figure 49: Asia Pacific Biguanides Market Revenue Share (%), by Product Type 2024 & 2032
- Figure 50: Asia Pacific Biguanides Market Volume Share (%), by Product Type 2024 & 2032
- Figure 51: Asia Pacific Biguanides Market Revenue (Million), by Application 2024 & 2032
- Figure 52: Asia Pacific Biguanides Market Volume (K Unit), by Application 2024 & 2032
- Figure 53: Asia Pacific Biguanides Market Revenue Share (%), by Application 2024 & 2032
- Figure 54: Asia Pacific Biguanides Market Volume Share (%), by Application 2024 & 2032
- Figure 55: Asia Pacific Biguanides Market Revenue (Million), by Country 2024 & 2032
- Figure 56: Asia Pacific Biguanides Market Volume (K Unit), by Country 2024 & 2032
- Figure 57: Asia Pacific Biguanides Market Revenue Share (%), by Country 2024 & 2032
- Figure 58: Asia Pacific Biguanides Market Volume Share (%), by Country 2024 & 2032
- Figure 59: Latin America Biguanides Market Revenue (Million), by Product Type 2024 & 2032
- Figure 60: Latin America Biguanides Market Volume (K Unit), by Product Type 2024 & 2032
- Figure 61: Latin America Biguanides Market Revenue Share (%), by Product Type 2024 & 2032
- Figure 62: Latin America Biguanides Market Volume Share (%), by Product Type 2024 & 2032
- Figure 63: Latin America Biguanides Market Revenue (Million), by Application 2024 & 2032
- Figure 64: Latin America Biguanides Market Volume (K Unit), by Application 2024 & 2032
- Figure 65: Latin America Biguanides Market Revenue Share (%), by Application 2024 & 2032
- Figure 66: Latin America Biguanides Market Volume Share (%), by Application 2024 & 2032
- Figure 67: Latin America Biguanides Market Revenue (Million), by Country 2024 & 2032
- Figure 68: Latin America Biguanides Market Volume (K Unit), by Country 2024 & 2032
- Figure 69: Latin America Biguanides Market Revenue Share (%), by Country 2024 & 2032
- Figure 70: Latin America Biguanides Market Volume Share (%), by Country 2024 & 2032
- Figure 71: Middle East and Africa Biguanides Market Revenue (Million), by Product Type 2024 & 2032
- Figure 72: Middle East and Africa Biguanides Market Volume (K Unit), by Product Type 2024 & 2032
- Figure 73: Middle East and Africa Biguanides Market Revenue Share (%), by Product Type 2024 & 2032
- Figure 74: Middle East and Africa Biguanides Market Volume Share (%), by Product Type 2024 & 2032
- Figure 75: Middle East and Africa Biguanides Market Revenue (Million), by Application 2024 & 2032
- Figure 76: Middle East and Africa Biguanides Market Volume (K Unit), by Application 2024 & 2032
- Figure 77: Middle East and Africa Biguanides Market Revenue Share (%), by Application 2024 & 2032
- Figure 78: Middle East and Africa Biguanides Market Volume Share (%), by Application 2024 & 2032
- Figure 79: Middle East and Africa Biguanides Market Revenue (Million), by Country 2024 & 2032
- Figure 80: Middle East and Africa Biguanides Market Volume (K Unit), by Country 2024 & 2032
- Figure 81: Middle East and Africa Biguanides Market Revenue Share (%), by Country 2024 & 2032
- Figure 82: Middle East and Africa Biguanides Market Volume Share (%), by Country 2024 & 2032
List of Tables
- Table 1: Global Biguanides Market Revenue Million Forecast, by Region 2019 & 2032
- Table 2: Global Biguanides Market Volume K Unit Forecast, by Region 2019 & 2032
- Table 3: Global Biguanides Market Revenue Million Forecast, by Product Type 2019 & 2032
- Table 4: Global Biguanides Market Volume K Unit Forecast, by Product Type 2019 & 2032
- Table 5: Global Biguanides Market Revenue Million Forecast, by Application 2019 & 2032
- Table 6: Global Biguanides Market Volume K Unit Forecast, by Application 2019 & 2032
- Table 7: Global Biguanides Market Revenue Million Forecast, by Region 2019 & 2032
- Table 8: Global Biguanides Market Volume K Unit Forecast, by Region 2019 & 2032
- Table 9: Global Biguanides Market Revenue Million Forecast, by Country 2019 & 2032
- Table 10: Global Biguanides Market Volume K Unit Forecast, by Country 2019 & 2032
- Table 11: United States Biguanides Market Revenue (Million) Forecast, by Application 2019 & 2032
- Table 12: United States Biguanides Market Volume (K Unit) Forecast, by Application 2019 & 2032
- Table 13: Canada Biguanides Market Revenue (Million) Forecast, by Application 2019 & 2032
- Table 14: Canada Biguanides Market Volume (K Unit) Forecast, by Application 2019 & 2032
- Table 15: Mexico Biguanides Market Revenue (Million) Forecast, by Application 2019 & 2032
- Table 16: Mexico Biguanides Market Volume (K Unit) Forecast, by Application 2019 & 2032
- Table 17: Global Biguanides Market Revenue Million Forecast, by Country 2019 & 2032
- Table 18: Global Biguanides Market Volume K Unit Forecast, by Country 2019 & 2032
- Table 19: Germany Biguanides Market Revenue (Million) Forecast, by Application 2019 & 2032
- Table 20: Germany Biguanides Market Volume (K Unit) Forecast, by Application 2019 & 2032
- Table 21: United Kingdom Biguanides Market Revenue (Million) Forecast, by Application 2019 & 2032
- Table 22: United Kingdom Biguanides Market Volume (K Unit) Forecast, by Application 2019 & 2032
- Table 23: France Biguanides Market Revenue (Million) Forecast, by Application 2019 & 2032
- Table 24: France Biguanides Market Volume (K Unit) Forecast, by Application 2019 & 2032
- Table 25: Spain Biguanides Market Revenue (Million) Forecast, by Application 2019 & 2032
- Table 26: Spain Biguanides Market Volume (K Unit) Forecast, by Application 2019 & 2032
- Table 27: Italy Biguanides Market Revenue (Million) Forecast, by Application 2019 & 2032
- Table 28: Italy Biguanides Market Volume (K Unit) Forecast, by Application 2019 & 2032
- Table 29: Spain Biguanides Market Revenue (Million) Forecast, by Application 2019 & 2032
- Table 30: Spain Biguanides Market Volume (K Unit) Forecast, by Application 2019 & 2032
- Table 31: Belgium Biguanides Market Revenue (Million) Forecast, by Application 2019 & 2032
- Table 32: Belgium Biguanides Market Volume (K Unit) Forecast, by Application 2019 & 2032
- Table 33: Netherland Biguanides Market Revenue (Million) Forecast, by Application 2019 & 2032
- Table 34: Netherland Biguanides Market Volume (K Unit) Forecast, by Application 2019 & 2032
- Table 35: Nordics Biguanides Market Revenue (Million) Forecast, by Application 2019 & 2032
- Table 36: Nordics Biguanides Market Volume (K Unit) Forecast, by Application 2019 & 2032
- Table 37: Rest of Europe Biguanides Market Revenue (Million) Forecast, by Application 2019 & 2032
- Table 38: Rest of Europe Biguanides Market Volume (K Unit) Forecast, by Application 2019 & 2032
- Table 39: Global Biguanides Market Revenue Million Forecast, by Country 2019 & 2032
- Table 40: Global Biguanides Market Volume K Unit Forecast, by Country 2019 & 2032
- Table 41: China Biguanides Market Revenue (Million) Forecast, by Application 2019 & 2032
- Table 42: China Biguanides Market Volume (K Unit) Forecast, by Application 2019 & 2032
- Table 43: Japan Biguanides Market Revenue (Million) Forecast, by Application 2019 & 2032
- Table 44: Japan Biguanides Market Volume (K Unit) Forecast, by Application 2019 & 2032
- Table 45: India Biguanides Market Revenue (Million) Forecast, by Application 2019 & 2032
- Table 46: India Biguanides Market Volume (K Unit) Forecast, by Application 2019 & 2032
- Table 47: South Korea Biguanides Market Revenue (Million) Forecast, by Application 2019 & 2032
- Table 48: South Korea Biguanides Market Volume (K Unit) Forecast, by Application 2019 & 2032
- Table 49: Southeast Asia Biguanides Market Revenue (Million) Forecast, by Application 2019 & 2032
- Table 50: Southeast Asia Biguanides Market Volume (K Unit) Forecast, by Application 2019 & 2032
- Table 51: Australia Biguanides Market Revenue (Million) Forecast, by Application 2019 & 2032
- Table 52: Australia Biguanides Market Volume (K Unit) Forecast, by Application 2019 & 2032
- Table 53: Indonesia Biguanides Market Revenue (Million) Forecast, by Application 2019 & 2032
- Table 54: Indonesia Biguanides Market Volume (K Unit) Forecast, by Application 2019 & 2032
- Table 55: Phillipes Biguanides Market Revenue (Million) Forecast, by Application 2019 & 2032
- Table 56: Phillipes Biguanides Market Volume (K Unit) Forecast, by Application 2019 & 2032
- Table 57: Singapore Biguanides Market Revenue (Million) Forecast, by Application 2019 & 2032
- Table 58: Singapore Biguanides Market Volume (K Unit) Forecast, by Application 2019 & 2032
- Table 59: Thailandc Biguanides Market Revenue (Million) Forecast, by Application 2019 & 2032
- Table 60: Thailandc Biguanides Market Volume (K Unit) Forecast, by Application 2019 & 2032
- Table 61: Rest of Asia Pacific Biguanides Market Revenue (Million) Forecast, by Application 2019 & 2032
- Table 62: Rest of Asia Pacific Biguanides Market Volume (K Unit) Forecast, by Application 2019 & 2032
- Table 63: Global Biguanides Market Revenue Million Forecast, by Country 2019 & 2032
- Table 64: Global Biguanides Market Volume K Unit Forecast, by Country 2019 & 2032
- Table 65: Brazil Biguanides Market Revenue (Million) Forecast, by Application 2019 & 2032
- Table 66: Brazil Biguanides Market Volume (K Unit) Forecast, by Application 2019 & 2032
- Table 67: Argentina Biguanides Market Revenue (Million) Forecast, by Application 2019 & 2032
- Table 68: Argentina Biguanides Market Volume (K Unit) Forecast, by Application 2019 & 2032
- Table 69: Peru Biguanides Market Revenue (Million) Forecast, by Application 2019 & 2032
- Table 70: Peru Biguanides Market Volume (K Unit) Forecast, by Application 2019 & 2032
- Table 71: Chile Biguanides Market Revenue (Million) Forecast, by Application 2019 & 2032
- Table 72: Chile Biguanides Market Volume (K Unit) Forecast, by Application 2019 & 2032
- Table 73: Colombia Biguanides Market Revenue (Million) Forecast, by Application 2019 & 2032
- Table 74: Colombia Biguanides Market Volume (K Unit) Forecast, by Application 2019 & 2032
- Table 75: Ecuador Biguanides Market Revenue (Million) Forecast, by Application 2019 & 2032
- Table 76: Ecuador Biguanides Market Volume (K Unit) Forecast, by Application 2019 & 2032
- Table 77: Venezuela Biguanides Market Revenue (Million) Forecast, by Application 2019 & 2032
- Table 78: Venezuela Biguanides Market Volume (K Unit) Forecast, by Application 2019 & 2032
- Table 79: Rest of South America Biguanides Market Revenue (Million) Forecast, by Application 2019 & 2032
- Table 80: Rest of South America Biguanides Market Volume (K Unit) Forecast, by Application 2019 & 2032
- Table 81: Global Biguanides Market Revenue Million Forecast, by Country 2019 & 2032
- Table 82: Global Biguanides Market Volume K Unit Forecast, by Country 2019 & 2032
- Table 83: United Arab Emirates Biguanides Market Revenue (Million) Forecast, by Application 2019 & 2032
- Table 84: United Arab Emirates Biguanides Market Volume (K Unit) Forecast, by Application 2019 & 2032
- Table 85: Saudi Arabia Biguanides Market Revenue (Million) Forecast, by Application 2019 & 2032
- Table 86: Saudi Arabia Biguanides Market Volume (K Unit) Forecast, by Application 2019 & 2032
- Table 87: South Africa Biguanides Market Revenue (Million) Forecast, by Application 2019 & 2032
- Table 88: South Africa Biguanides Market Volume (K Unit) Forecast, by Application 2019 & 2032
- Table 89: Rest of Middle East and Africa Biguanides Market Revenue (Million) Forecast, by Application 2019 & 2032
- Table 90: Rest of Middle East and Africa Biguanides Market Volume (K Unit) Forecast, by Application 2019 & 2032
- Table 91: Global Biguanides Market Revenue Million Forecast, by Product Type 2019 & 2032
- Table 92: Global Biguanides Market Volume K Unit Forecast, by Product Type 2019 & 2032
- Table 93: Global Biguanides Market Revenue Million Forecast, by Application 2019 & 2032
- Table 94: Global Biguanides Market Volume K Unit Forecast, by Application 2019 & 2032
- Table 95: Global Biguanides Market Revenue Million Forecast, by Country 2019 & 2032
- Table 96: Global Biguanides Market Volume K Unit Forecast, by Country 2019 & 2032
- Table 97: United States Biguanides Market Revenue (Million) Forecast, by Application 2019 & 2032
- Table 98: United States Biguanides Market Volume (K Unit) Forecast, by Application 2019 & 2032
- Table 99: Canada Biguanides Market Revenue (Million) Forecast, by Application 2019 & 2032
- Table 100: Canada Biguanides Market Volume (K Unit) Forecast, by Application 2019 & 2032
- Table 101: Rest of North America Biguanides Market Revenue (Million) Forecast, by Application 2019 & 2032
- Table 102: Rest of North America Biguanides Market Volume (K Unit) Forecast, by Application 2019 & 2032
- Table 103: Global Biguanides Market Revenue Million Forecast, by Product Type 2019 & 2032
- Table 104: Global Biguanides Market Volume K Unit Forecast, by Product Type 2019 & 2032
- Table 105: Global Biguanides Market Revenue Million Forecast, by Application 2019 & 2032
- Table 106: Global Biguanides Market Volume K Unit Forecast, by Application 2019 & 2032
- Table 107: Global Biguanides Market Revenue Million Forecast, by Country 2019 & 2032
- Table 108: Global Biguanides Market Volume K Unit Forecast, by Country 2019 & 2032
- Table 109: Germany Biguanides Market Revenue (Million) Forecast, by Application 2019 & 2032
- Table 110: Germany Biguanides Market Volume (K Unit) Forecast, by Application 2019 & 2032
- Table 111: Spain Biguanides Market Revenue (Million) Forecast, by Application 2019 & 2032
- Table 112: Spain Biguanides Market Volume (K Unit) Forecast, by Application 2019 & 2032
- Table 113: Italy Biguanides Market Revenue (Million) Forecast, by Application 2019 & 2032
- Table 114: Italy Biguanides Market Volume (K Unit) Forecast, by Application 2019 & 2032
- Table 115: France Biguanides Market Revenue (Million) Forecast, by Application 2019 & 2032
- Table 116: France Biguanides Market Volume (K Unit) Forecast, by Application 2019 & 2032
- Table 117: United Kingdom Biguanides Market Revenue (Million) Forecast, by Application 2019 & 2032
- Table 118: United Kingdom Biguanides Market Volume (K Unit) Forecast, by Application 2019 & 2032
- Table 119: Russia Biguanides Market Revenue (Million) Forecast, by Application 2019 & 2032
- Table 120: Russia Biguanides Market Volume (K Unit) Forecast, by Application 2019 & 2032
- Table 121: Rest of Europe Biguanides Market Revenue (Million) Forecast, by Application 2019 & 2032
- Table 122: Rest of Europe Biguanides Market Volume (K Unit) Forecast, by Application 2019 & 2032
- Table 123: Global Biguanides Market Revenue Million Forecast, by Product Type 2019 & 2032
- Table 124: Global Biguanides Market Volume K Unit Forecast, by Product Type 2019 & 2032
- Table 125: Global Biguanides Market Revenue Million Forecast, by Application 2019 & 2032
- Table 126: Global Biguanides Market Volume K Unit Forecast, by Application 2019 & 2032
- Table 127: Global Biguanides Market Revenue Million Forecast, by Country 2019 & 2032
- Table 128: Global Biguanides Market Volume K Unit Forecast, by Country 2019 & 2032
- Table 129: Japan Biguanides Market Revenue (Million) Forecast, by Application 2019 & 2032
- Table 130: Japan Biguanides Market Volume (K Unit) Forecast, by Application 2019 & 2032
- Table 131: China Biguanides Market Revenue (Million) Forecast, by Application 2019 & 2032
- Table 132: China Biguanides Market Volume (K Unit) Forecast, by Application 2019 & 2032
- Table 133: Australia Biguanides Market Revenue (Million) Forecast, by Application 2019 & 2032
- Table 134: Australia Biguanides Market Volume (K Unit) Forecast, by Application 2019 & 2032
- Table 135: India Biguanides Market Revenue (Million) Forecast, by Application 2019 & 2032
- Table 136: India Biguanides Market Volume (K Unit) Forecast, by Application 2019 & 2032
- Table 137: South Korea Biguanides Market Revenue (Million) Forecast, by Application 2019 & 2032
- Table 138: South Korea Biguanides Market Volume (K Unit) Forecast, by Application 2019 & 2032
- Table 139: Malaysia Biguanides Market Revenue (Million) Forecast, by Application 2019 & 2032
- Table 140: Malaysia Biguanides Market Volume (K Unit) Forecast, by Application 2019 & 2032
- Table 141: Indonesia Biguanides Market Revenue (Million) Forecast, by Application 2019 & 2032
- Table 142: Indonesia Biguanides Market Volume (K Unit) Forecast, by Application 2019 & 2032
- Table 143: Thailand Biguanides Market Revenue (Million) Forecast, by Application 2019 & 2032
- Table 144: Thailand Biguanides Market Volume (K Unit) Forecast, by Application 2019 & 2032
- Table 145: Philippines Biguanides Market Revenue (Million) Forecast, by Application 2019 & 2032
- Table 146: Philippines Biguanides Market Volume (K Unit) Forecast, by Application 2019 & 2032
- Table 147: Vietnam Biguanides Market Revenue (Million) Forecast, by Application 2019 & 2032
- Table 148: Vietnam Biguanides Market Volume (K Unit) Forecast, by Application 2019 & 2032
- Table 149: Rest of Asia Pacific Biguanides Market Revenue (Million) Forecast, by Application 2019 & 2032
- Table 150: Rest of Asia Pacific Biguanides Market Volume (K Unit) Forecast, by Application 2019 & 2032
- Table 151: Global Biguanides Market Revenue Million Forecast, by Product Type 2019 & 2032
- Table 152: Global Biguanides Market Volume K Unit Forecast, by Product Type 2019 & 2032
- Table 153: Global Biguanides Market Revenue Million Forecast, by Application 2019 & 2032
- Table 154: Global Biguanides Market Volume K Unit Forecast, by Application 2019 & 2032
- Table 155: Global Biguanides Market Revenue Million Forecast, by Country 2019 & 2032
- Table 156: Global Biguanides Market Volume K Unit Forecast, by Country 2019 & 2032
- Table 157: Brazil Biguanides Market Revenue (Million) Forecast, by Application 2019 & 2032
- Table 158: Brazil Biguanides Market Volume (K Unit) Forecast, by Application 2019 & 2032
- Table 159: Mexico Biguanides Market Revenue (Million) Forecast, by Application 2019 & 2032
- Table 160: Mexico Biguanides Market Volume (K Unit) Forecast, by Application 2019 & 2032
- Table 161: Rest of Latin America Biguanides Market Revenue (Million) Forecast, by Application 2019 & 2032
- Table 162: Rest of Latin America Biguanides Market Volume (K Unit) Forecast, by Application 2019 & 2032
- Table 163: Global Biguanides Market Revenue Million Forecast, by Product Type 2019 & 2032
- Table 164: Global Biguanides Market Volume K Unit Forecast, by Product Type 2019 & 2032
- Table 165: Global Biguanides Market Revenue Million Forecast, by Application 2019 & 2032
- Table 166: Global Biguanides Market Volume K Unit Forecast, by Application 2019 & 2032
- Table 167: Global Biguanides Market Revenue Million Forecast, by Country 2019 & 2032
- Table 168: Global Biguanides Market Volume K Unit Forecast, by Country 2019 & 2032
- Table 169: South Africa Biguanides Market Revenue (Million) Forecast, by Application 2019 & 2032
- Table 170: South Africa Biguanides Market Volume (K Unit) Forecast, by Application 2019 & 2032
- Table 171: Saudi Arabia Biguanides Market Revenue (Million) Forecast, by Application 2019 & 2032
- Table 172: Saudi Arabia Biguanides Market Volume (K Unit) Forecast, by Application 2019 & 2032
- Table 173: Oman Biguanides Market Revenue (Million) Forecast, by Application 2019 & 2032
- Table 174: Oman Biguanides Market Volume (K Unit) Forecast, by Application 2019 & 2032
- Table 175: Egypt Biguanides Market Revenue (Million) Forecast, by Application 2019 & 2032
- Table 176: Egypt Biguanides Market Volume (K Unit) Forecast, by Application 2019 & 2032
- Table 177: Iran Biguanides Market Revenue (Million) Forecast, by Application 2019 & 2032
- Table 178: Iran Biguanides Market Volume (K Unit) Forecast, by Application 2019 & 2032
- Table 179: Rest of Middle East and Africa Biguanides Market Revenue (Million) Forecast, by Application 2019 & 2032
- Table 180: Rest of Middle East and Africa Biguanides Market Volume (K Unit) Forecast, by Application 2019 & 2032
Frequently Asked Questions
1. What is the projected Compound Annual Growth Rate (CAGR) of the Biguanides Market?
The projected CAGR is approximately 2.07%.
2. Which companies are prominent players in the Biguanides Market?
Key companies in the market include Takeda, Other Market Share Analyse, Teva, Sanofi, Merck, Bristol-Myers Squibb, Glenmark, GlaxoSmithKline, Boehringer Ingelheim, Zydus.
3. What are the main segments of the Biguanides Market?
The market segments include Product Type , Application .
4. Can you provide details about the market size?
The market size is estimated to be USD 5.20 Million as of 2022.
5. What are some drivers contributing to market growth?
Growing Prevalence of Respiratory Diseases; Technological Advancements Owing to Telehealth and Remote Patient Monitoring; Improved Medication Adherence.
6. What are the notable trends driving market growth?
Rising diabetes prevalence globally.
7. Are there any restraints impacting market growth?
Availability of Traditional Inhalers as a Substitute; High Cost Associated with These Advanced Devices.
8. Can you provide examples of recent developments in the market?
February 2023: Zydus Lifesciences Limited received tentative approval from the USFDA for Invokamet tablets (canagliflozin and metformin hydrochloride combination). Canagliflozin and metformin combination products are indicated as an adjunct to diet and exercise to improve glycemic control in adults with type 2 diabetes mellitus who are not adequately controlled on a regimen containing metformin or canagliflozin or in patients already being treated with both canagliflozin and metformin.
9. What pricing options are available for accessing the report?
Pricing options include single-user, multi-user, and enterprise licenses priced at USD 4750, USD 5250, and USD 8750 respectively.
10. Is the market size provided in terms of value or volume?
The market size is provided in terms of value, measured in Million and volume, measured in K Unit.
11. Are there any specific market keywords associated with the report?
Yes, the market keyword associated with the report is "Biguanides Market," which aids in identifying and referencing the specific market segment covered.
12. How do I determine which pricing option suits my needs best?
The pricing options vary based on user requirements and access needs. Individual users may opt for single-user licenses, while businesses requiring broader access may choose multi-user or enterprise licenses for cost-effective access to the report.
13. Are there any additional resources or data provided in the Biguanides Market report?
While the report offers comprehensive insights, it's advisable to review the specific contents or supplementary materials provided to ascertain if additional resources or data are available.
14. How can I stay updated on further developments or reports in the Biguanides Market?
To stay informed about further developments, trends, and reports in the Biguanides Market, consider subscribing to industry newsletters, following relevant companies and organizations, or regularly checking reputable industry news sources and publications.
Methodology
Step 1 - Identification of Relevant Samples Size from Population Database


Step 2 - Approaches for Defining Global Market Size (Value, Volume* & Price*)

Note*: In applicable scenarios
Step 3 - Data Sources
Primary Research
- Web Analytics
- Survey Reports
- Research Institute
- Latest Research Reports
- Opinion Leaders
Secondary Research
- Annual Reports
- White Paper
- Latest Press Release
- Industry Association
- Paid Database
- Investor Presentations

Step 4 - Data Triangulation
Involves using different sources of information in order to increase the validity of a study
These sources are likely to be stakeholders in a program - participants, other researchers, program staff, other community members, and so on.
Then we put all data in single framework & apply various statistical tools to find out the dynamic on the market.
During the analysis stage, feedback from the stakeholder groups would be compared to determine areas of agreement as well as areas of divergence
