

Key Insights
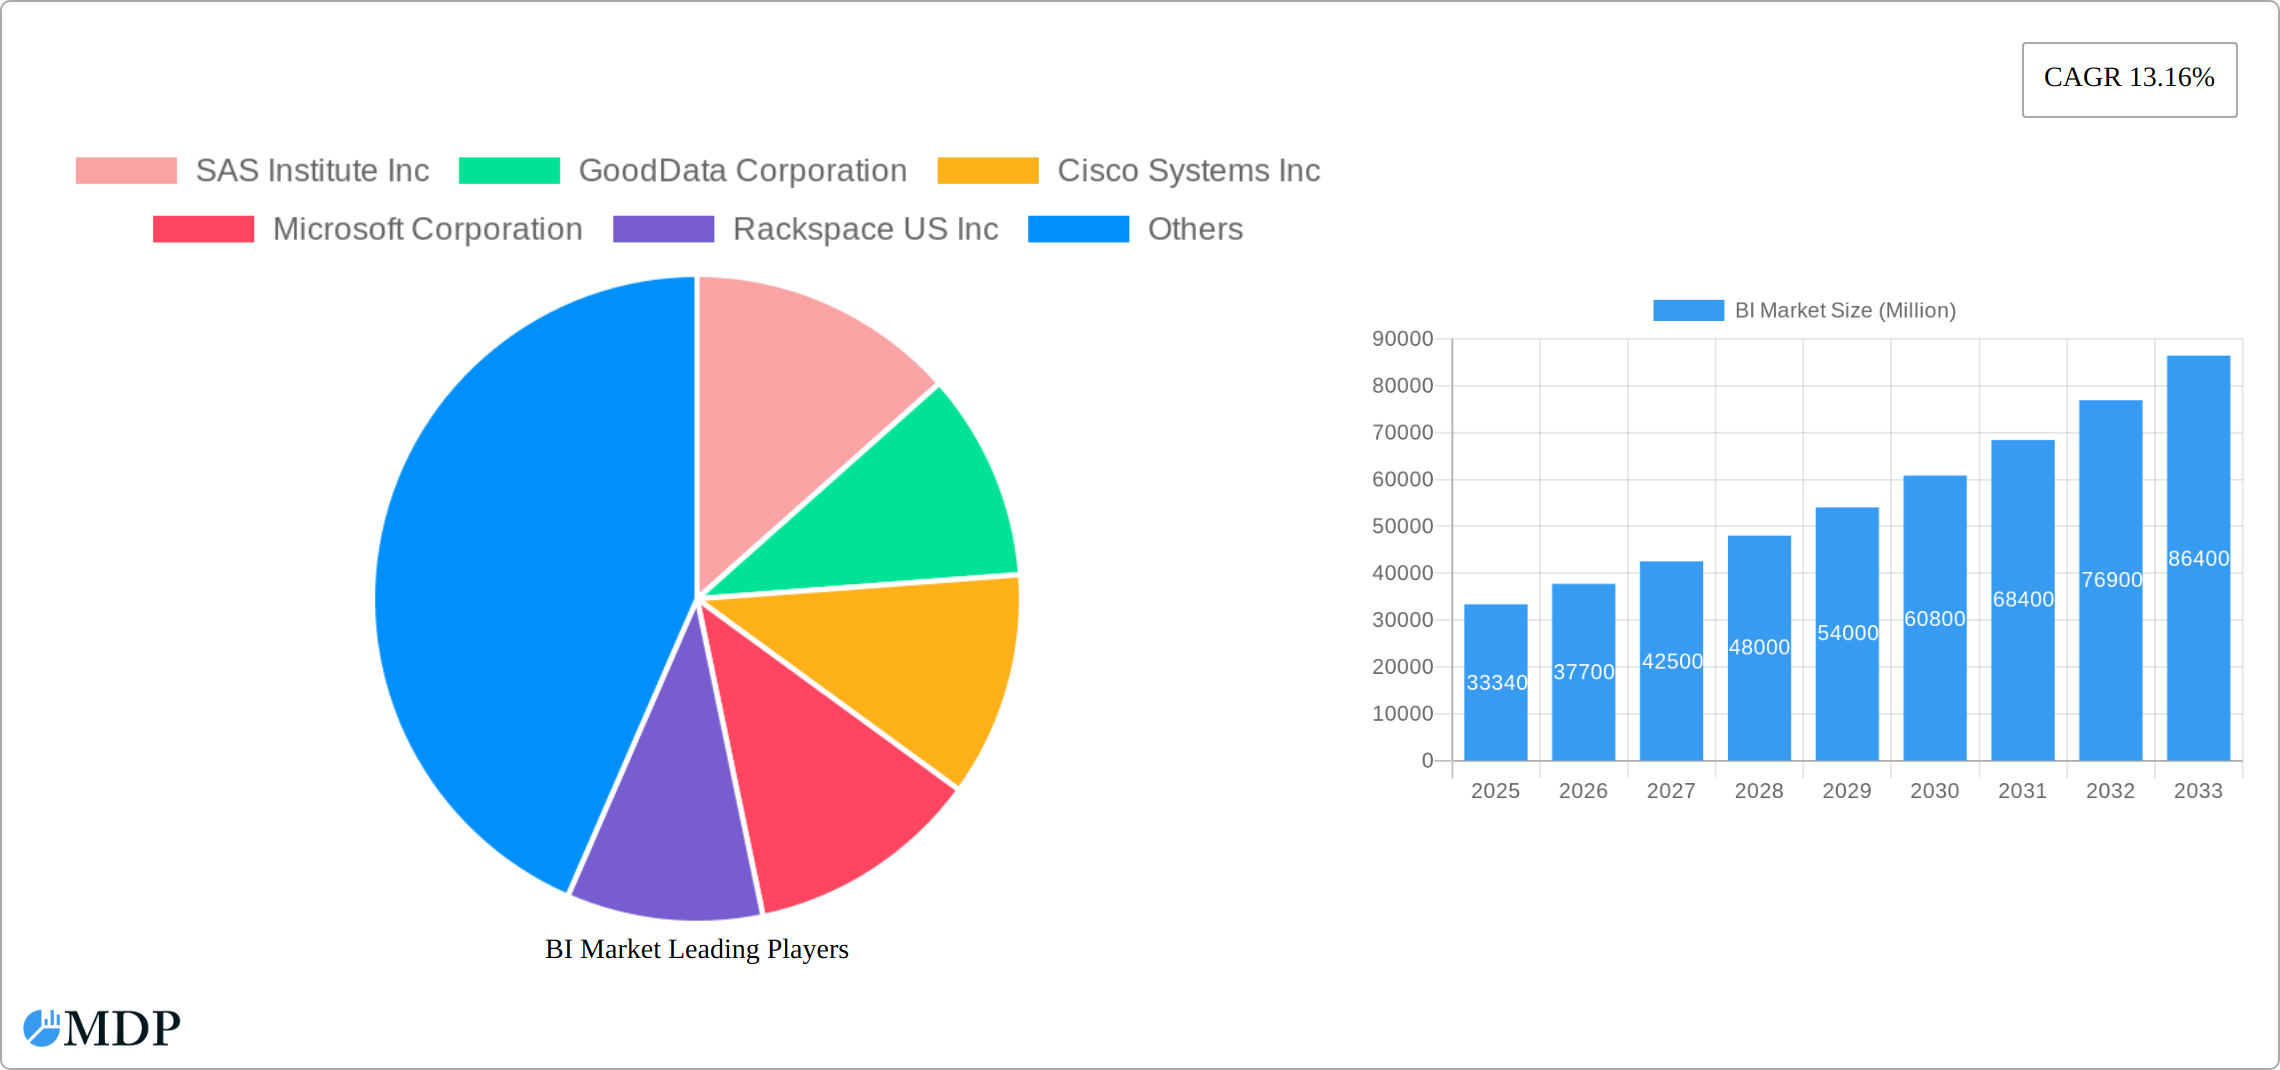
The Business Intelligence (BI) market is experiencing robust growth, projected to reach $33.34 billion in 2025 and maintain a Compound Annual Growth Rate (CAGR) of 13.16% from 2025 to 2033. This expansion is driven by several key factors. Firstly, the increasing volume and complexity of data generated across various industries necessitates sophisticated analytical tools for informed decision-making. Secondly, the shift towards cloud-based deployments offers scalability, cost-effectiveness, and accessibility, fueling market adoption. Furthermore, advancements in artificial intelligence (AI) and machine learning (ML) are integrating seamlessly with BI platforms, enhancing analytical capabilities and providing predictive insights. Finally, growing demand for real-time data analytics and data visualization across diverse sectors, including BFSI, IT & Telecommunications, Retail, and Healthcare, is significantly contributing to market growth.
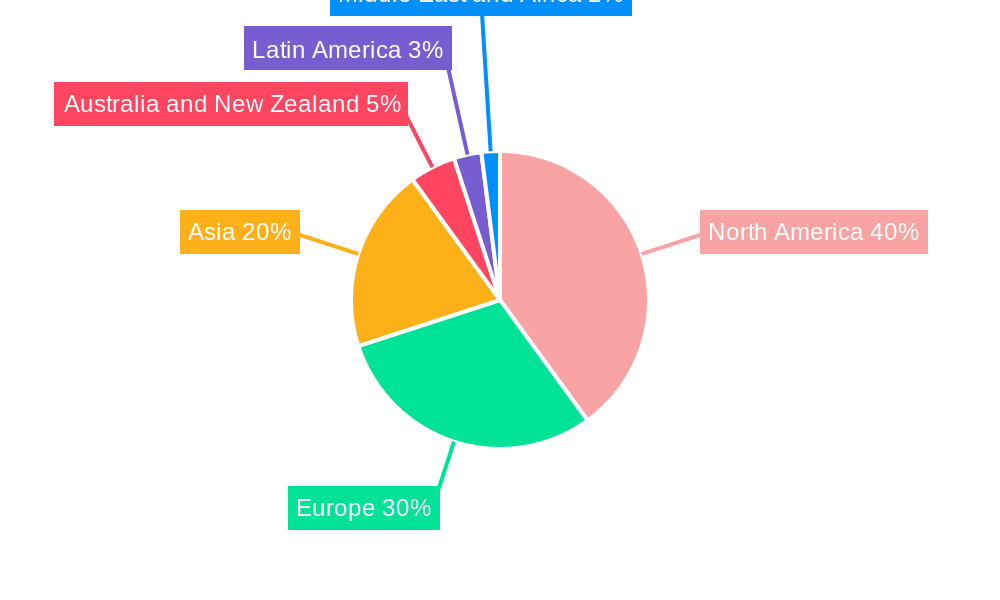
The market segmentation reveals a dynamic landscape. Software and platform solutions are likely to dominate the component segment, offering core functionalities and integration capabilities. Cloud deployment is expected to witness faster growth compared to on-premise solutions, reflecting the prevalent trend towards digital transformation and cloud adoption. North America and Europe are anticipated to hold significant market shares, driven by early adoption of BI technologies and established IT infrastructure. However, rapidly developing economies in Asia and the Middle East and Africa present substantial growth opportunities, fueled by increasing digitalization initiatives and government investments in data infrastructure. Leading vendors like SAS Institute, Microsoft, and Tableau (now Salesforce) are well-positioned to capitalize on this growth, competing through innovation and strategic partnerships. However, the market also faces challenges, including the complexities of data integration, the need for skilled professionals, and concerns around data security and privacy.
Unlocking Growth in the Multi-Billion Dollar BI Market: A Comprehensive Report (2019-2033)
This comprehensive report provides an in-depth analysis of the Business Intelligence (BI) market, projecting a robust expansion throughout the forecast period (2025-2033). We delve into market dynamics, key players, emerging trends, and future opportunities, equipping stakeholders with actionable insights to navigate this rapidly evolving landscape. The report covers a study period of 2019-2033, with a base year of 2025 and an estimated year of 2025. Valuations are provided in Millions.
BI Market Market Dynamics & Concentration
The BI market is characterized by a dynamic interplay of factors driving both growth and consolidation. Market concentration is moderate, with several key players holding significant market share, while numerous smaller niche players also contribute. Innovation is a primary growth driver, with continuous advancements in data analytics, cloud technologies, and artificial intelligence shaping product offerings. Regulatory frameworks, particularly those concerning data privacy (GDPR, CCPA), are influencing market practices and driving demand for compliant BI solutions. The market witnesses substantial M&A activity, indicating consolidation and expansion strategies among industry participants. Product substitution is relatively limited due to the specialized nature of BI solutions, though competitive pressures are significant. End-user trends show a growing preference for cloud-based solutions, driven by scalability and cost-effectiveness.
- Market Share: The top 5 players (SAS Institute Inc, Microsoft Corporation, Tableau Software Inc, Oracle Corporation, and SAP SE) collectively hold an estimated xx% market share in 2025.
- M&A Activity: The historical period (2019-2024) witnessed approximately xx M&A deals in the BI sector, indicating a strong level of consolidation.
- Innovation Drivers: Artificial Intelligence (AI), Machine Learning (ML), Big Data analytics, and cloud computing are key drivers of innovation.
- Regulatory Frameworks: Compliance with data privacy regulations (e.g., GDPR, CCPA) is driving the adoption of secure and compliant BI solutions.
BI Market Industry Trends & Analysis
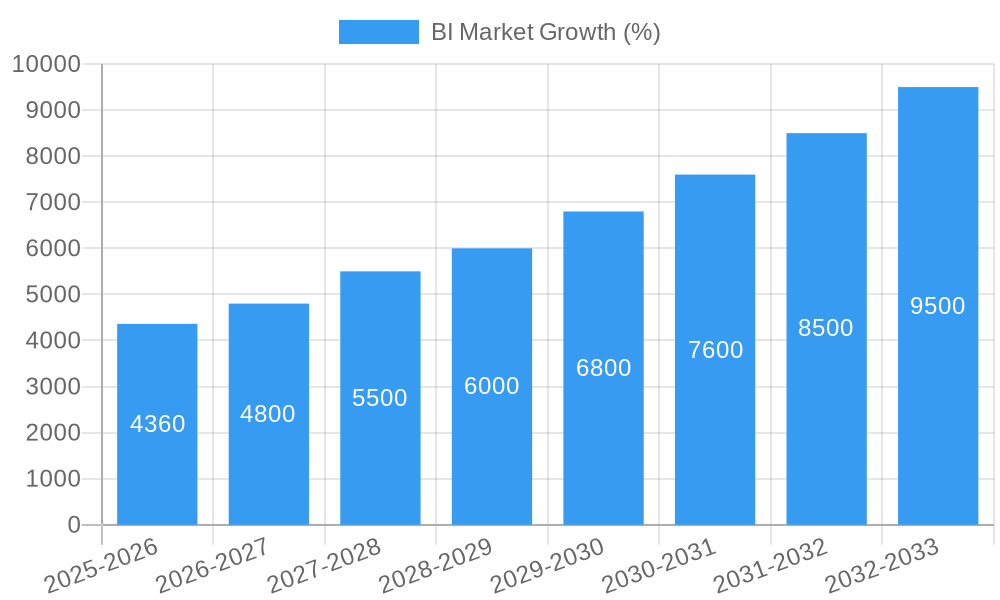
The BI market exhibits a strong growth trajectory, fueled by several key trends. The increasing volume and complexity of data across various industries are driving the demand for sophisticated BI tools. The shift toward cloud-based deployments offers scalability and cost advantages, propelling market expansion. Consumer preference is increasingly shifting towards user-friendly, self-service BI platforms. Competitive dynamics are characterized by innovation, strategic partnerships, and mergers and acquisitions, which are further driving market growth. The Compound Annual Growth Rate (CAGR) for the forecast period (2025-2033) is estimated at xx%, with market penetration expected to reach xx% by 2033. Technological disruptions, such as the rise of AI-powered analytics, are transforming the BI landscape, enabling more predictive and insightful analysis. The growing adoption of advanced analytics techniques like predictive modeling and prescriptive analytics is further accelerating market growth.
Leading Markets & Segments in BI Market
The global BI market is experiencing widespread growth, though certain regions, segments, and industries are demonstrating accelerated expansion.
Dominant Regions/Countries: North America currently holds a significant market share, driven by the presence of major technology companies and high adoption rates across various industries. However, the Asia-Pacific region is expected to experience the fastest growth during the forecast period.
Dominant Segments:
- By Component: The Software and Platform segment is expected to dominate, due to increasing demand for advanced analytics and self-service BI tools.
- By Deployment: The Cloud segment is experiencing rapid growth, due to its scalability, cost-effectiveness, and ease of access.
- By End-User Industry: The BFSI (Banking, Financial Services, and Insurance) sector is a significant adopter of BI solutions, followed by the IT and Telecommunication and Healthcare sectors.
Key Drivers:
- North America: Strong technology infrastructure, high adoption rates of advanced technologies, and the presence of major technology companies.
- Asia-Pacific: Rapid economic growth, increasing digitalization, and expanding adoption of cloud-based solutions.
- BFSI: Stringent regulatory compliance needs, the need for fraud detection and risk management, and the demand for customer insights.
- IT & Telecommunication: Need for network optimization, customer churn prediction, and improved service delivery.
BI Market Product Developments
Recent product developments highlight the focus on enhanced user experience, integration with AI/ML capabilities, and improved data visualization. Many vendors are incorporating advanced analytics features, such as predictive modeling and prescriptive analytics, into their platforms. The trend towards self-service BI, enabling business users to access and analyze data without needing extensive technical expertise, is also prominent. This is further driven by the need for real-time data analysis and mobile-friendly interfaces.
Key Drivers of BI Market Growth
The BI market's growth is primarily driven by several factors: the exponential growth in data volume and variety, the increasing demand for data-driven decision-making across all industries, the proliferation of cloud-based BI solutions, and advancements in AI and Machine Learning capabilities that enable more advanced analytics and insights. Government initiatives promoting data-driven governance and economic policies favoring digital transformation further fuel this growth.
Challenges in the BI Market Market
Significant challenges persist in the BI market. Data integration complexities across diverse systems can hinder effective analysis. The shortage of skilled data analysts and the high cost of implementation and maintenance of BI solutions can limit adoption, especially for small and medium-sized enterprises (SMEs). Competitive pressures from numerous vendors and the need to adapt to rapidly evolving technologies pose further challenges. The total estimated cost of these challenges across the forecast period is predicted to be approximately xx Million.
Emerging Opportunities in the BI Market
Emerging opportunities lie in the growing adoption of AI and ML in BI, the expansion of IoT-generated data analysis, and the increasing use of BI in niche sectors. Strategic partnerships between BI vendors and cloud providers will create new avenues for market expansion. The development of more sophisticated data visualization techniques and the integration of BI with other enterprise software solutions present significant opportunities for growth in the coming years.
Leading Players in the BI Market Sector
- SAS Institute Inc
- GoodData Corporation
- Cisco Systems Inc
- Microsoft Corporation
- Rackspace US Inc
- International Business Machines Corporation
- Tableau Software Inc (Salesforce)
- Oracle Corporation
- Targit AS
- VMware Inc
- SAP SE
Key Milestones in BI Market Industry
- May 2023: Rackspace US Inc announced Object Storage, a cost-effective solution for storing and utilizing large unstructured data sets, potentially saving organizations over 80% on storage costs compared to hyper-scale cloud options. This significantly impacts the cloud storage segment of the BI market.
- May 2023: GoodData Corporation released its Last Mile ETL feature, streamlining data management processes and improving data velocity for its customers. This enhances the efficiency and usability of their BI platform.
Strategic Outlook for BI Market Market
The future of the BI market holds immense potential, driven by technological advancements and growing demand for data-driven insights. The continued adoption of cloud-based solutions, the integration of AI and ML capabilities, and the expansion into new industries will shape the market's trajectory. Companies that successfully adapt to these trends and invest in innovation will be best positioned to capture significant market share in the years to come. Strategic partnerships, acquisitions, and a focus on delivering user-friendly and highly scalable solutions will be crucial for achieving long-term growth and success in this dynamic market.
BI Market Segmentation
-
1. Component
- 1.1. Software and Platform
- 1.2. Services
-
2. Deployment
- 2.1. On-Premise
- 2.2. Cloud
-
3. End-User Industry
- 3.1. BFSI
- 3.2. IT and Telecommunication
- 3.3. Retail
- 3.4. Healthcare
- 3.5. Other End-User Industries
BI Market Segmentation By Geography
- 1. North America
- 2. Europe
- 3. Asia
- 4. Australia and New Zealand
- 5. Latin America
- 6. Middle East and Africa
BI Market REPORT HIGHLIGHTS
| Aspects | Details |
|---|---|
| Study Period | 2019-2033 |
| Base Year | 2024 |
| Estimated Year | 2025 |
| Forecast Period | 2025-2033 |
| Historical Period | 2019-2024 |
| Growth Rate | CAGR of 13.16% from 2019-2033 |
| Segmentation |
|
Table of Contents
- 1. Introduction
- 1.1. Research Scope
- 1.2. Market Segmentation
- 1.3. Research Methodology
- 1.4. Definitions and Assumptions
- 2. Executive Summary
- 2.1. Introduction
- 3. Market Dynamics
- 3.1. Introduction
- 3.2. Market Drivers
- 3.2.1. Increasing Adoption of Data Analytics by Enterprises; Emergence of IoT-Enabled Technologies
- 3.3. Market Restrains
- 3.3.1. High Investment Costs for On-Premise Solutions; Lack of Skilled Professionals
- 3.4. Market Trends
- 3.4.1. BFSI Industry is Expected to Drive the Market Growth
- 4. Market Factor Analysis
- 4.1. Porters Five Forces
- 4.2. Supply/Value Chain
- 4.3. PESTEL analysis
- 4.4. Market Entropy
- 4.5. Patent/Trademark Analysis
- 5. Global BI Market Analysis, Insights and Forecast, 2019-2031
- 5.1. Market Analysis, Insights and Forecast - by Component
- 5.1.1. Software and Platform
- 5.1.2. Services
- 5.2. Market Analysis, Insights and Forecast - by Deployment
- 5.2.1. On-Premise
- 5.2.2. Cloud
- 5.3. Market Analysis, Insights and Forecast - by End-User Industry
- 5.3.1. BFSI
- 5.3.2. IT and Telecommunication
- 5.3.3. Retail
- 5.3.4. Healthcare
- 5.3.5. Other End-User Industries
- 5.4. Market Analysis, Insights and Forecast - by Region
- 5.4.1. North America
- 5.4.2. Europe
- 5.4.3. Asia
- 5.4.4. Australia and New Zealand
- 5.4.5. Latin America
- 5.4.6. Middle East and Africa
- 5.1. Market Analysis, Insights and Forecast - by Component
- 6. North America BI Market Analysis, Insights and Forecast, 2019-2031
- 6.1. Market Analysis, Insights and Forecast - by Component
- 6.1.1. Software and Platform
- 6.1.2. Services
- 6.2. Market Analysis, Insights and Forecast - by Deployment
- 6.2.1. On-Premise
- 6.2.2. Cloud
- 6.3. Market Analysis, Insights and Forecast - by End-User Industry
- 6.3.1. BFSI
- 6.3.2. IT and Telecommunication
- 6.3.3. Retail
- 6.3.4. Healthcare
- 6.3.5. Other End-User Industries
- 6.1. Market Analysis, Insights and Forecast - by Component
- 7. Europe BI Market Analysis, Insights and Forecast, 2019-2031
- 7.1. Market Analysis, Insights and Forecast - by Component
- 7.1.1. Software and Platform
- 7.1.2. Services
- 7.2. Market Analysis, Insights and Forecast - by Deployment
- 7.2.1. On-Premise
- 7.2.2. Cloud
- 7.3. Market Analysis, Insights and Forecast - by End-User Industry
- 7.3.1. BFSI
- 7.3.2. IT and Telecommunication
- 7.3.3. Retail
- 7.3.4. Healthcare
- 7.3.5. Other End-User Industries
- 7.1. Market Analysis, Insights and Forecast - by Component
- 8. Asia BI Market Analysis, Insights and Forecast, 2019-2031
- 8.1. Market Analysis, Insights and Forecast - by Component
- 8.1.1. Software and Platform
- 8.1.2. Services
- 8.2. Market Analysis, Insights and Forecast - by Deployment
- 8.2.1. On-Premise
- 8.2.2. Cloud
- 8.3. Market Analysis, Insights and Forecast - by End-User Industry
- 8.3.1. BFSI
- 8.3.2. IT and Telecommunication
- 8.3.3. Retail
- 8.3.4. Healthcare
- 8.3.5. Other End-User Industries
- 8.1. Market Analysis, Insights and Forecast - by Component
- 9. Australia and New Zealand BI Market Analysis, Insights and Forecast, 2019-2031
- 9.1. Market Analysis, Insights and Forecast - by Component
- 9.1.1. Software and Platform
- 9.1.2. Services
- 9.2. Market Analysis, Insights and Forecast - by Deployment
- 9.2.1. On-Premise
- 9.2.2. Cloud
- 9.3. Market Analysis, Insights and Forecast - by End-User Industry
- 9.3.1. BFSI
- 9.3.2. IT and Telecommunication
- 9.3.3. Retail
- 9.3.4. Healthcare
- 9.3.5. Other End-User Industries
- 9.1. Market Analysis, Insights and Forecast - by Component
- 10. Latin America BI Market Analysis, Insights and Forecast, 2019-2031
- 10.1. Market Analysis, Insights and Forecast - by Component
- 10.1.1. Software and Platform
- 10.1.2. Services
- 10.2. Market Analysis, Insights and Forecast - by Deployment
- 10.2.1. On-Premise
- 10.2.2. Cloud
- 10.3. Market Analysis, Insights and Forecast - by End-User Industry
- 10.3.1. BFSI
- 10.3.2. IT and Telecommunication
- 10.3.3. Retail
- 10.3.4. Healthcare
- 10.3.5. Other End-User Industries
- 10.1. Market Analysis, Insights and Forecast - by Component
- 11. Middle East and Africa BI Market Analysis, Insights and Forecast, 2019-2031
- 11.1. Market Analysis, Insights and Forecast - by Component
- 11.1.1. Software and Platform
- 11.1.2. Services
- 11.2. Market Analysis, Insights and Forecast - by Deployment
- 11.2.1. On-Premise
- 11.2.2. Cloud
- 11.3. Market Analysis, Insights and Forecast - by End-User Industry
- 11.3.1. BFSI
- 11.3.2. IT and Telecommunication
- 11.3.3. Retail
- 11.3.4. Healthcare
- 11.3.5. Other End-User Industries
- 11.1. Market Analysis, Insights and Forecast - by Component
- 12. North America BI Market Analysis, Insights and Forecast, 2019-2031
- 12.1. Market Analysis, Insights and Forecast - By Country/Sub-region
- 12.1.1.
- 13. Europe BI Market Analysis, Insights and Forecast, 2019-2031
- 13.1. Market Analysis, Insights and Forecast - By Country/Sub-region
- 13.1.1.
- 14. Asia BI Market Analysis, Insights and Forecast, 2019-2031
- 14.1. Market Analysis, Insights and Forecast - By Country/Sub-region
- 14.1.1.
- 15. Australia and New Zealand BI Market Analysis, Insights and Forecast, 2019-2031
- 15.1. Market Analysis, Insights and Forecast - By Country/Sub-region
- 15.1.1.
- 16. Latin America BI Market Analysis, Insights and Forecast, 2019-2031
- 16.1. Market Analysis, Insights and Forecast - By Country/Sub-region
- 16.1.1.
- 17. Middle East and Africa BI Market Analysis, Insights and Forecast, 2019-2031
- 17.1. Market Analysis, Insights and Forecast - By Country/Sub-region
- 17.1.1.
- 18. Competitive Analysis
- 18.1. Global Market Share Analysis 2024
- 18.2. Company Profiles
- 18.2.1 SAS Institute Inc
- 18.2.1.1. Overview
- 18.2.1.2. Products
- 18.2.1.3. SWOT Analysis
- 18.2.1.4. Recent Developments
- 18.2.1.5. Financials (Based on Availability)
- 18.2.2 GoodData Corporation
- 18.2.2.1. Overview
- 18.2.2.2. Products
- 18.2.2.3. SWOT Analysis
- 18.2.2.4. Recent Developments
- 18.2.2.5. Financials (Based on Availability)
- 18.2.3 Cisco Systems Inc
- 18.2.3.1. Overview
- 18.2.3.2. Products
- 18.2.3.3. SWOT Analysis
- 18.2.3.4. Recent Developments
- 18.2.3.5. Financials (Based on Availability)
- 18.2.4 Microsoft Corporation
- 18.2.4.1. Overview
- 18.2.4.2. Products
- 18.2.4.3. SWOT Analysis
- 18.2.4.4. Recent Developments
- 18.2.4.5. Financials (Based on Availability)
- 18.2.5 Rackspace US Inc
- 18.2.5.1. Overview
- 18.2.5.2. Products
- 18.2.5.3. SWOT Analysis
- 18.2.5.4. Recent Developments
- 18.2.5.5. Financials (Based on Availability)
- 18.2.6 International Business Machines Corporation
- 18.2.6.1. Overview
- 18.2.6.2. Products
- 18.2.6.3. SWOT Analysis
- 18.2.6.4. Recent Developments
- 18.2.6.5. Financials (Based on Availability)
- 18.2.7 Tableau Software Inc (Salesforce)*List Not Exhaustive
- 18.2.7.1. Overview
- 18.2.7.2. Products
- 18.2.7.3. SWOT Analysis
- 18.2.7.4. Recent Developments
- 18.2.7.5. Financials (Based on Availability)
- 18.2.8 Oracle Corporation
- 18.2.8.1. Overview
- 18.2.8.2. Products
- 18.2.8.3. SWOT Analysis
- 18.2.8.4. Recent Developments
- 18.2.8.5. Financials (Based on Availability)
- 18.2.9 Targit AS
- 18.2.9.1. Overview
- 18.2.9.2. Products
- 18.2.9.3. SWOT Analysis
- 18.2.9.4. Recent Developments
- 18.2.9.5. Financials (Based on Availability)
- 18.2.10 VMware Inc
- 18.2.10.1. Overview
- 18.2.10.2. Products
- 18.2.10.3. SWOT Analysis
- 18.2.10.4. Recent Developments
- 18.2.10.5. Financials (Based on Availability)
- 18.2.11 SAP SE
- 18.2.11.1. Overview
- 18.2.11.2. Products
- 18.2.11.3. SWOT Analysis
- 18.2.11.4. Recent Developments
- 18.2.11.5. Financials (Based on Availability)
- 18.2.1 SAS Institute Inc
List of Figures
- Figure 1: Global BI Market Revenue Breakdown (Million, %) by Region 2024 & 2032
- Figure 2: North America BI Market Revenue (Million), by Country 2024 & 2032
- Figure 3: North America BI Market Revenue Share (%), by Country 2024 & 2032
- Figure 4: Europe BI Market Revenue (Million), by Country 2024 & 2032
- Figure 5: Europe BI Market Revenue Share (%), by Country 2024 & 2032
- Figure 6: Asia BI Market Revenue (Million), by Country 2024 & 2032
- Figure 7: Asia BI Market Revenue Share (%), by Country 2024 & 2032
- Figure 8: Australia and New Zealand BI Market Revenue (Million), by Country 2024 & 2032
- Figure 9: Australia and New Zealand BI Market Revenue Share (%), by Country 2024 & 2032
- Figure 10: Latin America BI Market Revenue (Million), by Country 2024 & 2032
- Figure 11: Latin America BI Market Revenue Share (%), by Country 2024 & 2032
- Figure 12: Middle East and Africa BI Market Revenue (Million), by Country 2024 & 2032
- Figure 13: Middle East and Africa BI Market Revenue Share (%), by Country 2024 & 2032
- Figure 14: North America BI Market Revenue (Million), by Component 2024 & 2032
- Figure 15: North America BI Market Revenue Share (%), by Component 2024 & 2032
- Figure 16: North America BI Market Revenue (Million), by Deployment 2024 & 2032
- Figure 17: North America BI Market Revenue Share (%), by Deployment 2024 & 2032
- Figure 18: North America BI Market Revenue (Million), by End-User Industry 2024 & 2032
- Figure 19: North America BI Market Revenue Share (%), by End-User Industry 2024 & 2032
- Figure 20: North America BI Market Revenue (Million), by Country 2024 & 2032
- Figure 21: North America BI Market Revenue Share (%), by Country 2024 & 2032
- Figure 22: Europe BI Market Revenue (Million), by Component 2024 & 2032
- Figure 23: Europe BI Market Revenue Share (%), by Component 2024 & 2032
- Figure 24: Europe BI Market Revenue (Million), by Deployment 2024 & 2032
- Figure 25: Europe BI Market Revenue Share (%), by Deployment 2024 & 2032
- Figure 26: Europe BI Market Revenue (Million), by End-User Industry 2024 & 2032
- Figure 27: Europe BI Market Revenue Share (%), by End-User Industry 2024 & 2032
- Figure 28: Europe BI Market Revenue (Million), by Country 2024 & 2032
- Figure 29: Europe BI Market Revenue Share (%), by Country 2024 & 2032
- Figure 30: Asia BI Market Revenue (Million), by Component 2024 & 2032
- Figure 31: Asia BI Market Revenue Share (%), by Component 2024 & 2032
- Figure 32: Asia BI Market Revenue (Million), by Deployment 2024 & 2032
- Figure 33: Asia BI Market Revenue Share (%), by Deployment 2024 & 2032
- Figure 34: Asia BI Market Revenue (Million), by End-User Industry 2024 & 2032
- Figure 35: Asia BI Market Revenue Share (%), by End-User Industry 2024 & 2032
- Figure 36: Asia BI Market Revenue (Million), by Country 2024 & 2032
- Figure 37: Asia BI Market Revenue Share (%), by Country 2024 & 2032
- Figure 38: Australia and New Zealand BI Market Revenue (Million), by Component 2024 & 2032
- Figure 39: Australia and New Zealand BI Market Revenue Share (%), by Component 2024 & 2032
- Figure 40: Australia and New Zealand BI Market Revenue (Million), by Deployment 2024 & 2032
- Figure 41: Australia and New Zealand BI Market Revenue Share (%), by Deployment 2024 & 2032
- Figure 42: Australia and New Zealand BI Market Revenue (Million), by End-User Industry 2024 & 2032
- Figure 43: Australia and New Zealand BI Market Revenue Share (%), by End-User Industry 2024 & 2032
- Figure 44: Australia and New Zealand BI Market Revenue (Million), by Country 2024 & 2032
- Figure 45: Australia and New Zealand BI Market Revenue Share (%), by Country 2024 & 2032
- Figure 46: Latin America BI Market Revenue (Million), by Component 2024 & 2032
- Figure 47: Latin America BI Market Revenue Share (%), by Component 2024 & 2032
- Figure 48: Latin America BI Market Revenue (Million), by Deployment 2024 & 2032
- Figure 49: Latin America BI Market Revenue Share (%), by Deployment 2024 & 2032
- Figure 50: Latin America BI Market Revenue (Million), by End-User Industry 2024 & 2032
- Figure 51: Latin America BI Market Revenue Share (%), by End-User Industry 2024 & 2032
- Figure 52: Latin America BI Market Revenue (Million), by Country 2024 & 2032
- Figure 53: Latin America BI Market Revenue Share (%), by Country 2024 & 2032
- Figure 54: Middle East and Africa BI Market Revenue (Million), by Component 2024 & 2032
- Figure 55: Middle East and Africa BI Market Revenue Share (%), by Component 2024 & 2032
- Figure 56: Middle East and Africa BI Market Revenue (Million), by Deployment 2024 & 2032
- Figure 57: Middle East and Africa BI Market Revenue Share (%), by Deployment 2024 & 2032
- Figure 58: Middle East and Africa BI Market Revenue (Million), by End-User Industry 2024 & 2032
- Figure 59: Middle East and Africa BI Market Revenue Share (%), by End-User Industry 2024 & 2032
- Figure 60: Middle East and Africa BI Market Revenue (Million), by Country 2024 & 2032
- Figure 61: Middle East and Africa BI Market Revenue Share (%), by Country 2024 & 2032
List of Tables
- Table 1: Global BI Market Revenue Million Forecast, by Region 2019 & 2032
- Table 2: Global BI Market Revenue Million Forecast, by Component 2019 & 2032
- Table 3: Global BI Market Revenue Million Forecast, by Deployment 2019 & 2032
- Table 4: Global BI Market Revenue Million Forecast, by End-User Industry 2019 & 2032
- Table 5: Global BI Market Revenue Million Forecast, by Region 2019 & 2032
- Table 6: Global BI Market Revenue Million Forecast, by Country 2019 & 2032
- Table 7: BI Market Revenue (Million) Forecast, by Application 2019 & 2032
- Table 8: Global BI Market Revenue Million Forecast, by Country 2019 & 2032
- Table 9: BI Market Revenue (Million) Forecast, by Application 2019 & 2032
- Table 10: Global BI Market Revenue Million Forecast, by Country 2019 & 2032
- Table 11: BI Market Revenue (Million) Forecast, by Application 2019 & 2032
- Table 12: Global BI Market Revenue Million Forecast, by Country 2019 & 2032
- Table 13: BI Market Revenue (Million) Forecast, by Application 2019 & 2032
- Table 14: Global BI Market Revenue Million Forecast, by Country 2019 & 2032
- Table 15: BI Market Revenue (Million) Forecast, by Application 2019 & 2032
- Table 16: Global BI Market Revenue Million Forecast, by Country 2019 & 2032
- Table 17: BI Market Revenue (Million) Forecast, by Application 2019 & 2032
- Table 18: Global BI Market Revenue Million Forecast, by Component 2019 & 2032
- Table 19: Global BI Market Revenue Million Forecast, by Deployment 2019 & 2032
- Table 20: Global BI Market Revenue Million Forecast, by End-User Industry 2019 & 2032
- Table 21: Global BI Market Revenue Million Forecast, by Country 2019 & 2032
- Table 22: Global BI Market Revenue Million Forecast, by Component 2019 & 2032
- Table 23: Global BI Market Revenue Million Forecast, by Deployment 2019 & 2032
- Table 24: Global BI Market Revenue Million Forecast, by End-User Industry 2019 & 2032
- Table 25: Global BI Market Revenue Million Forecast, by Country 2019 & 2032
- Table 26: Global BI Market Revenue Million Forecast, by Component 2019 & 2032
- Table 27: Global BI Market Revenue Million Forecast, by Deployment 2019 & 2032
- Table 28: Global BI Market Revenue Million Forecast, by End-User Industry 2019 & 2032
- Table 29: Global BI Market Revenue Million Forecast, by Country 2019 & 2032
- Table 30: Global BI Market Revenue Million Forecast, by Component 2019 & 2032
- Table 31: Global BI Market Revenue Million Forecast, by Deployment 2019 & 2032
- Table 32: Global BI Market Revenue Million Forecast, by End-User Industry 2019 & 2032
- Table 33: Global BI Market Revenue Million Forecast, by Country 2019 & 2032
- Table 34: Global BI Market Revenue Million Forecast, by Component 2019 & 2032
- Table 35: Global BI Market Revenue Million Forecast, by Deployment 2019 & 2032
- Table 36: Global BI Market Revenue Million Forecast, by End-User Industry 2019 & 2032
- Table 37: Global BI Market Revenue Million Forecast, by Country 2019 & 2032
- Table 38: Global BI Market Revenue Million Forecast, by Component 2019 & 2032
- Table 39: Global BI Market Revenue Million Forecast, by Deployment 2019 & 2032
- Table 40: Global BI Market Revenue Million Forecast, by End-User Industry 2019 & 2032
- Table 41: Global BI Market Revenue Million Forecast, by Country 2019 & 2032
Frequently Asked Questions
1. What is the projected Compound Annual Growth Rate (CAGR) of the BI Market?
The projected CAGR is approximately 13.16%.
2. Which companies are prominent players in the BI Market?
Key companies in the market include SAS Institute Inc, GoodData Corporation, Cisco Systems Inc, Microsoft Corporation, Rackspace US Inc, International Business Machines Corporation, Tableau Software Inc (Salesforce)*List Not Exhaustive, Oracle Corporation, Targit AS, VMware Inc, SAP SE.
3. What are the main segments of the BI Market?
The market segments include Component, Deployment, End-User Industry.
4. Can you provide details about the market size?
The market size is estimated to be USD 33.34 Million as of 2022.
5. What are some drivers contributing to market growth?
Increasing Adoption of Data Analytics by Enterprises; Emergence of IoT-Enabled Technologies.
6. What are the notable trends driving market growth?
BFSI Industry is Expected to Drive the Market Growth.
7. Are there any restraints impacting market growth?
High Investment Costs for On-Premise Solutions; Lack of Skilled Professionals.
8. Can you provide examples of recent developments in the market?
May 2023: Rackspace US Inc announced Object Storage which enables organizations securely store and utilize large pools of unstructured data, where Rackspace Object Storage saves substantial costs by eliminating data egress, retrieval, and transaction charges. In many cases, the Rackspace Object Storage solution can save more than 80% over hyper-scale cloud storage options. For multi-cloud customers operating modern S3-enabled applications, this is a new paradigm that facilitates better performance and lower costs, even as data-intensive applications continue to drive up the need for storage,
9. What pricing options are available for accessing the report?
Pricing options include single-user, multi-user, and enterprise licenses priced at USD 4750, USD 5250, and USD 8750 respectively.
10. Is the market size provided in terms of value or volume?
The market size is provided in terms of value, measured in Million.
11. Are there any specific market keywords associated with the report?
Yes, the market keyword associated with the report is "BI Market," which aids in identifying and referencing the specific market segment covered.
12. How do I determine which pricing option suits my needs best?
The pricing options vary based on user requirements and access needs. Individual users may opt for single-user licenses, while businesses requiring broader access may choose multi-user or enterprise licenses for cost-effective access to the report.
13. Are there any additional resources or data provided in the BI Market report?
While the report offers comprehensive insights, it's advisable to review the specific contents or supplementary materials provided to ascertain if additional resources or data are available.
14. How can I stay updated on further developments or reports in the BI Market?
To stay informed about further developments, trends, and reports in the BI Market, consider subscribing to industry newsletters, following relevant companies and organizations, or regularly checking reputable industry news sources and publications.
Methodology
Step 1 - Identification of Relevant Samples Size from Population Database


Step 2 - Approaches for Defining Global Market Size (Value, Volume* & Price*)

Note*: In applicable scenarios
Step 3 - Data Sources
Primary Research
- Web Analytics
- Survey Reports
- Research Institute
- Latest Research Reports
- Opinion Leaders
Secondary Research
- Annual Reports
- White Paper
- Latest Press Release
- Industry Association
- Paid Database
- Investor Presentations

Step 4 - Data Triangulation
Involves using different sources of information in order to increase the validity of a study
These sources are likely to be stakeholders in a program - participants, other researchers, program staff, other community members, and so on.
Then we put all data in single framework & apply various statistical tools to find out the dynamic on the market.
During the analysis stage, feedback from the stakeholder groups would be compared to determine areas of agreement as well as areas of divergence
