

Key Insights
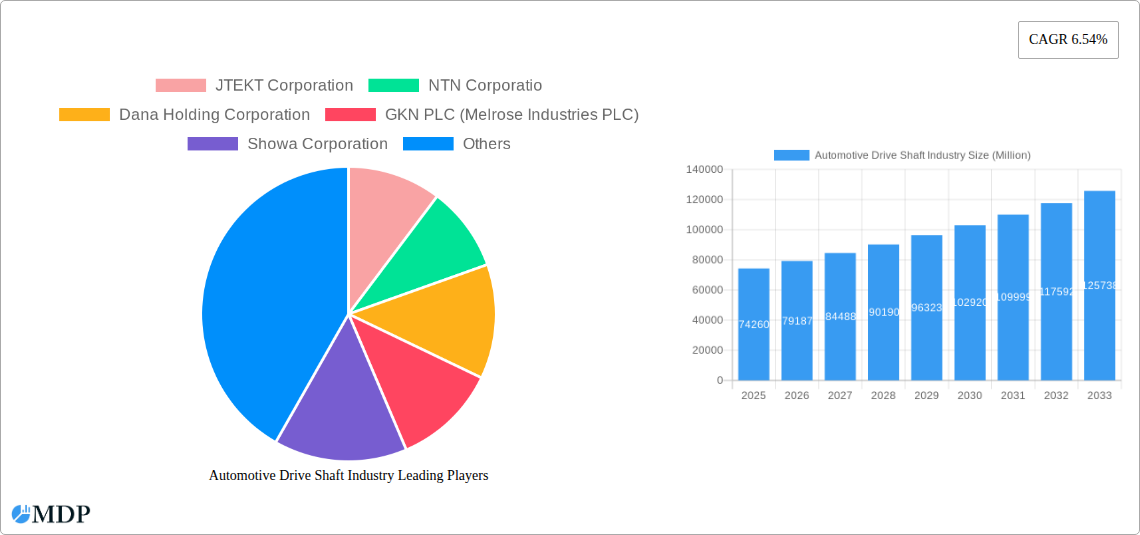
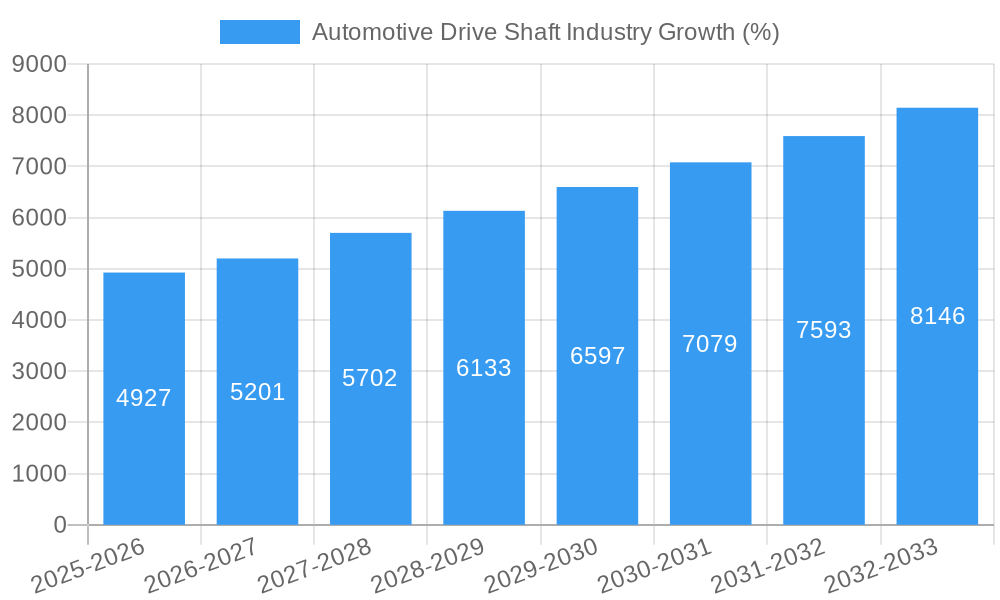
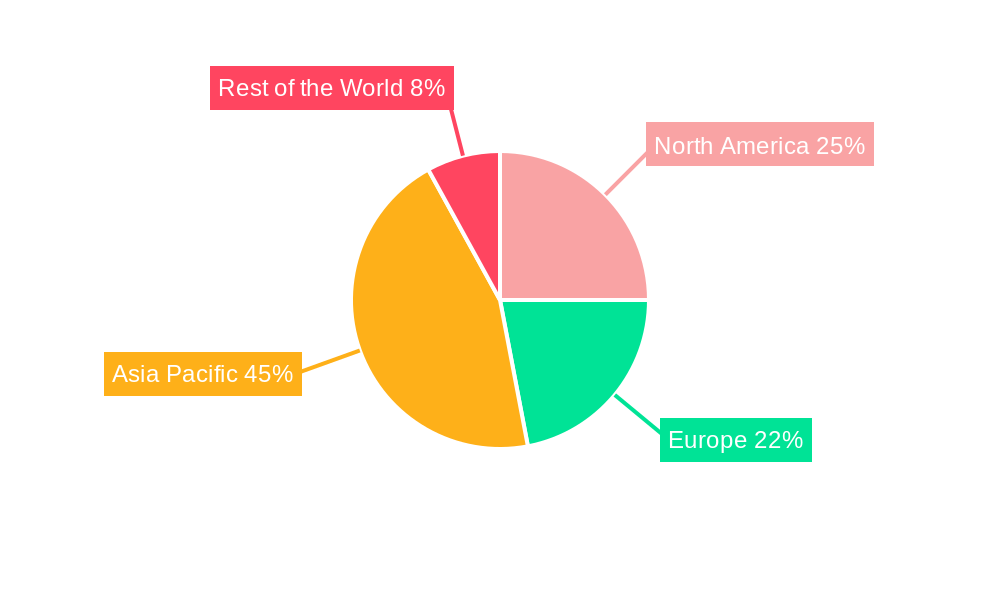
The global automotive drive shaft market, valued at $74.26 billion in 2025, is projected to experience robust growth, driven by the increasing demand for passenger and commercial vehicles globally. A compound annual growth rate (CAGR) of 6.54% from 2025 to 2033 indicates a significant expansion in market size. Several factors contribute to this growth, including the rising adoption of advanced driver-assistance systems (ADAS) and electric vehicles (EVs), both of which require sophisticated drive shaft technologies. The shift towards lightweighting in automotive design to improve fuel efficiency further fuels demand for advanced materials and designs within drive shafts. The market is segmented by design type (hollow shaft, solid shaft), position type (rear axle, front axle), vehicle type (passenger cars, commercial vehicles), and sales channel (OEM, aftermarket). The Asia-Pacific region, particularly China and India, is expected to be a key growth driver due to expanding automotive manufacturing and increasing vehicle ownership. However, factors like fluctuating raw material prices and stringent emission regulations pose challenges to market growth. Competition among major players like JTEKT, NTN, Dana Holding, GKN, Showa, and others is intense, driving innovation and the development of more efficient and durable drive shaft systems. The aftermarket segment is anticipated to experience steady growth due to the increasing age of vehicles on the road and the associated need for replacements and repairs. The continued development of hybrid and electric vehicles, particularly in developed markets like North America and Europe, will open up new opportunities for specialized drive shaft technologies designed for these powertrains.
The forecast period (2025-2033) anticipates significant growth, particularly in emerging economies. Technological advancements in materials science are likely to lead to lighter, stronger, and more fuel-efficient drive shafts. The increasing integration of advanced electronics and sensors within drive shaft systems to enhance performance and safety features will contribute to market expansion. Competitive strategies including mergers, acquisitions, and partnerships are anticipated amongst key market players to improve market share and expand product portfolios. Furthermore, the growing focus on sustainable manufacturing practices and the incorporation of recycled materials within drive shafts will shape the industry's future trajectory. Government regulations aimed at improving vehicle safety and fuel economy will continue to influence the demand for advanced drive shaft technologies.
Automotive Drive Shaft Industry Market Report: 2019-2033
This comprehensive report provides an in-depth analysis of the global automotive drive shaft industry, offering valuable insights for stakeholders, investors, and industry professionals. The report covers market dynamics, leading players, technological advancements, and future growth opportunities, focusing on the period 2019-2033, with a base year of 2025. The estimated market size for 2025 is xx Million USD, projected to reach xx Million USD by 2033.
Automotive Drive Shaft Industry Market Dynamics & Concentration
The automotive drive shaft market is characterized by a moderately concentrated landscape, with key players holding significant market share. The industry's dynamics are shaped by several factors, including technological innovations, stringent regulatory frameworks, the emergence of product substitutes (like electric axles in EVs), evolving end-user preferences (e.g., preference for fuel efficiency and reduced emissions), and ongoing mergers and acquisitions (M&A) activities.
- Market Concentration: The top 10 players account for an estimated xx% of the global market share in 2025. This concentration is expected to remain relatively stable throughout the forecast period, although smaller players are expected to challenge the incumbents with specialized products and regional focus.
- Innovation Drivers: The drive towards improved fuel efficiency, reduced emissions, and enhanced vehicle performance are major drivers of innovation. This includes the development of lightweight materials, advanced designs (like low-vibration shafts), and improved manufacturing processes.
- Regulatory Frameworks: Government regulations concerning fuel economy and emissions standards significantly impact the demand for high-efficiency drive shafts. Stringent safety standards also play a role in shaping design and material choices.
- Product Substitutes: The growing adoption of electric vehicles (EVs) introduces potential substitutes for traditional drive shafts, particularly eAxles. However, many hybrid and traditional vehicles will continue to use drive shafts in the forecast period.
- End-User Trends: The increasing demand for SUVs and light trucks, along with the global preference for passenger vehicles, is driving growth in the drive shaft market. Consumers are increasingly focused on fuel economy and vehicle durability, influencing product development and marketing strategies.
- M&A Activities: The automotive industry has witnessed a significant number of M&A activities in recent years (xx deals between 2019-2024). These activities aim to consolidate market share, expand product portfolios, and enhance technological capabilities.
Automotive Drive Shaft Industry Industry Trends & Analysis
The automotive drive shaft market exhibits a robust growth trajectory, driven by several key factors. The Compound Annual Growth Rate (CAGR) for the period 2025-2033 is projected to be xx%. This growth is fueled by factors such as increasing vehicle production, particularly in developing economies, and the rising demand for advanced driver-assistance systems (ADAS) which depend on complex drive shaft systems. Technological disruptions are evident with the introduction of lightweight materials and innovative designs aiming for improved efficiency and performance. Consumer preferences for enhanced fuel economy and reduced emissions are shaping market trends and driving innovation. The competitive landscape is characterized by intense competition among established players, with a focus on product differentiation, technological advancements, and cost optimization. Market penetration is steadily increasing across various vehicle segments, with particularly strong growth seen in the SUV and light truck sectors.
Leading Markets & Segments in Automotive Drive Shaft Industry
The Asia Pacific region is anticipated to dominate the automotive drive shaft market throughout the forecast period. This dominance stems from the high growth rate of the automotive sector in the region, particularly in countries like China and India. Within the segments, passenger car applications account for the largest share of the market, followed by commercial vehicles.
- By Design Type: Hollow shafts currently hold a larger market share than solid shafts, owing to their lightweight nature and improved efficiency. However, solid shafts are expected to see growth due to their better durability.
- By Position Type: Rear axle drive shafts currently hold a larger market share, yet front axle applications are expected to experience growth.
- By Vehicle Type: Passenger cars constitute the largest segment, driven by high vehicle production volumes globally.
- By Sales Channel: The OEM (Original Equipment Manufacturer) channel dominates the sales, though the aftermarket segment offers significant opportunities for growth.
Key Drivers:
- Asia Pacific: Strong automotive production growth, government policies promoting vehicle manufacturing, expanding infrastructure.
- Passenger Cars: High vehicle production volumes globally, increasing consumer demand.
- OEM Channel: Direct relationships with vehicle manufacturers, large order volumes.
Automotive Drive Shaft Industry Product Developments
Recent product developments in the automotive drive shaft industry focus on lightweighting, improved durability, and reduced friction. The implementation of advanced materials, like carbon fiber reinforced polymers (CFRPs), and innovative designs like JTEKT's low-vibration drive shaft, are aimed at enhancing fuel efficiency and vehicle performance. These innovations are tailored to meet the evolving demands of the automotive industry, focusing on improving performance, cost-effectiveness, and compliance with regulatory norms.
Key Drivers of Automotive Drive Shaft Industry Growth
The automotive drive shaft market's growth is driven by several factors:
- Technological advancements: The development of lightweight materials, advanced designs, and improved manufacturing processes enhance fuel efficiency, reduce emissions, and improve performance.
- Economic growth: Rising disposable incomes and increased vehicle ownership, especially in developing economies, fuel market expansion.
- Government regulations: Stringent fuel efficiency and emission standards mandate the use of advanced drive shaft technologies.
Challenges in the Automotive Drive Shaft Industry Market
The industry faces several challenges:
- Raw material costs: Fluctuations in the price of steel and other raw materials impact production costs and profitability. A xx% increase in steel prices in 2022 resulted in a xx Million USD increase in production costs for the industry.
- Supply chain disruptions: Global supply chain uncertainties can lead to delays and shortages of raw materials, impacting production capacity.
- Intense competition: The market is characterized by intense competition among established and emerging players.
Emerging Opportunities in Automotive Drive Shaft Industry
The automotive drive shaft industry is poised for growth driven by several emerging opportunities:
The growing adoption of electric and hybrid vehicles presents opportunities for developing specialized drive shafts for these applications. Strategic partnerships and collaborations between automotive manufacturers and drive shaft suppliers are expected to foster innovation and market expansion. Expanding into new markets, particularly in developing economies with high automotive growth potential, presents further growth avenues.
Leading Players in the Automotive Drive Shaft Industry Sector
- JTEKT Corporation
- NTN Corporation
- Dana Holding Corporation
- GKN PLC (Melrose Industries PLC)
- Showa Corporation
- Wanxiang Qianchao Co Ltd
- American Axle & Manufacturing Co Ltd
- Hyundai Wia Corporation
- Nexteer Automotive Group Ltd
- Yamada Manufacturing Co Ltd
Key Milestones in Automotive Drive Shaft Industry Industry
- January 2023: Dana Cardenas opened a new USD 21 million plant in Querétaro, Mexico, boosting production capacity for Toyota components by 545,000 units annually.
- December 2022: JTEKT Corporation launched a "low-vibration drive shaft" for Lexus RX, improving fuel economy and reducing vibrations.
- October 2022: JTEKT and Koyo sealing techno developed a compact oil seal for BEV eAxles, addressing the growth of the electric vehicle market.
Strategic Outlook for Automotive Drive Shaft Industry Market
The automotive drive shaft market presents significant long-term growth potential, driven by technological advancements, increasing vehicle production, and the expanding adoption of electric and hybrid vehicles. Strategic partnerships and investments in research and development will be crucial for players to maintain a competitive edge and capitalize on emerging opportunities. The focus will shift towards lightweight, efficient, and cost-effective drive shaft solutions to cater to the evolving needs of the automotive industry.
Automotive Drive Shaft Industry Segmentation
-
1. Design Type
- 1.1. Hollow Shaft
- 1.2. Solid Shaft
-
2. Position Type
- 2.1. Rear Axle
- 2.2. Front Axle
-
3. Vehicle Type
- 3.1. Passenger Cars
- 3.2. Commercial Vehicles
-
4. Sales Channel
- 4.1. OEM
- 4.2. Aftermarket
Automotive Drive Shaft Industry Segmentation By Geography
-
1. North America
- 1.1. United States
- 1.2. Canada
- 1.3. Rest of North America
-
2. Europe
- 2.1. Germany
- 2.2. United Kingdom
- 2.3. France
- 2.4. Rest of Europe
-
3. Asia Pacific
- 3.1. India
- 3.2. China
- 3.3. Japan
- 3.4. South Korea
- 3.5. Rest of Asia Pacific
-
4. Rest of the World
- 4.1. South America
- 4.2. Middle East and Africa
Automotive Drive Shaft Industry REPORT HIGHLIGHTS
| Aspects | Details |
|---|---|
| Study Period | 2019-2033 |
| Base Year | 2024 |
| Estimated Year | 2025 |
| Forecast Period | 2025-2033 |
| Historical Period | 2019-2024 |
| Growth Rate | CAGR of 6.54% from 2019-2033 |
| Segmentation |
|
Table of Contents
- 1. Introduction
- 1.1. Research Scope
- 1.2. Market Segmentation
- 1.3. Research Methodology
- 1.4. Definitions and Assumptions
- 2. Executive Summary
- 2.1. Introduction
- 3. Market Dynamics
- 3.1. Introduction
- 3.2. Market Drivers
- 3.2.1. Automotive Industry Continues to Witness Steady Growth in Vehicle Production; Growing Awareness of Air Pollution and Health Concerns
- 3.3. Market Restrains
- 3.3.1. Shift towards Disposable Filters
- 3.4. Market Trends
- 3.4.1. Increasing Demand for Electric Vehicles to Drive Growth of the Market
- 4. Market Factor Analysis
- 4.1. Porters Five Forces
- 4.2. Supply/Value Chain
- 4.3. PESTEL analysis
- 4.4. Market Entropy
- 4.5. Patent/Trademark Analysis
- 5. Global Automotive Drive Shaft Industry Analysis, Insights and Forecast, 2019-2031
- 5.1. Market Analysis, Insights and Forecast - by Design Type
- 5.1.1. Hollow Shaft
- 5.1.2. Solid Shaft
- 5.2. Market Analysis, Insights and Forecast - by Position Type
- 5.2.1. Rear Axle
- 5.2.2. Front Axle
- 5.3. Market Analysis, Insights and Forecast - by Vehicle Type
- 5.3.1. Passenger Cars
- 5.3.2. Commercial Vehicles
- 5.4. Market Analysis, Insights and Forecast - by Sales Channel
- 5.4.1. OEM
- 5.4.2. Aftermarket
- 5.5. Market Analysis, Insights and Forecast - by Region
- 5.5.1. North America
- 5.5.2. Europe
- 5.5.3. Asia Pacific
- 5.5.4. Rest of the World
- 5.1. Market Analysis, Insights and Forecast - by Design Type
- 6. North America Automotive Drive Shaft Industry Analysis, Insights and Forecast, 2019-2031
- 6.1. Market Analysis, Insights and Forecast - by Design Type
- 6.1.1. Hollow Shaft
- 6.1.2. Solid Shaft
- 6.2. Market Analysis, Insights and Forecast - by Position Type
- 6.2.1. Rear Axle
- 6.2.2. Front Axle
- 6.3. Market Analysis, Insights and Forecast - by Vehicle Type
- 6.3.1. Passenger Cars
- 6.3.2. Commercial Vehicles
- 6.4. Market Analysis, Insights and Forecast - by Sales Channel
- 6.4.1. OEM
- 6.4.2. Aftermarket
- 6.1. Market Analysis, Insights and Forecast - by Design Type
- 7. Europe Automotive Drive Shaft Industry Analysis, Insights and Forecast, 2019-2031
- 7.1. Market Analysis, Insights and Forecast - by Design Type
- 7.1.1. Hollow Shaft
- 7.1.2. Solid Shaft
- 7.2. Market Analysis, Insights and Forecast - by Position Type
- 7.2.1. Rear Axle
- 7.2.2. Front Axle
- 7.3. Market Analysis, Insights and Forecast - by Vehicle Type
- 7.3.1. Passenger Cars
- 7.3.2. Commercial Vehicles
- 7.4. Market Analysis, Insights and Forecast - by Sales Channel
- 7.4.1. OEM
- 7.4.2. Aftermarket
- 7.1. Market Analysis, Insights and Forecast - by Design Type
- 8. Asia Pacific Automotive Drive Shaft Industry Analysis, Insights and Forecast, 2019-2031
- 8.1. Market Analysis, Insights and Forecast - by Design Type
- 8.1.1. Hollow Shaft
- 8.1.2. Solid Shaft
- 8.2. Market Analysis, Insights and Forecast - by Position Type
- 8.2.1. Rear Axle
- 8.2.2. Front Axle
- 8.3. Market Analysis, Insights and Forecast - by Vehicle Type
- 8.3.1. Passenger Cars
- 8.3.2. Commercial Vehicles
- 8.4. Market Analysis, Insights and Forecast - by Sales Channel
- 8.4.1. OEM
- 8.4.2. Aftermarket
- 8.1. Market Analysis, Insights and Forecast - by Design Type
- 9. Rest of the World Automotive Drive Shaft Industry Analysis, Insights and Forecast, 2019-2031
- 9.1. Market Analysis, Insights and Forecast - by Design Type
- 9.1.1. Hollow Shaft
- 9.1.2. Solid Shaft
- 9.2. Market Analysis, Insights and Forecast - by Position Type
- 9.2.1. Rear Axle
- 9.2.2. Front Axle
- 9.3. Market Analysis, Insights and Forecast - by Vehicle Type
- 9.3.1. Passenger Cars
- 9.3.2. Commercial Vehicles
- 9.4. Market Analysis, Insights and Forecast - by Sales Channel
- 9.4.1. OEM
- 9.4.2. Aftermarket
- 9.1. Market Analysis, Insights and Forecast - by Design Type
- 10. North America Automotive Drive Shaft Industry Analysis, Insights and Forecast, 2019-2031
- 10.1. Market Analysis, Insights and Forecast - By Country/Sub-region
- 10.1.1 United States
- 10.1.2 Canada
- 10.1.3 Rest of North America
- 11. Europe Automotive Drive Shaft Industry Analysis, Insights and Forecast, 2019-2031
- 11.1. Market Analysis, Insights and Forecast - By Country/Sub-region
- 11.1.1 Germany
- 11.1.2 United Kingdom
- 11.1.3 France
- 11.1.4 Rest of Europe
- 12. Asia Pacific Automotive Drive Shaft Industry Analysis, Insights and Forecast, 2019-2031
- 12.1. Market Analysis, Insights and Forecast - By Country/Sub-region
- 12.1.1 India
- 12.1.2 China
- 12.1.3 Japan
- 12.1.4 South Korea
- 12.1.5 Rest of Asia Pacific
- 13. Rest of the World Automotive Drive Shaft Industry Analysis, Insights and Forecast, 2019-2031
- 13.1. Market Analysis, Insights and Forecast - By Country/Sub-region
- 13.1.1 Brazil
- 13.1.2 South Africa
- 13.1.3 Other Countries
- 14. Competitive Analysis
- 14.1. Global Market Share Analysis 2024
- 14.2. Company Profiles
- 14.2.1 JTEKT Corporation
- 14.2.1.1. Overview
- 14.2.1.2. Products
- 14.2.1.3. SWOT Analysis
- 14.2.1.4. Recent Developments
- 14.2.1.5. Financials (Based on Availability)
- 14.2.2 NTN Corporatio
- 14.2.2.1. Overview
- 14.2.2.2. Products
- 14.2.2.3. SWOT Analysis
- 14.2.2.4. Recent Developments
- 14.2.2.5. Financials (Based on Availability)
- 14.2.3 Dana Holding Corporation
- 14.2.3.1. Overview
- 14.2.3.2. Products
- 14.2.3.3. SWOT Analysis
- 14.2.3.4. Recent Developments
- 14.2.3.5. Financials (Based on Availability)
- 14.2.4 GKN PLC (Melrose Industries PLC)
- 14.2.4.1. Overview
- 14.2.4.2. Products
- 14.2.4.3. SWOT Analysis
- 14.2.4.4. Recent Developments
- 14.2.4.5. Financials (Based on Availability)
- 14.2.5 Showa Corporation
- 14.2.5.1. Overview
- 14.2.5.2. Products
- 14.2.5.3. SWOT Analysis
- 14.2.5.4. Recent Developments
- 14.2.5.5. Financials (Based on Availability)
- 14.2.6 Wanxiang Qianchao Co Ltd
- 14.2.6.1. Overview
- 14.2.6.2. Products
- 14.2.6.3. SWOT Analysis
- 14.2.6.4. Recent Developments
- 14.2.6.5. Financials (Based on Availability)
- 14.2.7 American Axle & Manufacturing Co Ltd
- 14.2.7.1. Overview
- 14.2.7.2. Products
- 14.2.7.3. SWOT Analysis
- 14.2.7.4. Recent Developments
- 14.2.7.5. Financials (Based on Availability)
- 14.2.8 Hyundai Wia Corporation
- 14.2.8.1. Overview
- 14.2.8.2. Products
- 14.2.8.3. SWOT Analysis
- 14.2.8.4. Recent Developments
- 14.2.8.5. Financials (Based on Availability)
- 14.2.9 Nexteer Automotive Group Ltd
- 14.2.9.1. Overview
- 14.2.9.2. Products
- 14.2.9.3. SWOT Analysis
- 14.2.9.4. Recent Developments
- 14.2.9.5. Financials (Based on Availability)
- 14.2.10 Yamada Manufacturing Co Ltd
- 14.2.10.1. Overview
- 14.2.10.2. Products
- 14.2.10.3. SWOT Analysis
- 14.2.10.4. Recent Developments
- 14.2.10.5. Financials (Based on Availability)
- 14.2.1 JTEKT Corporation
List of Figures
- Figure 1: Global Automotive Drive Shaft Industry Revenue Breakdown (Million, %) by Region 2024 & 2032
- Figure 2: North America Automotive Drive Shaft Industry Revenue (Million), by Country 2024 & 2032
- Figure 3: North America Automotive Drive Shaft Industry Revenue Share (%), by Country 2024 & 2032
- Figure 4: Europe Automotive Drive Shaft Industry Revenue (Million), by Country 2024 & 2032
- Figure 5: Europe Automotive Drive Shaft Industry Revenue Share (%), by Country 2024 & 2032
- Figure 6: Asia Pacific Automotive Drive Shaft Industry Revenue (Million), by Country 2024 & 2032
- Figure 7: Asia Pacific Automotive Drive Shaft Industry Revenue Share (%), by Country 2024 & 2032
- Figure 8: Rest of the World Automotive Drive Shaft Industry Revenue (Million), by Country 2024 & 2032
- Figure 9: Rest of the World Automotive Drive Shaft Industry Revenue Share (%), by Country 2024 & 2032
- Figure 10: North America Automotive Drive Shaft Industry Revenue (Million), by Design Type 2024 & 2032
- Figure 11: North America Automotive Drive Shaft Industry Revenue Share (%), by Design Type 2024 & 2032
- Figure 12: North America Automotive Drive Shaft Industry Revenue (Million), by Position Type 2024 & 2032
- Figure 13: North America Automotive Drive Shaft Industry Revenue Share (%), by Position Type 2024 & 2032
- Figure 14: North America Automotive Drive Shaft Industry Revenue (Million), by Vehicle Type 2024 & 2032
- Figure 15: North America Automotive Drive Shaft Industry Revenue Share (%), by Vehicle Type 2024 & 2032
- Figure 16: North America Automotive Drive Shaft Industry Revenue (Million), by Sales Channel 2024 & 2032
- Figure 17: North America Automotive Drive Shaft Industry Revenue Share (%), by Sales Channel 2024 & 2032
- Figure 18: North America Automotive Drive Shaft Industry Revenue (Million), by Country 2024 & 2032
- Figure 19: North America Automotive Drive Shaft Industry Revenue Share (%), by Country 2024 & 2032
- Figure 20: Europe Automotive Drive Shaft Industry Revenue (Million), by Design Type 2024 & 2032
- Figure 21: Europe Automotive Drive Shaft Industry Revenue Share (%), by Design Type 2024 & 2032
- Figure 22: Europe Automotive Drive Shaft Industry Revenue (Million), by Position Type 2024 & 2032
- Figure 23: Europe Automotive Drive Shaft Industry Revenue Share (%), by Position Type 2024 & 2032
- Figure 24: Europe Automotive Drive Shaft Industry Revenue (Million), by Vehicle Type 2024 & 2032
- Figure 25: Europe Automotive Drive Shaft Industry Revenue Share (%), by Vehicle Type 2024 & 2032
- Figure 26: Europe Automotive Drive Shaft Industry Revenue (Million), by Sales Channel 2024 & 2032
- Figure 27: Europe Automotive Drive Shaft Industry Revenue Share (%), by Sales Channel 2024 & 2032
- Figure 28: Europe Automotive Drive Shaft Industry Revenue (Million), by Country 2024 & 2032
- Figure 29: Europe Automotive Drive Shaft Industry Revenue Share (%), by Country 2024 & 2032
- Figure 30: Asia Pacific Automotive Drive Shaft Industry Revenue (Million), by Design Type 2024 & 2032
- Figure 31: Asia Pacific Automotive Drive Shaft Industry Revenue Share (%), by Design Type 2024 & 2032
- Figure 32: Asia Pacific Automotive Drive Shaft Industry Revenue (Million), by Position Type 2024 & 2032
- Figure 33: Asia Pacific Automotive Drive Shaft Industry Revenue Share (%), by Position Type 2024 & 2032
- Figure 34: Asia Pacific Automotive Drive Shaft Industry Revenue (Million), by Vehicle Type 2024 & 2032
- Figure 35: Asia Pacific Automotive Drive Shaft Industry Revenue Share (%), by Vehicle Type 2024 & 2032
- Figure 36: Asia Pacific Automotive Drive Shaft Industry Revenue (Million), by Sales Channel 2024 & 2032
- Figure 37: Asia Pacific Automotive Drive Shaft Industry Revenue Share (%), by Sales Channel 2024 & 2032
- Figure 38: Asia Pacific Automotive Drive Shaft Industry Revenue (Million), by Country 2024 & 2032
- Figure 39: Asia Pacific Automotive Drive Shaft Industry Revenue Share (%), by Country 2024 & 2032
- Figure 40: Rest of the World Automotive Drive Shaft Industry Revenue (Million), by Design Type 2024 & 2032
- Figure 41: Rest of the World Automotive Drive Shaft Industry Revenue Share (%), by Design Type 2024 & 2032
- Figure 42: Rest of the World Automotive Drive Shaft Industry Revenue (Million), by Position Type 2024 & 2032
- Figure 43: Rest of the World Automotive Drive Shaft Industry Revenue Share (%), by Position Type 2024 & 2032
- Figure 44: Rest of the World Automotive Drive Shaft Industry Revenue (Million), by Vehicle Type 2024 & 2032
- Figure 45: Rest of the World Automotive Drive Shaft Industry Revenue Share (%), by Vehicle Type 2024 & 2032
- Figure 46: Rest of the World Automotive Drive Shaft Industry Revenue (Million), by Sales Channel 2024 & 2032
- Figure 47: Rest of the World Automotive Drive Shaft Industry Revenue Share (%), by Sales Channel 2024 & 2032
- Figure 48: Rest of the World Automotive Drive Shaft Industry Revenue (Million), by Country 2024 & 2032
- Figure 49: Rest of the World Automotive Drive Shaft Industry Revenue Share (%), by Country 2024 & 2032
List of Tables
- Table 1: Global Automotive Drive Shaft Industry Revenue Million Forecast, by Region 2019 & 2032
- Table 2: Global Automotive Drive Shaft Industry Revenue Million Forecast, by Design Type 2019 & 2032
- Table 3: Global Automotive Drive Shaft Industry Revenue Million Forecast, by Position Type 2019 & 2032
- Table 4: Global Automotive Drive Shaft Industry Revenue Million Forecast, by Vehicle Type 2019 & 2032
- Table 5: Global Automotive Drive Shaft Industry Revenue Million Forecast, by Sales Channel 2019 & 2032
- Table 6: Global Automotive Drive Shaft Industry Revenue Million Forecast, by Region 2019 & 2032
- Table 7: Global Automotive Drive Shaft Industry Revenue Million Forecast, by Country 2019 & 2032
- Table 8: United States Automotive Drive Shaft Industry Revenue (Million) Forecast, by Application 2019 & 2032
- Table 9: Canada Automotive Drive Shaft Industry Revenue (Million) Forecast, by Application 2019 & 2032
- Table 10: Rest of North America Automotive Drive Shaft Industry Revenue (Million) Forecast, by Application 2019 & 2032
- Table 11: Global Automotive Drive Shaft Industry Revenue Million Forecast, by Country 2019 & 2032
- Table 12: Germany Automotive Drive Shaft Industry Revenue (Million) Forecast, by Application 2019 & 2032
- Table 13: United Kingdom Automotive Drive Shaft Industry Revenue (Million) Forecast, by Application 2019 & 2032
- Table 14: France Automotive Drive Shaft Industry Revenue (Million) Forecast, by Application 2019 & 2032
- Table 15: Rest of Europe Automotive Drive Shaft Industry Revenue (Million) Forecast, by Application 2019 & 2032
- Table 16: Global Automotive Drive Shaft Industry Revenue Million Forecast, by Country 2019 & 2032
- Table 17: India Automotive Drive Shaft Industry Revenue (Million) Forecast, by Application 2019 & 2032
- Table 18: China Automotive Drive Shaft Industry Revenue (Million) Forecast, by Application 2019 & 2032
- Table 19: Japan Automotive Drive Shaft Industry Revenue (Million) Forecast, by Application 2019 & 2032
- Table 20: South Korea Automotive Drive Shaft Industry Revenue (Million) Forecast, by Application 2019 & 2032
- Table 21: Rest of Asia Pacific Automotive Drive Shaft Industry Revenue (Million) Forecast, by Application 2019 & 2032
- Table 22: Global Automotive Drive Shaft Industry Revenue Million Forecast, by Country 2019 & 2032
- Table 23: Brazil Automotive Drive Shaft Industry Revenue (Million) Forecast, by Application 2019 & 2032
- Table 24: South Africa Automotive Drive Shaft Industry Revenue (Million) Forecast, by Application 2019 & 2032
- Table 25: Other Countries Automotive Drive Shaft Industry Revenue (Million) Forecast, by Application 2019 & 2032
- Table 26: Global Automotive Drive Shaft Industry Revenue Million Forecast, by Design Type 2019 & 2032
- Table 27: Global Automotive Drive Shaft Industry Revenue Million Forecast, by Position Type 2019 & 2032
- Table 28: Global Automotive Drive Shaft Industry Revenue Million Forecast, by Vehicle Type 2019 & 2032
- Table 29: Global Automotive Drive Shaft Industry Revenue Million Forecast, by Sales Channel 2019 & 2032
- Table 30: Global Automotive Drive Shaft Industry Revenue Million Forecast, by Country 2019 & 2032
- Table 31: United States Automotive Drive Shaft Industry Revenue (Million) Forecast, by Application 2019 & 2032
- Table 32: Canada Automotive Drive Shaft Industry Revenue (Million) Forecast, by Application 2019 & 2032
- Table 33: Rest of North America Automotive Drive Shaft Industry Revenue (Million) Forecast, by Application 2019 & 2032
- Table 34: Global Automotive Drive Shaft Industry Revenue Million Forecast, by Design Type 2019 & 2032
- Table 35: Global Automotive Drive Shaft Industry Revenue Million Forecast, by Position Type 2019 & 2032
- Table 36: Global Automotive Drive Shaft Industry Revenue Million Forecast, by Vehicle Type 2019 & 2032
- Table 37: Global Automotive Drive Shaft Industry Revenue Million Forecast, by Sales Channel 2019 & 2032
- Table 38: Global Automotive Drive Shaft Industry Revenue Million Forecast, by Country 2019 & 2032
- Table 39: Germany Automotive Drive Shaft Industry Revenue (Million) Forecast, by Application 2019 & 2032
- Table 40: United Kingdom Automotive Drive Shaft Industry Revenue (Million) Forecast, by Application 2019 & 2032
- Table 41: France Automotive Drive Shaft Industry Revenue (Million) Forecast, by Application 2019 & 2032
- Table 42: Rest of Europe Automotive Drive Shaft Industry Revenue (Million) Forecast, by Application 2019 & 2032
- Table 43: Global Automotive Drive Shaft Industry Revenue Million Forecast, by Design Type 2019 & 2032
- Table 44: Global Automotive Drive Shaft Industry Revenue Million Forecast, by Position Type 2019 & 2032
- Table 45: Global Automotive Drive Shaft Industry Revenue Million Forecast, by Vehicle Type 2019 & 2032
- Table 46: Global Automotive Drive Shaft Industry Revenue Million Forecast, by Sales Channel 2019 & 2032
- Table 47: Global Automotive Drive Shaft Industry Revenue Million Forecast, by Country 2019 & 2032
- Table 48: India Automotive Drive Shaft Industry Revenue (Million) Forecast, by Application 2019 & 2032
- Table 49: China Automotive Drive Shaft Industry Revenue (Million) Forecast, by Application 2019 & 2032
- Table 50: Japan Automotive Drive Shaft Industry Revenue (Million) Forecast, by Application 2019 & 2032
- Table 51: South Korea Automotive Drive Shaft Industry Revenue (Million) Forecast, by Application 2019 & 2032
- Table 52: Rest of Asia Pacific Automotive Drive Shaft Industry Revenue (Million) Forecast, by Application 2019 & 2032
- Table 53: Global Automotive Drive Shaft Industry Revenue Million Forecast, by Design Type 2019 & 2032
- Table 54: Global Automotive Drive Shaft Industry Revenue Million Forecast, by Position Type 2019 & 2032
- Table 55: Global Automotive Drive Shaft Industry Revenue Million Forecast, by Vehicle Type 2019 & 2032
- Table 56: Global Automotive Drive Shaft Industry Revenue Million Forecast, by Sales Channel 2019 & 2032
- Table 57: Global Automotive Drive Shaft Industry Revenue Million Forecast, by Country 2019 & 2032
- Table 58: South America Automotive Drive Shaft Industry Revenue (Million) Forecast, by Application 2019 & 2032
- Table 59: Middle East and Africa Automotive Drive Shaft Industry Revenue (Million) Forecast, by Application 2019 & 2032
Frequently Asked Questions
1. What is the projected Compound Annual Growth Rate (CAGR) of the Automotive Drive Shaft Industry?
The projected CAGR is approximately 6.54%.
2. Which companies are prominent players in the Automotive Drive Shaft Industry?
Key companies in the market include JTEKT Corporation, NTN Corporatio, Dana Holding Corporation, GKN PLC (Melrose Industries PLC), Showa Corporation, Wanxiang Qianchao Co Ltd, American Axle & Manufacturing Co Ltd, Hyundai Wia Corporation, Nexteer Automotive Group Ltd, Yamada Manufacturing Co Ltd.
3. What are the main segments of the Automotive Drive Shaft Industry?
The market segments include Design Type, Position Type, Vehicle Type, Sales Channel.
4. Can you provide details about the market size?
The market size is estimated to be USD 74.26 Million as of 2022.
5. What are some drivers contributing to market growth?
Automotive Industry Continues to Witness Steady Growth in Vehicle Production; Growing Awareness of Air Pollution and Health Concerns.
6. What are the notable trends driving market growth?
Increasing Demand for Electric Vehicles to Drive Growth of the Market.
7. Are there any restraints impacting market growth?
Shift towards Disposable Filters.
8. Can you provide examples of recent developments in the market?
January 2023: Dana Cardenas opened a new USD 21 million plant in Querétaro, Mexico, with a production line that will make Toyota components. The first production line, which already began with 110 employees, will be joined by two more lines later in 2023 for a total annual production of 545,000 units with 300 employees. Alejandro Sánchez Alvarado, Operations Director at Dana Cardanes, explained that three production lines are being installed in the new 917-square-meter facility, where cardan shafts (drive shafts) will be manufactured for use in Toyota trucks.
9. What pricing options are available for accessing the report?
Pricing options include single-user, multi-user, and enterprise licenses priced at USD 4750, USD 5250, and USD 8750 respectively.
10. Is the market size provided in terms of value or volume?
The market size is provided in terms of value, measured in Million.
11. Are there any specific market keywords associated with the report?
Yes, the market keyword associated with the report is "Automotive Drive Shaft Industry," which aids in identifying and referencing the specific market segment covered.
12. How do I determine which pricing option suits my needs best?
The pricing options vary based on user requirements and access needs. Individual users may opt for single-user licenses, while businesses requiring broader access may choose multi-user or enterprise licenses for cost-effective access to the report.
13. Are there any additional resources or data provided in the Automotive Drive Shaft Industry report?
While the report offers comprehensive insights, it's advisable to review the specific contents or supplementary materials provided to ascertain if additional resources or data are available.
14. How can I stay updated on further developments or reports in the Automotive Drive Shaft Industry?
To stay informed about further developments, trends, and reports in the Automotive Drive Shaft Industry, consider subscribing to industry newsletters, following relevant companies and organizations, or regularly checking reputable industry news sources and publications.
Methodology
Step 1 - Identification of Relevant Samples Size from Population Database


Step 2 - Approaches for Defining Global Market Size (Value, Volume* & Price*)

Note*: In applicable scenarios
Step 3 - Data Sources
Primary Research
- Web Analytics
- Survey Reports
- Research Institute
- Latest Research Reports
- Opinion Leaders
Secondary Research
- Annual Reports
- White Paper
- Latest Press Release
- Industry Association
- Paid Database
- Investor Presentations

Step 4 - Data Triangulation
Involves using different sources of information in order to increase the validity of a study
These sources are likely to be stakeholders in a program - participants, other researchers, program staff, other community members, and so on.
Then we put all data in single framework & apply various statistical tools to find out the dynamic on the market.
During the analysis stage, feedback from the stakeholder groups would be compared to determine areas of agreement as well as areas of divergence
