

Key Insights
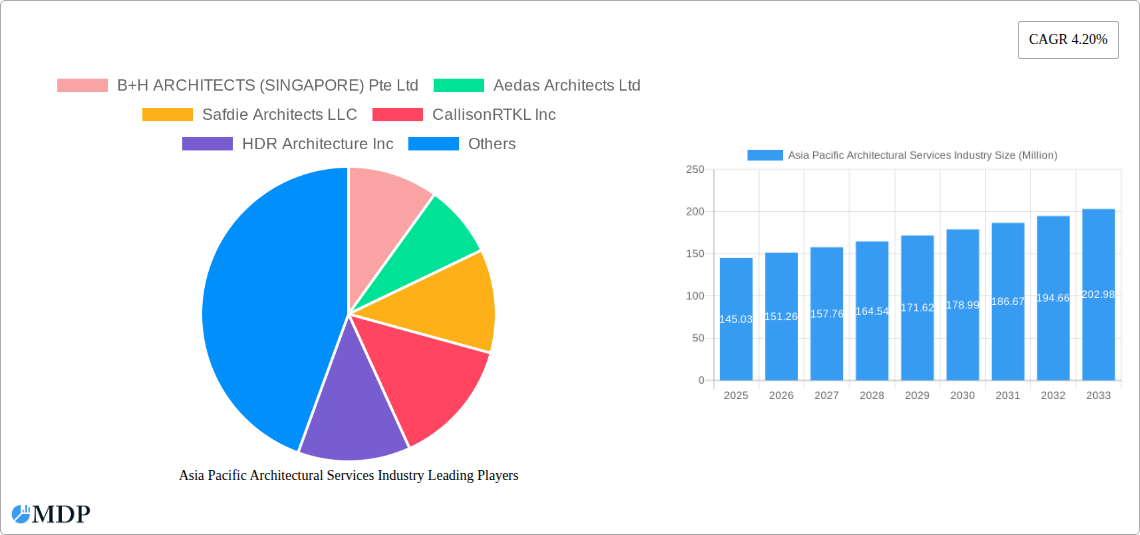
The Asia Pacific architectural services market, valued at $145.03 million in 2025, is projected to experience robust growth, driven by significant infrastructure development across the region, particularly in rapidly urbanizing nations like China and India. The 4.20% CAGR forecast for the period 2025-2033 indicates a substantial market expansion, fueled by increasing government spending on public infrastructure projects, rising disposable incomes leading to higher residential construction, and a growing demand for sustainable and technologically advanced building designs. Key segments driving this growth include residential construction, propelled by burgeoning populations and urbanization, and the healthcare and life sciences sectors, requiring specialized architectural expertise for hospitals, research facilities, and pharmaceutical plants. Furthermore, the corporate sector's need for modern and efficient office spaces contributes significantly to the market's expansion. Competition among architectural firms is intense, with both established international players and local firms vying for projects. This competitive landscape encourages innovation and the adoption of cutting-edge technologies like Building Information Modeling (BIM) to enhance efficiency and deliver high-quality designs. The market also faces certain challenges, including fluctuating raw material prices, regulatory complexities, and the need to adapt to evolving sustainability standards. However, the overall outlook remains positive, with the market poised for significant expansion in the coming years.
The geographical distribution of the market is heavily concentrated in China, India, and Japan, reflecting these countries' substantial construction activities and economic growth. However, other nations within the Asia Pacific region, including Singapore, Hong Kong, and South Korea, also contribute significantly to market demand. The presence of numerous prominent architectural firms, such as Aedas Architects, Safdie Architects, and AECOM, underscores the market's maturity and its attractiveness to both domestic and international players. The continuous influx of foreign investment in infrastructure projects further strengthens the positive growth trajectory. Future growth will depend on successfully navigating regulatory hurdles, fostering innovation in sustainable building practices, and effectively addressing the challenges presented by economic fluctuations and geopolitical factors. The long-term outlook remains optimistic, suggesting a significant expansion of the Asia Pacific architectural services market throughout the forecast period.
Asia Pacific Architectural Services Industry: 2019-2033 Market Report
This comprehensive report provides an in-depth analysis of the Asia Pacific architectural services industry, offering invaluable insights for stakeholders seeking to navigate this dynamic market. The report covers the period 2019-2033, with a focus on 2025, incorporating historical data, current trends, and future projections. The market is valued at XX Million in 2025 and is projected to reach XX Million by 2033, exhibiting a robust CAGR of XX%.
This report is crucial for: investors, architects, construction firms, real estate developers, government agencies, and anyone interested in understanding and capitalizing on opportunities within the Asia Pacific architectural services market.
Asia Pacific Architectural Services Industry Market Dynamics & Concentration
The Asia Pacific architectural services market exhibits a moderately concentrated landscape, with a handful of large multinational firms and numerous regional players competing for projects across diverse sectors. Market share is primarily determined by firm size, reputation, specialization, and geographic reach. While exact market share figures for individual firms are proprietary information, it can be estimated that the top 10 firms command approximately 60% of the market, with the remaining 40% distributed among smaller, specialized firms.
- Innovation Drivers: Technological advancements such as BIM (Building Information Modeling), sustainable design practices, and digital fabrication are driving significant innovation within the industry.
- Regulatory Frameworks: Varying building codes and regulations across different countries in the Asia-Pacific region present both challenges and opportunities, influencing project costs and design approaches.
- Product Substitutes: The rise of prefabricated building components presents a partial substitute for traditional architectural services, impacting project timelines and labor costs.
- End-user Trends: Increasing urbanization, coupled with a growing middle class, is fuelling demand for residential, commercial, and infrastructure development, driving growth in the architectural services market.
- M&A Activities: The industry has witnessed a moderate level of mergers and acquisitions (M&A) activity in recent years, with larger firms strategically acquiring smaller firms to expand their geographic footprint and service offerings. The number of M&A deals has averaged approximately xx per year over the past 5 years.
Asia Pacific Architectural Services Industry Industry Trends & Analysis
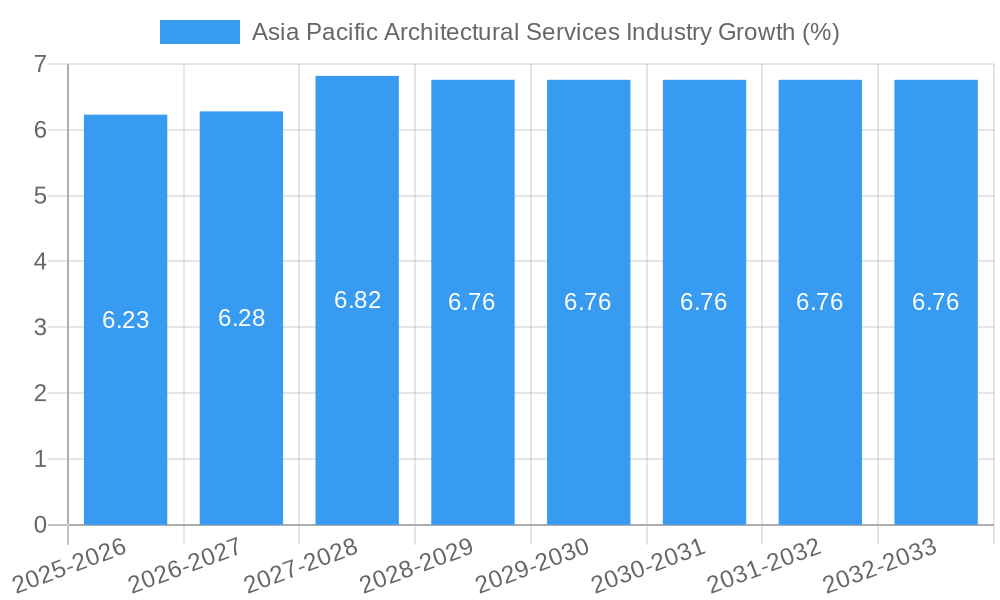
The Asia Pacific architectural services market is experiencing significant growth, driven by several key factors. Rapid urbanization, particularly in emerging economies like India and China, is creating a massive demand for new infrastructure and buildings. This, coupled with rising disposable incomes and a preference for improved living standards, translates into heightened demand for modern, efficient, and aesthetically pleasing architectural designs. Technological advancements like BIM and digital design tools are streamlining workflows, improving project efficiency, and reducing costs. However, intense competition and fluctuating material prices pose challenges. The market’s growth trajectory reflects a strong correlation between infrastructural development initiatives by governments and private sector investments in real estate. The overall market is expected to maintain a consistent growth trajectory, with a forecasted CAGR of xx% between 2025 and 2033, exceeding market penetration rates of xx% in major markets. Consumer preference is shifting towards sustainable and environmentally friendly designs, further influencing market trends.
Leading Markets & Segments in Asia Pacific Architectural Services Industry
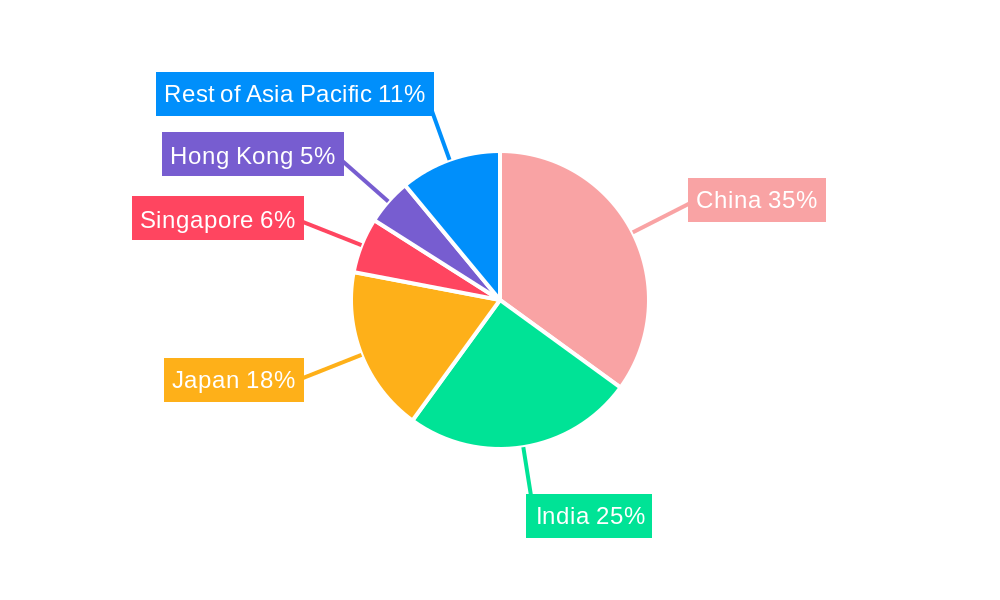
China and India represent the largest markets for architectural services within the Asia Pacific region, driven by rapid urbanization, robust economic growth, and significant government investment in infrastructure development. Singapore and Japan, while smaller in terms of overall market size, showcase high per capita spending, prioritizing sophisticated and technologically advanced architectural solutions.
By Country:
- China: Booming real estate sector, government infrastructure projects (e.g., Belt and Road Initiative), and a large population drive significant demand.
- India: Rapid urbanization, economic growth, and increasing middle-class disposable incomes fuel residential, commercial, and infrastructure development.
- Japan: Focus on sustainable and technologically advanced architecture, rebuilding after natural disasters, and high-quality construction drive the market.
- Singapore: High-density urban environment, focus on sustainable development, and a strong economy create a specialized market for high-rise and sustainable designs.
- Hong Kong: Similar to Singapore, a focus on high-density design and high-value projects contributes to significant market activity.
- Rest of Asia Pacific: This segment demonstrates a range of market characteristics and growth rates, influenced by local economic conditions and infrastructure investment priorities.
By End-user Vertical:
- Residential: Remains the largest segment, driven by population growth and urbanization.
- Commercial: Strong growth due to increased business activity and investment in office spaces and retail developments.
- Healthcare and Life Sciences: Significant growth is expected, fueled by aging populations and investment in healthcare infrastructure.
- Education: Continued expansion in educational institutions drives the demand for new school and university buildings.
- Other End-user Verticals: This segment encompasses a wide range of projects and experiences varied growth rates.
Asia Pacific Architectural Services Industry Product Developments
Recent product innovations include the increasing adoption of BIM software, which enhances collaboration, improves design accuracy, and streamlines project workflows. The integration of sustainable design principles is becoming standard practice, impacting materials selection and energy efficiency. The growing use of prefabricated building components is affecting construction timelines and reducing on-site labor costs. These developments directly address client demands for faster project completion, cost-effectiveness, and environmentally friendly buildings.
Key Drivers of Asia Pacific Architectural Services Industry Growth
Several factors contribute to the industry's growth. Firstly, rapid urbanization in many Asia-Pacific countries is generating a massive need for new residential and commercial spaces. Secondly, increasing government investment in infrastructure projects, such as transportation networks and public buildings, is a significant growth driver. Finally, technological advancements in design and construction are leading to more efficient and cost-effective processes, attracting further investment.
Challenges in the Asia Pacific Architectural Services Industry Market
The industry faces several challenges, including intense competition, particularly from international firms, leading to compressed profit margins. Fluctuations in material costs due to global supply chain disruptions create uncertainties in project budgets. Strict building codes and regulations in various countries necessitate complex compliance procedures, increasing project timelines. The average project delay due to regulatory hurdles has been estimated at xx months, impacting profitability.
Emerging Opportunities in Asia Pacific Architectural Services Industry
The adoption of advanced technologies like AI and VR in design and construction promises to improve efficiency and collaboration. Strategic partnerships between architectural firms and technology providers can create new opportunities for innovation and market penetration. Expanding into underserved markets within the Asia Pacific region offers opportunities for growth, particularly in countries with burgeoning economies.
Leading Players in the Asia Pacific Architectural Services Industry Sector
- B+H ARCHITECTS (SINGAPORE) Pte Ltd
- Aedas Architects Ltd
- Safdie Architects LLC
- CallisonRTKL Inc
- HDR Architecture Inc
- IBI Group Inc
- Mitsubishi Jisho Sekkei
- DP Architects Pte Ltd
- AECOM LTD
- Skidmore Owings & Merrill LLP
- WSP Architects
- HKS Inc
- Aamer Architects
- Arup Group Limited
- MORPHOGENESIS Realty Pvt Ltd
- Stantec Inc
- M Arthur Gensler Jr & Associates Inc
- KUME SEKKEI Co Ltd
- *List Not Exhaustive
Key Milestones in Asia Pacific Architectural Services Industry Industry
- August 2022: Dewan Architects + Engineers opened its first office in Vietnam, expanding its Southeast Asia presence.
- March 2022: Foster + Partners unveiled a masterplan for a new 117.4-hectare city in Ho Chi Minh City, Vietnam, encompassing residential, medical, educational, and leisure facilities.
Strategic Outlook for Asia Pacific Architectural Services Industry Market
The Asia Pacific architectural services market is poised for sustained growth, driven by ongoing urbanization, infrastructure development, and technological advancements. Strategic opportunities exist for firms that embrace sustainable design principles, leverage digital technologies, and form strategic alliances to expand their market reach and capture a larger share of this burgeoning market. Focus on specialization and delivering innovative, client-centric solutions will be key differentiators in the years to come.
Asia Pacific Architectural Services Industry Segmentation
-
1. End-user Vertical
- 1.1. Residential
- 1.2. Education
- 1.3. Healthcare and Life Sciences
- 1.4. Corporate
- 1.5. Other End-user Verticals
Asia Pacific Architectural Services Industry Segmentation By Geography
-
1. Asia Pacific
- 1.1. China
- 1.2. Japan
- 1.3. South Korea
- 1.4. India
- 1.5. Australia
- 1.6. New Zealand
- 1.7. Indonesia
- 1.8. Malaysia
- 1.9. Singapore
- 1.10. Thailand
- 1.11. Vietnam
- 1.12. Philippines
Asia Pacific Architectural Services Industry REPORT HIGHLIGHTS
| Aspects | Details |
|---|---|
| Study Period | 2019-2033 |
| Base Year | 2024 |
| Estimated Year | 2025 |
| Forecast Period | 2025-2033 |
| Historical Period | 2019-2024 |
| Growth Rate | CAGR of 4.20% from 2019-2033 |
| Segmentation |
|
Table of Contents
- 1. Introduction
- 1.1. Research Scope
- 1.2. Market Segmentation
- 1.3. Research Methodology
- 1.4. Definitions and Assumptions
- 2. Executive Summary
- 2.1. Introduction
- 3. Market Dynamics
- 3.1. Introduction
- 3.2. Market Drivers
- 3.2.1. Increasing Demand for Green Building; Adoption of 3D Printing
- 3.3. Market Restrains
- 3.3.1. Lack of New Skills and Knowledge in Designing
- 3.4. Market Trends
- 3.4.1. Residential Sector to Hold Significant Market Share
- 4. Market Factor Analysis
- 4.1. Porters Five Forces
- 4.2. Supply/Value Chain
- 4.3. PESTEL analysis
- 4.4. Market Entropy
- 4.5. Patent/Trademark Analysis
- 5. Asia Pacific Architectural Services Industry Analysis, Insights and Forecast, 2019-2031
- 5.1. Market Analysis, Insights and Forecast - by End-user Vertical
- 5.1.1. Residential
- 5.1.2. Education
- 5.1.3. Healthcare and Life Sciences
- 5.1.4. Corporate
- 5.1.5. Other End-user Verticals
- 5.2. Market Analysis, Insights and Forecast - by Region
- 5.2.1. Asia Pacific
- 5.1. Market Analysis, Insights and Forecast - by End-user Vertical
- 6. China Asia Pacific Architectural Services Industry Analysis, Insights and Forecast, 2019-2031
- 7. Japan Asia Pacific Architectural Services Industry Analysis, Insights and Forecast, 2019-2031
- 8. India Asia Pacific Architectural Services Industry Analysis, Insights and Forecast, 2019-2031
- 9. South Korea Asia Pacific Architectural Services Industry Analysis, Insights and Forecast, 2019-2031
- 10. Taiwan Asia Pacific Architectural Services Industry Analysis, Insights and Forecast, 2019-2031
- 11. Australia Asia Pacific Architectural Services Industry Analysis, Insights and Forecast, 2019-2031
- 12. Rest of Asia-Pacific Asia Pacific Architectural Services Industry Analysis, Insights and Forecast, 2019-2031
- 13. Competitive Analysis
- 13.1. Market Share Analysis 2024
- 13.2. Company Profiles
- 13.2.1 B+H ARCHITECTS (SINGAPORE) Pte Ltd
- 13.2.1.1. Overview
- 13.2.1.2. Products
- 13.2.1.3. SWOT Analysis
- 13.2.1.4. Recent Developments
- 13.2.1.5. Financials (Based on Availability)
- 13.2.2 Aedas Architects Ltd
- 13.2.2.1. Overview
- 13.2.2.2. Products
- 13.2.2.3. SWOT Analysis
- 13.2.2.4. Recent Developments
- 13.2.2.5. Financials (Based on Availability)
- 13.2.3 Safdie Architects LLC
- 13.2.3.1. Overview
- 13.2.3.2. Products
- 13.2.3.3. SWOT Analysis
- 13.2.3.4. Recent Developments
- 13.2.3.5. Financials (Based on Availability)
- 13.2.4 CallisonRTKL Inc
- 13.2.4.1. Overview
- 13.2.4.2. Products
- 13.2.4.3. SWOT Analysis
- 13.2.4.4. Recent Developments
- 13.2.4.5. Financials (Based on Availability)
- 13.2.5 HDR Architecture Inc
- 13.2.5.1. Overview
- 13.2.5.2. Products
- 13.2.5.3. SWOT Analysis
- 13.2.5.4. Recent Developments
- 13.2.5.5. Financials (Based on Availability)
- 13.2.6 IBI Group Inc
- 13.2.6.1. Overview
- 13.2.6.2. Products
- 13.2.6.3. SWOT Analysis
- 13.2.6.4. Recent Developments
- 13.2.6.5. Financials (Based on Availability)
- 13.2.7 Mitsubishi Jisho Sekkei
- 13.2.7.1. Overview
- 13.2.7.2. Products
- 13.2.7.3. SWOT Analysis
- 13.2.7.4. Recent Developments
- 13.2.7.5. Financials (Based on Availability)
- 13.2.8 DP Architects Pte Ltd
- 13.2.8.1. Overview
- 13.2.8.2. Products
- 13.2.8.3. SWOT Analysis
- 13.2.8.4. Recent Developments
- 13.2.8.5. Financials (Based on Availability)
- 13.2.9 AECOM LTD
- 13.2.9.1. Overview
- 13.2.9.2. Products
- 13.2.9.3. SWOT Analysis
- 13.2.9.4. Recent Developments
- 13.2.9.5. Financials (Based on Availability)
- 13.2.10 Skidmore Owings & Merrill LLP
- 13.2.10.1. Overview
- 13.2.10.2. Products
- 13.2.10.3. SWOT Analysis
- 13.2.10.4. Recent Developments
- 13.2.10.5. Financials (Based on Availability)
- 13.2.11 WSP Architects
- 13.2.11.1. Overview
- 13.2.11.2. Products
- 13.2.11.3. SWOT Analysis
- 13.2.11.4. Recent Developments
- 13.2.11.5. Financials (Based on Availability)
- 13.2.12 HKS Inc
- 13.2.12.1. Overview
- 13.2.12.2. Products
- 13.2.12.3. SWOT Analysis
- 13.2.12.4. Recent Developments
- 13.2.12.5. Financials (Based on Availability)
- 13.2.13 Aamer Architects
- 13.2.13.1. Overview
- 13.2.13.2. Products
- 13.2.13.3. SWOT Analysis
- 13.2.13.4. Recent Developments
- 13.2.13.5. Financials (Based on Availability)
- 13.2.14 Arup Group Limited
- 13.2.14.1. Overview
- 13.2.14.2. Products
- 13.2.14.3. SWOT Analysis
- 13.2.14.4. Recent Developments
- 13.2.14.5. Financials (Based on Availability)
- 13.2.15 MORPHOGENESIS Realty Pvt Ltd
- 13.2.15.1. Overview
- 13.2.15.2. Products
- 13.2.15.3. SWOT Analysis
- 13.2.15.4. Recent Developments
- 13.2.15.5. Financials (Based on Availability)
- 13.2.16 Stantec Inc
- 13.2.16.1. Overview
- 13.2.16.2. Products
- 13.2.16.3. SWOT Analysis
- 13.2.16.4. Recent Developments
- 13.2.16.5. Financials (Based on Availability)
- 13.2.17 M Arthur Gensler Jr & Associates Inc
- 13.2.17.1. Overview
- 13.2.17.2. Products
- 13.2.17.3. SWOT Analysis
- 13.2.17.4. Recent Developments
- 13.2.17.5. Financials (Based on Availability)
- 13.2.18 KUME SEKKEI Co Ltd*List Not Exhaustive
- 13.2.18.1. Overview
- 13.2.18.2. Products
- 13.2.18.3. SWOT Analysis
- 13.2.18.4. Recent Developments
- 13.2.18.5. Financials (Based on Availability)
- 13.2.1 B+H ARCHITECTS (SINGAPORE) Pte Ltd
List of Figures
- Figure 1: Asia Pacific Architectural Services Industry Revenue Breakdown (Million, %) by Product 2024 & 2032
- Figure 2: Asia Pacific Architectural Services Industry Share (%) by Company 2024
List of Tables
- Table 1: Asia Pacific Architectural Services Industry Revenue Million Forecast, by Region 2019 & 2032
- Table 2: Asia Pacific Architectural Services Industry Revenue Million Forecast, by End-user Vertical 2019 & 2032
- Table 3: Asia Pacific Architectural Services Industry Revenue Million Forecast, by Region 2019 & 2032
- Table 4: Asia Pacific Architectural Services Industry Revenue Million Forecast, by Country 2019 & 2032
- Table 5: China Asia Pacific Architectural Services Industry Revenue (Million) Forecast, by Application 2019 & 2032
- Table 6: Japan Asia Pacific Architectural Services Industry Revenue (Million) Forecast, by Application 2019 & 2032
- Table 7: India Asia Pacific Architectural Services Industry Revenue (Million) Forecast, by Application 2019 & 2032
- Table 8: South Korea Asia Pacific Architectural Services Industry Revenue (Million) Forecast, by Application 2019 & 2032
- Table 9: Taiwan Asia Pacific Architectural Services Industry Revenue (Million) Forecast, by Application 2019 & 2032
- Table 10: Australia Asia Pacific Architectural Services Industry Revenue (Million) Forecast, by Application 2019 & 2032
- Table 11: Rest of Asia-Pacific Asia Pacific Architectural Services Industry Revenue (Million) Forecast, by Application 2019 & 2032
- Table 12: Asia Pacific Architectural Services Industry Revenue Million Forecast, by End-user Vertical 2019 & 2032
- Table 13: Asia Pacific Architectural Services Industry Revenue Million Forecast, by Country 2019 & 2032
- Table 14: China Asia Pacific Architectural Services Industry Revenue (Million) Forecast, by Application 2019 & 2032
- Table 15: Japan Asia Pacific Architectural Services Industry Revenue (Million) Forecast, by Application 2019 & 2032
- Table 16: South Korea Asia Pacific Architectural Services Industry Revenue (Million) Forecast, by Application 2019 & 2032
- Table 17: India Asia Pacific Architectural Services Industry Revenue (Million) Forecast, by Application 2019 & 2032
- Table 18: Australia Asia Pacific Architectural Services Industry Revenue (Million) Forecast, by Application 2019 & 2032
- Table 19: New Zealand Asia Pacific Architectural Services Industry Revenue (Million) Forecast, by Application 2019 & 2032
- Table 20: Indonesia Asia Pacific Architectural Services Industry Revenue (Million) Forecast, by Application 2019 & 2032
- Table 21: Malaysia Asia Pacific Architectural Services Industry Revenue (Million) Forecast, by Application 2019 & 2032
- Table 22: Singapore Asia Pacific Architectural Services Industry Revenue (Million) Forecast, by Application 2019 & 2032
- Table 23: Thailand Asia Pacific Architectural Services Industry Revenue (Million) Forecast, by Application 2019 & 2032
- Table 24: Vietnam Asia Pacific Architectural Services Industry Revenue (Million) Forecast, by Application 2019 & 2032
- Table 25: Philippines Asia Pacific Architectural Services Industry Revenue (Million) Forecast, by Application 2019 & 2032
Frequently Asked Questions
1. What is the projected Compound Annual Growth Rate (CAGR) of the Asia Pacific Architectural Services Industry?
The projected CAGR is approximately 4.20%.
2. Which companies are prominent players in the Asia Pacific Architectural Services Industry?
Key companies in the market include B+H ARCHITECTS (SINGAPORE) Pte Ltd, Aedas Architects Ltd, Safdie Architects LLC, CallisonRTKL Inc, HDR Architecture Inc, IBI Group Inc, Mitsubishi Jisho Sekkei, DP Architects Pte Ltd, AECOM LTD, Skidmore Owings & Merrill LLP, WSP Architects, HKS Inc, Aamer Architects, Arup Group Limited, MORPHOGENESIS Realty Pvt Ltd, Stantec Inc, M Arthur Gensler Jr & Associates Inc, KUME SEKKEI Co Ltd*List Not Exhaustive.
3. What are the main segments of the Asia Pacific Architectural Services Industry?
The market segments include End-user Vertical.
4. Can you provide details about the market size?
The market size is estimated to be USD 145.03 Million as of 2022.
5. What are some drivers contributing to market growth?
Increasing Demand for Green Building; Adoption of 3D Printing.
6. What are the notable trends driving market growth?
Residential Sector to Hold Significant Market Share.
7. Are there any restraints impacting market growth?
Lack of New Skills and Knowledge in Designing.
8. Can you provide examples of recent developments in the market?
August 2022: Dewan Architects + Engineers, a multidisciplinary architectural design firm, opened its first office in Vietnam to support its growth and expand its footprint in Southeast Asia. Located in the Bitexco Financial Tower in Ho Chi Minh City, the office will be staffed by the company's growing team of engineers and architects.
9. What pricing options are available for accessing the report?
Pricing options include single-user, multi-user, and enterprise licenses priced at USD 4750, USD 5250, and USD 8750 respectively.
10. Is the market size provided in terms of value or volume?
The market size is provided in terms of value, measured in Million.
11. Are there any specific market keywords associated with the report?
Yes, the market keyword associated with the report is "Asia Pacific Architectural Services Industry," which aids in identifying and referencing the specific market segment covered.
12. How do I determine which pricing option suits my needs best?
The pricing options vary based on user requirements and access needs. Individual users may opt for single-user licenses, while businesses requiring broader access may choose multi-user or enterprise licenses for cost-effective access to the report.
13. Are there any additional resources or data provided in the Asia Pacific Architectural Services Industry report?
While the report offers comprehensive insights, it's advisable to review the specific contents or supplementary materials provided to ascertain if additional resources or data are available.
14. How can I stay updated on further developments or reports in the Asia Pacific Architectural Services Industry?
To stay informed about further developments, trends, and reports in the Asia Pacific Architectural Services Industry, consider subscribing to industry newsletters, following relevant companies and organizations, or regularly checking reputable industry news sources and publications.
Methodology
Step 1 - Identification of Relevant Samples Size from Population Database


Step 2 - Approaches for Defining Global Market Size (Value, Volume* & Price*)

Note*: In applicable scenarios
Step 3 - Data Sources
Primary Research
- Web Analytics
- Survey Reports
- Research Institute
- Latest Research Reports
- Opinion Leaders
Secondary Research
- Annual Reports
- White Paper
- Latest Press Release
- Industry Association
- Paid Database
- Investor Presentations

Step 4 - Data Triangulation
Involves using different sources of information in order to increase the validity of a study
These sources are likely to be stakeholders in a program - participants, other researchers, program staff, other community members, and so on.
Then we put all data in single framework & apply various statistical tools to find out the dynamic on the market.
During the analysis stage, feedback from the stakeholder groups would be compared to determine areas of agreement as well as areas of divergence
