

Key Insights
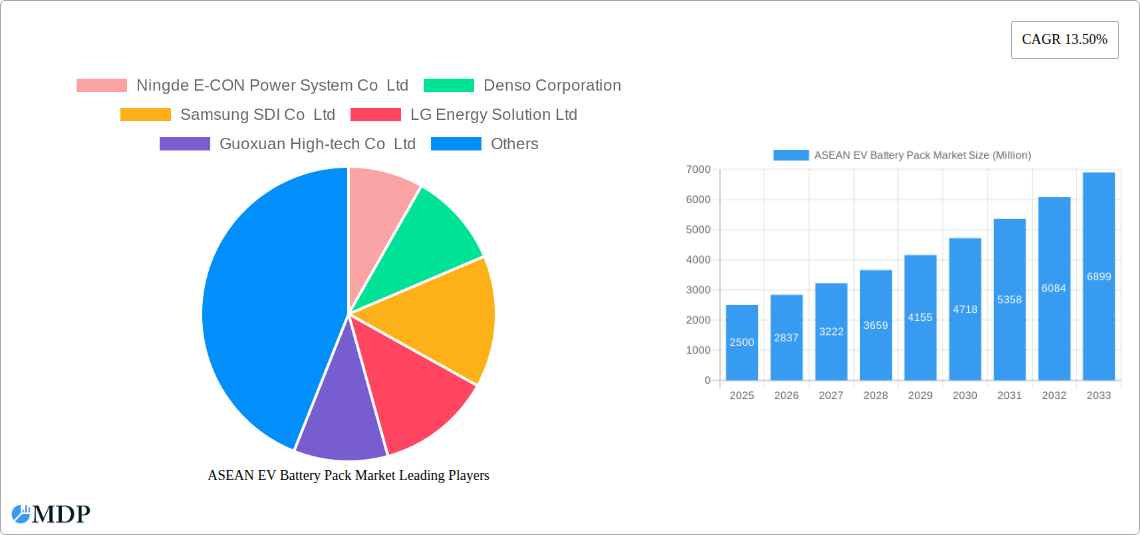
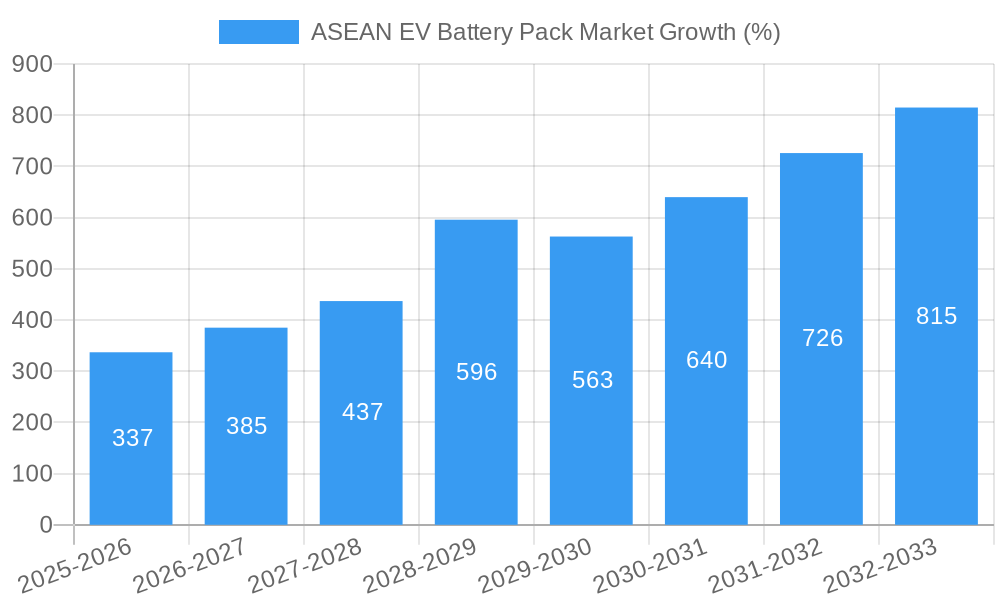
The ASEAN EV Battery Pack market is experiencing robust growth, projected to reach a significant market size driven by increasing EV adoption across the region. The 13.50% CAGR indicates a substantial expansion over the forecast period (2025-2033), fueled by supportive government policies promoting electric mobility, expanding charging infrastructure, and rising environmental awareness among consumers. Key market segments include passenger cars, which currently dominate, followed by buses and light commercial vehicles (LCVs). The battery chemistry landscape is diverse, with NCM, NCA, and LFP chemistries competing based on cost, performance, and energy density requirements. The prevalent battery forms are prismatic and cylindrical, reflecting the manufacturing capabilities and preferences of various original equipment manufacturers (OEMs). While Thailand represents a significant regional player, other ASEAN nations are rapidly developing their EV ecosystems, contributing to the overall market expansion. The market is also witnessing technological advancements in battery materials, focusing on enhanced energy density, longer lifespan, and improved safety features. Leading players like CATL, LG Energy Solution, and BYD are strategically investing in manufacturing and R&D capabilities within the ASEAN region to capitalize on this burgeoning opportunity. The proliferation of BEVs is a major driver, while PHEVs also contribute to market growth. Challenges include raw material price volatility, supply chain complexities, and the need for further development of battery recycling infrastructure.
The competitive landscape is characterized by a mix of global giants and regional players. The presence of established battery manufacturers alongside emerging local companies fosters innovation and ensures a competitive pricing structure. Different battery capacities are catered to, ranging from those suitable for smaller EVs to those for larger vehicles with extended ranges. The market is further segmented by components (anode, cathode, electrolyte, separator), manufacturing methods (laser, wire welding), and material types (Cobalt, Lithium, Manganese, Nickel, Natural Graphite). Future market growth will depend on continued government support for EV adoption, successful implementation of charging infrastructure projects, and technological breakthroughs that improve battery performance and reduce costs. The increasing focus on sustainable practices within the supply chain and the development of efficient battery recycling technologies are likely to further shape the ASEAN EV Battery Pack market's future.
ASEAN EV Battery Pack Market: A Comprehensive Report (2019-2033)
This in-depth report provides a comprehensive analysis of the ASEAN EV battery pack market, covering market dynamics, industry trends, leading players, and future growth prospects. The study period spans 2019-2033, with 2025 as the base and estimated year. This report is essential for industry stakeholders, investors, and anyone seeking to understand this rapidly evolving market.
ASEAN EV Battery Pack Market Market Dynamics & Concentration
The ASEAN EV battery pack market is experiencing robust growth, driven by increasing EV adoption, supportive government policies, and advancements in battery technology. Market concentration is moderate, with several key players vying for market share. The market is characterized by significant innovation, particularly in battery chemistry and form factors. Stringent environmental regulations are pushing the adoption of EVs, creating a favorable environment for battery pack manufacturers. However, the market also faces challenges from the availability of raw materials and the fluctuating prices of key components such as lithium and cobalt. Mergers and acquisitions (M&A) activity is expected to increase as companies seek to expand their market reach and consolidate their positions.
- Market Concentration: Moderate, with top 5 players holding approximately xx% market share in 2025.
- Innovation Drivers: Advancements in battery chemistry (LFP, NMC, NCA), improved energy density, and faster charging capabilities.
- Regulatory Frameworks: Government incentives, emission standards, and investment in charging infrastructure are boosting market growth.
- Product Substitutes: While limited, alternative energy storage solutions and internal combustion engine vehicles remain competitive.
- End-User Trends: Growing preference for EVs among consumers in urban areas, coupled with increasing affordability.
- M&A Activities: An estimated xx M&A deals occurred between 2019 and 2024, with further consolidation expected.
ASEAN EV Battery Pack Market Industry Trends & Analysis
The ASEAN EV battery pack market is projected to witness a Compound Annual Growth Rate (CAGR) of xx% during the forecast period (2025-2033). This growth is fueled by several factors, including rising demand for electric vehicles across various segments (passenger cars, LCVs, buses, and M&HDTs), increasing government support for EV adoption through subsidies and tax benefits, and advancements in battery technology that are leading to improved performance, longer lifespans, and reduced costs. Consumer preferences are shifting towards EVs due to their environmental benefits and lower running costs. The competitive landscape is highly dynamic, with both established players and new entrants vying for market share through product innovation, strategic partnerships, and aggressive pricing strategies. Market penetration of EVs is expected to reach xx% by 2033.
Leading Markets & Segments in ASEAN EV Battery Pack Market
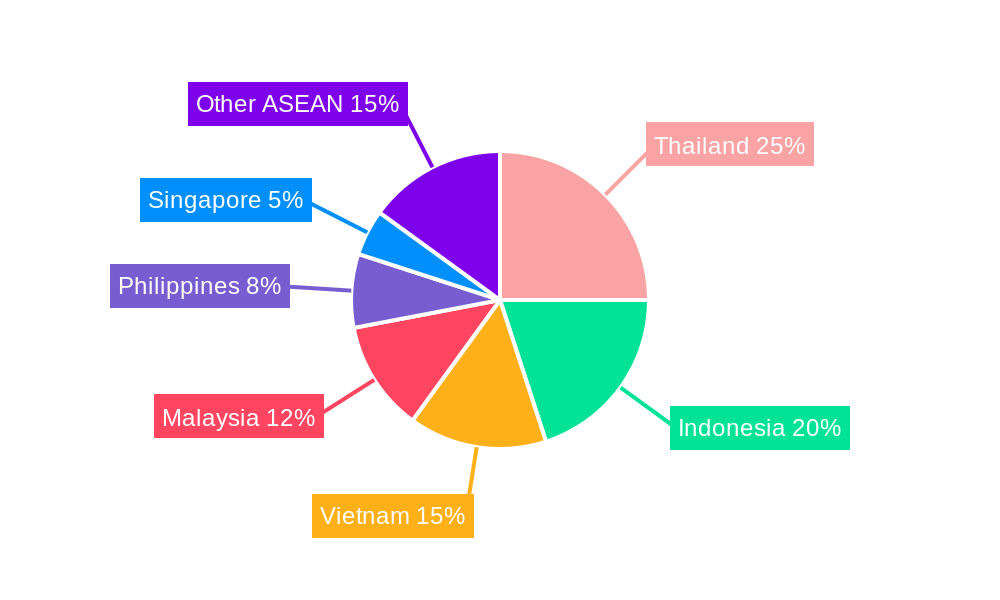
Thailand is currently the leading market for EV battery packs in ASEAN, driven by government initiatives promoting EV adoption and a well-established automotive industry. Within the segment breakdown:
- Body Type: Passenger cars currently dominate, followed by LCVs. Buses and M&HDTs are expected to see significant growth.
- Battery Chemistry: LFP chemistry is gaining traction due to its cost-effectiveness and safety features, while NMC and NCA chemistries are preferred for higher energy density applications.
- Material Type: Demand for Lithium, Nickel, and Cobalt is high, driving material price fluctuations.
- Propulsion Type: BEVs are the most popular, but PHEVs are also gaining traction.
- Capacity: The 40 kWh to 80 kWh capacity segment holds the largest market share, while the above 80 kWh segment is growing rapidly.
- Battery Form: Prismatic cells are widely used due to their high energy density and packaging flexibility.
Key drivers for the dominance of Thailand include:
- Favorable government policies and incentives for EV adoption.
- Well-developed automotive manufacturing base and supply chain.
- Growing consumer demand for electric vehicles.
ASEAN EV Battery Pack Market Product Developments
Recent innovations include the development of solid-state batteries, offering enhanced safety and energy density. Improved thermal management systems and battery management systems (BMS) are improving performance and lifespan. The market is also witnessing the adoption of more sustainable materials and manufacturing processes, addressing environmental concerns. These advancements are leading to increased adoption across various vehicle types and applications, improving the overall market fit and competitive landscape.
Key Drivers of ASEAN EV Battery Pack Market Growth
Several factors are driving the growth of the ASEAN EV battery pack market:
- Government Regulations: Supportive policies like tax incentives and emission standards are crucial in boosting EV adoption.
- Technological Advancements: Improvements in battery technology result in increased energy density, longer lifespans, and reduced costs.
- Economic Growth: Rising disposable incomes are fueling demand for EVs among consumers.
- Infrastructure Development: Investment in charging infrastructure is crucial for expanding EV adoption rates.
Challenges in the ASEAN EV Battery Pack Market Market
Challenges include:
- Raw Material Prices: Fluctuations in lithium, cobalt, and nickel prices increase production costs.
- Supply Chain Disruptions: Geopolitical instability and pandemic-related issues can impact the supply chain.
- Infrastructure Limitations: Insufficient charging infrastructure in some regions hinders wider adoption.
- High Initial Costs: EVs remain more expensive than internal combustion engine vehicles, limiting adoption among lower-income segments. The market faces a potential shortfall of xx Million units by 2030 due to these limitations.
Emerging Opportunities in ASEAN EV Battery Pack Market
Significant opportunities exist in:
- Development of next-generation battery technologies: Solid-state and sodium-ion batteries are emerging as key areas for innovation.
- Strategic partnerships: Collaborations between battery manufacturers, automakers, and energy companies can accelerate market expansion.
- Expansion into new markets: Untapped potential remains in less developed regions within ASEAN.
Leading Players in the ASEAN EV Battery Pack Market Sector
- Contemporary Amperex Technology Co Ltd (CATL)
- BYD Company Ltd
- LG Energy Solution Ltd
- Samsung SDI Co Ltd
- Denso Corporation
- Ningde E-CON Power System Co Ltd
- Guoxuan High-tech Co Ltd
- SVOLT Energy Technology Co Ltd (SVOLT)
- Deutsche ACCUmotive GmbH & Co KG
- SK Innovation Co Ltd
- Do-Fluoride (Jiaozuo) New Energy Technology
- Panasonic Holdings Corporation
Key Milestones in ASEAN EV Battery Pack Market Industry
- March 2023: CATL established a joint venture with FAW Jiefang Automotive Co., Ltd.
- March 2023: CATL signed a strategic cooperation agreement with BAIC Group.
- April 2023: CATL announced the launch of its sodium-ion battery in Chery models and the joint development of the ENER-Q battery brand.
Strategic Outlook for ASEAN EV Battery Pack Market Market
The ASEAN EV battery pack market is poised for significant growth in the coming years. Continued technological advancements, supportive government policies, and rising consumer demand will drive market expansion. Companies should focus on innovation, strategic partnerships, and efficient supply chain management to capitalize on emerging opportunities. The market presents attractive prospects for both established players and new entrants, with significant potential for growth across various segments and geographies.
ASEAN EV Battery Pack Market Segmentation
-
1. Body Type
- 1.1. Bus
- 1.2. LCV
- 1.3. M&HDT
- 1.4. Passenger Car
-
2. Propulsion Type
- 2.1. BEV
- 2.2. PHEV
-
3. Battery Chemistry
- 3.1. LFP
- 3.2. NCA
- 3.3. NCM
- 3.4. NMC
-
4. Capacity
- 4.1. 15 kWh to 40 kWh
- 4.2. 40 kWh to 80 kWh
- 4.3. Above 80 kWh
- 4.4. Less than 15 kWh
-
5. Battery Form
- 5.1. Cylindrical
- 5.2. Pouch
- 5.3. Prismatic
-
6. Method
- 6.1. Laser
- 6.2. Wire
-
7. Component
- 7.1. Anode
- 7.2. Cathode
- 7.3. Electrolyte
- 7.4. Separator
-
8. Material Type
- 8.1. Cobalt
- 8.2. Lithium
- 8.3. Manganese
- 8.4. Natural Graphite
- 8.5. Nickel
- 8.6. Other Materials
ASEAN EV Battery Pack Market Segmentation By Geography
-
1. North America
- 1.1. United States
- 1.2. Canada
- 1.3. Mexico
-
2. South America
- 2.1. Brazil
- 2.2. Argentina
- 2.3. Rest of South America
-
3. Europe
- 3.1. United Kingdom
- 3.2. Germany
- 3.3. France
- 3.4. Italy
- 3.5. Spain
- 3.6. Russia
- 3.7. Benelux
- 3.8. Nordics
- 3.9. Rest of Europe
-
4. Middle East & Africa
- 4.1. Turkey
- 4.2. Israel
- 4.3. GCC
- 4.4. North Africa
- 4.5. South Africa
- 4.6. Rest of Middle East & Africa
-
5. Asia Pacific
- 5.1. China
- 5.2. India
- 5.3. Japan
- 5.4. South Korea
- 5.5. ASEAN
- 5.6. Oceania
- 5.7. Rest of Asia Pacific
ASEAN EV Battery Pack Market REPORT HIGHLIGHTS
| Aspects | Details |
|---|---|
| Study Period | 2019-2033 |
| Base Year | 2024 |
| Estimated Year | 2025 |
| Forecast Period | 2025-2033 |
| Historical Period | 2019-2024 |
| Growth Rate | CAGR of 13.50% from 2019-2033 |
| Segmentation |
|
Table of Contents
- 1. Introduction
- 1.1. Research Scope
- 1.2. Market Segmentation
- 1.3. Research Methodology
- 1.4. Definitions and Assumptions
- 2. Executive Summary
- 2.1. Introduction
- 3. Market Dynamics
- 3.1. Introduction
- 3.2. Market Drivers
- 3.2.1. Governments worldwide are implementing strict regulations and providing incentives to promote the adoption of electric vehicles; Others
- 3.3. Market Restrains
- 3.3.1. High Initial Costs; Others
- 3.4. Market Trends
- 3.4.1. OTHER KEY INDUSTRY TRENDS COVERED IN THE REPORT
- 4. Market Factor Analysis
- 4.1. Porters Five Forces
- 4.2. Supply/Value Chain
- 4.3. PESTEL analysis
- 4.4. Market Entropy
- 4.5. Patent/Trademark Analysis
- 5. Global ASEAN EV Battery Pack Market Analysis, Insights and Forecast, 2019-2031
- 5.1. Market Analysis, Insights and Forecast - by Body Type
- 5.1.1. Bus
- 5.1.2. LCV
- 5.1.3. M&HDT
- 5.1.4. Passenger Car
- 5.2. Market Analysis, Insights and Forecast - by Propulsion Type
- 5.2.1. BEV
- 5.2.2. PHEV
- 5.3. Market Analysis, Insights and Forecast - by Battery Chemistry
- 5.3.1. LFP
- 5.3.2. NCA
- 5.3.3. NCM
- 5.3.4. NMC
- 5.4. Market Analysis, Insights and Forecast - by Capacity
- 5.4.1. 15 kWh to 40 kWh
- 5.4.2. 40 kWh to 80 kWh
- 5.4.3. Above 80 kWh
- 5.4.4. Less than 15 kWh
- 5.5. Market Analysis, Insights and Forecast - by Battery Form
- 5.5.1. Cylindrical
- 5.5.2. Pouch
- 5.5.3. Prismatic
- 5.6. Market Analysis, Insights and Forecast - by Method
- 5.6.1. Laser
- 5.6.2. Wire
- 5.7. Market Analysis, Insights and Forecast - by Component
- 5.7.1. Anode
- 5.7.2. Cathode
- 5.7.3. Electrolyte
- 5.7.4. Separator
- 5.8. Market Analysis, Insights and Forecast - by Material Type
- 5.8.1. Cobalt
- 5.8.2. Lithium
- 5.8.3. Manganese
- 5.8.4. Natural Graphite
- 5.8.5. Nickel
- 5.8.6. Other Materials
- 5.9. Market Analysis, Insights and Forecast - by Region
- 5.9.1. North America
- 5.9.2. South America
- 5.9.3. Europe
- 5.9.4. Middle East & Africa
- 5.9.5. Asia Pacific
- 5.1. Market Analysis, Insights and Forecast - by Body Type
- 6. North America ASEAN EV Battery Pack Market Analysis, Insights and Forecast, 2019-2031
- 6.1. Market Analysis, Insights and Forecast - by Body Type
- 6.1.1. Bus
- 6.1.2. LCV
- 6.1.3. M&HDT
- 6.1.4. Passenger Car
- 6.2. Market Analysis, Insights and Forecast - by Propulsion Type
- 6.2.1. BEV
- 6.2.2. PHEV
- 6.3. Market Analysis, Insights and Forecast - by Battery Chemistry
- 6.3.1. LFP
- 6.3.2. NCA
- 6.3.3. NCM
- 6.3.4. NMC
- 6.4. Market Analysis, Insights and Forecast - by Capacity
- 6.4.1. 15 kWh to 40 kWh
- 6.4.2. 40 kWh to 80 kWh
- 6.4.3. Above 80 kWh
- 6.4.4. Less than 15 kWh
- 6.5. Market Analysis, Insights and Forecast - by Battery Form
- 6.5.1. Cylindrical
- 6.5.2. Pouch
- 6.5.3. Prismatic
- 6.6. Market Analysis, Insights and Forecast - by Method
- 6.6.1. Laser
- 6.6.2. Wire
- 6.7. Market Analysis, Insights and Forecast - by Component
- 6.7.1. Anode
- 6.7.2. Cathode
- 6.7.3. Electrolyte
- 6.7.4. Separator
- 6.8. Market Analysis, Insights and Forecast - by Material Type
- 6.8.1. Cobalt
- 6.8.2. Lithium
- 6.8.3. Manganese
- 6.8.4. Natural Graphite
- 6.8.5. Nickel
- 6.8.6. Other Materials
- 6.1. Market Analysis, Insights and Forecast - by Body Type
- 7. South America ASEAN EV Battery Pack Market Analysis, Insights and Forecast, 2019-2031
- 7.1. Market Analysis, Insights and Forecast - by Body Type
- 7.1.1. Bus
- 7.1.2. LCV
- 7.1.3. M&HDT
- 7.1.4. Passenger Car
- 7.2. Market Analysis, Insights and Forecast - by Propulsion Type
- 7.2.1. BEV
- 7.2.2. PHEV
- 7.3. Market Analysis, Insights and Forecast - by Battery Chemistry
- 7.3.1. LFP
- 7.3.2. NCA
- 7.3.3. NCM
- 7.3.4. NMC
- 7.4. Market Analysis, Insights and Forecast - by Capacity
- 7.4.1. 15 kWh to 40 kWh
- 7.4.2. 40 kWh to 80 kWh
- 7.4.3. Above 80 kWh
- 7.4.4. Less than 15 kWh
- 7.5. Market Analysis, Insights and Forecast - by Battery Form
- 7.5.1. Cylindrical
- 7.5.2. Pouch
- 7.5.3. Prismatic
- 7.6. Market Analysis, Insights and Forecast - by Method
- 7.6.1. Laser
- 7.6.2. Wire
- 7.7. Market Analysis, Insights and Forecast - by Component
- 7.7.1. Anode
- 7.7.2. Cathode
- 7.7.3. Electrolyte
- 7.7.4. Separator
- 7.8. Market Analysis, Insights and Forecast - by Material Type
- 7.8.1. Cobalt
- 7.8.2. Lithium
- 7.8.3. Manganese
- 7.8.4. Natural Graphite
- 7.8.5. Nickel
- 7.8.6. Other Materials
- 7.1. Market Analysis, Insights and Forecast - by Body Type
- 8. Europe ASEAN EV Battery Pack Market Analysis, Insights and Forecast, 2019-2031
- 8.1. Market Analysis, Insights and Forecast - by Body Type
- 8.1.1. Bus
- 8.1.2. LCV
- 8.1.3. M&HDT
- 8.1.4. Passenger Car
- 8.2. Market Analysis, Insights and Forecast - by Propulsion Type
- 8.2.1. BEV
- 8.2.2. PHEV
- 8.3. Market Analysis, Insights and Forecast - by Battery Chemistry
- 8.3.1. LFP
- 8.3.2. NCA
- 8.3.3. NCM
- 8.3.4. NMC
- 8.4. Market Analysis, Insights and Forecast - by Capacity
- 8.4.1. 15 kWh to 40 kWh
- 8.4.2. 40 kWh to 80 kWh
- 8.4.3. Above 80 kWh
- 8.4.4. Less than 15 kWh
- 8.5. Market Analysis, Insights and Forecast - by Battery Form
- 8.5.1. Cylindrical
- 8.5.2. Pouch
- 8.5.3. Prismatic
- 8.6. Market Analysis, Insights and Forecast - by Method
- 8.6.1. Laser
- 8.6.2. Wire
- 8.7. Market Analysis, Insights and Forecast - by Component
- 8.7.1. Anode
- 8.7.2. Cathode
- 8.7.3. Electrolyte
- 8.7.4. Separator
- 8.8. Market Analysis, Insights and Forecast - by Material Type
- 8.8.1. Cobalt
- 8.8.2. Lithium
- 8.8.3. Manganese
- 8.8.4. Natural Graphite
- 8.8.5. Nickel
- 8.8.6. Other Materials
- 8.1. Market Analysis, Insights and Forecast - by Body Type
- 9. Middle East & Africa ASEAN EV Battery Pack Market Analysis, Insights and Forecast, 2019-2031
- 9.1. Market Analysis, Insights and Forecast - by Body Type
- 9.1.1. Bus
- 9.1.2. LCV
- 9.1.3. M&HDT
- 9.1.4. Passenger Car
- 9.2. Market Analysis, Insights and Forecast - by Propulsion Type
- 9.2.1. BEV
- 9.2.2. PHEV
- 9.3. Market Analysis, Insights and Forecast - by Battery Chemistry
- 9.3.1. LFP
- 9.3.2. NCA
- 9.3.3. NCM
- 9.3.4. NMC
- 9.4. Market Analysis, Insights and Forecast - by Capacity
- 9.4.1. 15 kWh to 40 kWh
- 9.4.2. 40 kWh to 80 kWh
- 9.4.3. Above 80 kWh
- 9.4.4. Less than 15 kWh
- 9.5. Market Analysis, Insights and Forecast - by Battery Form
- 9.5.1. Cylindrical
- 9.5.2. Pouch
- 9.5.3. Prismatic
- 9.6. Market Analysis, Insights and Forecast - by Method
- 9.6.1. Laser
- 9.6.2. Wire
- 9.7. Market Analysis, Insights and Forecast - by Component
- 9.7.1. Anode
- 9.7.2. Cathode
- 9.7.3. Electrolyte
- 9.7.4. Separator
- 9.8. Market Analysis, Insights and Forecast - by Material Type
- 9.8.1. Cobalt
- 9.8.2. Lithium
- 9.8.3. Manganese
- 9.8.4. Natural Graphite
- 9.8.5. Nickel
- 9.8.6. Other Materials
- 9.1. Market Analysis, Insights and Forecast - by Body Type
- 10. Asia Pacific ASEAN EV Battery Pack Market Analysis, Insights and Forecast, 2019-2031
- 10.1. Market Analysis, Insights and Forecast - by Body Type
- 10.1.1. Bus
- 10.1.2. LCV
- 10.1.3. M&HDT
- 10.1.4. Passenger Car
- 10.2. Market Analysis, Insights and Forecast - by Propulsion Type
- 10.2.1. BEV
- 10.2.2. PHEV
- 10.3. Market Analysis, Insights and Forecast - by Battery Chemistry
- 10.3.1. LFP
- 10.3.2. NCA
- 10.3.3. NCM
- 10.3.4. NMC
- 10.4. Market Analysis, Insights and Forecast - by Capacity
- 10.4.1. 15 kWh to 40 kWh
- 10.4.2. 40 kWh to 80 kWh
- 10.4.3. Above 80 kWh
- 10.4.4. Less than 15 kWh
- 10.5. Market Analysis, Insights and Forecast - by Battery Form
- 10.5.1. Cylindrical
- 10.5.2. Pouch
- 10.5.3. Prismatic
- 10.6. Market Analysis, Insights and Forecast - by Method
- 10.6.1. Laser
- 10.6.2. Wire
- 10.7. Market Analysis, Insights and Forecast - by Component
- 10.7.1. Anode
- 10.7.2. Cathode
- 10.7.3. Electrolyte
- 10.7.4. Separator
- 10.8. Market Analysis, Insights and Forecast - by Material Type
- 10.8.1. Cobalt
- 10.8.2. Lithium
- 10.8.3. Manganese
- 10.8.4. Natural Graphite
- 10.8.5. Nickel
- 10.8.6. Other Materials
- 10.1. Market Analysis, Insights and Forecast - by Body Type
- 11. North America ASEAN EV Battery Pack Market Analysis, Insights and Forecast, 2019-2031
- 11.1. Market Analysis, Insights and Forecast - By Country/Sub-region
- 11.1.1 United States
- 11.1.2 Canada
- 11.1.3 Mexico
- 11.1.4 Rest of North America
- 12. Europe ASEAN EV Battery Pack Market Analysis, Insights and Forecast, 2019-2031
- 12.1. Market Analysis, Insights and Forecast - By Country/Sub-region
- 12.1.1 Germany
- 12.1.2 United Kingdom
- 12.1.3 France
- 12.1.4 Italy
- 12.1.5 Rest of Europe
- 13. Asia Pacific ASEAN EV Battery Pack Market Analysis, Insights and Forecast, 2019-2031
- 13.1. Market Analysis, Insights and Forecast - By Country/Sub-region
- 13.1.1 China
- 13.1.2 Japan
- 13.1.3 India
- 13.1.4 Australia
- 13.1.5 Rest of Asia Pacific
- 14. South America ASEAN EV Battery Pack Market Analysis, Insights and Forecast, 2019-2031
- 14.1. Market Analysis, Insights and Forecast - By Country/Sub-region
- 14.1.1 Brazil
- 14.1.2 Argentina
- 14.1.3 Rest of South America
- 15. Middle East and Africa ASEAN EV Battery Pack Market Analysis, Insights and Forecast, 2019-2031
- 15.1. Market Analysis, Insights and Forecast - By Country/Sub-region
- 15.1.1 United Arab Emirates
- 15.1.2 Saudi Arabia
- 15.1.3 Rest of Middle East and Africa
- 16. Competitive Analysis
- 16.1. Global Market Share Analysis 2024
- 16.2. Company Profiles
- 16.2.1 Ningde E-CON Power System Co Ltd
- 16.2.1.1. Overview
- 16.2.1.2. Products
- 16.2.1.3. SWOT Analysis
- 16.2.1.4. Recent Developments
- 16.2.1.5. Financials (Based on Availability)
- 16.2.2 Denso Corporation
- 16.2.2.1. Overview
- 16.2.2.2. Products
- 16.2.2.3. SWOT Analysis
- 16.2.2.4. Recent Developments
- 16.2.2.5. Financials (Based on Availability)
- 16.2.3 Samsung SDI Co Ltd
- 16.2.3.1. Overview
- 16.2.3.2. Products
- 16.2.3.3. SWOT Analysis
- 16.2.3.4. Recent Developments
- 16.2.3.5. Financials (Based on Availability)
- 16.2.4 LG Energy Solution Ltd
- 16.2.4.1. Overview
- 16.2.4.2. Products
- 16.2.4.3. SWOT Analysis
- 16.2.4.4. Recent Developments
- 16.2.4.5. Financials (Based on Availability)
- 16.2.5 Guoxuan High-tech Co Ltd
- 16.2.5.1. Overview
- 16.2.5.2. Products
- 16.2.5.3. SWOT Analysis
- 16.2.5.4. Recent Developments
- 16.2.5.5. Financials (Based on Availability)
- 16.2.6 SVOLT Energy Technology Co Ltd (SVOLT
- 16.2.6.1. Overview
- 16.2.6.2. Products
- 16.2.6.3. SWOT Analysis
- 16.2.6.4. Recent Developments
- 16.2.6.5. Financials (Based on Availability)
- 16.2.7 Deutsche ACCUmotive GmbH & Co KG
- 16.2.7.1. Overview
- 16.2.7.2. Products
- 16.2.7.3. SWOT Analysis
- 16.2.7.4. Recent Developments
- 16.2.7.5. Financials (Based on Availability)
- 16.2.8 Contemporary Amperex Technology Co Ltd (CATL)
- 16.2.8.1. Overview
- 16.2.8.2. Products
- 16.2.8.3. SWOT Analysis
- 16.2.8.4. Recent Developments
- 16.2.8.5. Financials (Based on Availability)
- 16.2.9 BYD Company Ltd
- 16.2.9.1. Overview
- 16.2.9.2. Products
- 16.2.9.3. SWOT Analysis
- 16.2.9.4. Recent Developments
- 16.2.9.5. Financials (Based on Availability)
- 16.2.10 SK Innovation Co Ltd
- 16.2.10.1. Overview
- 16.2.10.2. Products
- 16.2.10.3. SWOT Analysis
- 16.2.10.4. Recent Developments
- 16.2.10.5. Financials (Based on Availability)
- 16.2.11 Do-Fluoride (Jiaozuo) New Energy Technology
- 16.2.11.1. Overview
- 16.2.11.2. Products
- 16.2.11.3. SWOT Analysis
- 16.2.11.4. Recent Developments
- 16.2.11.5. Financials (Based on Availability)
- 16.2.12 Panasonic Holdings Corporation
- 16.2.12.1. Overview
- 16.2.12.2. Products
- 16.2.12.3. SWOT Analysis
- 16.2.12.4. Recent Developments
- 16.2.12.5. Financials (Based on Availability)
- 16.2.1 Ningde E-CON Power System Co Ltd
List of Figures
- Figure 1: Global ASEAN EV Battery Pack Market Revenue Breakdown (Million, %) by Region 2024 & 2032
- Figure 2: North America ASEAN EV Battery Pack Market Revenue (Million), by Country 2024 & 2032
- Figure 3: North America ASEAN EV Battery Pack Market Revenue Share (%), by Country 2024 & 2032
- Figure 4: Europe ASEAN EV Battery Pack Market Revenue (Million), by Country 2024 & 2032
- Figure 5: Europe ASEAN EV Battery Pack Market Revenue Share (%), by Country 2024 & 2032
- Figure 6: Asia Pacific ASEAN EV Battery Pack Market Revenue (Million), by Country 2024 & 2032
- Figure 7: Asia Pacific ASEAN EV Battery Pack Market Revenue Share (%), by Country 2024 & 2032
- Figure 8: South America ASEAN EV Battery Pack Market Revenue (Million), by Country 2024 & 2032
- Figure 9: South America ASEAN EV Battery Pack Market Revenue Share (%), by Country 2024 & 2032
- Figure 10: Middle East and Africa ASEAN EV Battery Pack Market Revenue (Million), by Country 2024 & 2032
- Figure 11: Middle East and Africa ASEAN EV Battery Pack Market Revenue Share (%), by Country 2024 & 2032
- Figure 12: North America ASEAN EV Battery Pack Market Revenue (Million), by Body Type 2024 & 2032
- Figure 13: North America ASEAN EV Battery Pack Market Revenue Share (%), by Body Type 2024 & 2032
- Figure 14: North America ASEAN EV Battery Pack Market Revenue (Million), by Propulsion Type 2024 & 2032
- Figure 15: North America ASEAN EV Battery Pack Market Revenue Share (%), by Propulsion Type 2024 & 2032
- Figure 16: North America ASEAN EV Battery Pack Market Revenue (Million), by Battery Chemistry 2024 & 2032
- Figure 17: North America ASEAN EV Battery Pack Market Revenue Share (%), by Battery Chemistry 2024 & 2032
- Figure 18: North America ASEAN EV Battery Pack Market Revenue (Million), by Capacity 2024 & 2032
- Figure 19: North America ASEAN EV Battery Pack Market Revenue Share (%), by Capacity 2024 & 2032
- Figure 20: North America ASEAN EV Battery Pack Market Revenue (Million), by Battery Form 2024 & 2032
- Figure 21: North America ASEAN EV Battery Pack Market Revenue Share (%), by Battery Form 2024 & 2032
- Figure 22: North America ASEAN EV Battery Pack Market Revenue (Million), by Method 2024 & 2032
- Figure 23: North America ASEAN EV Battery Pack Market Revenue Share (%), by Method 2024 & 2032
- Figure 24: North America ASEAN EV Battery Pack Market Revenue (Million), by Component 2024 & 2032
- Figure 25: North America ASEAN EV Battery Pack Market Revenue Share (%), by Component 2024 & 2032
- Figure 26: North America ASEAN EV Battery Pack Market Revenue (Million), by Material Type 2024 & 2032
- Figure 27: North America ASEAN EV Battery Pack Market Revenue Share (%), by Material Type 2024 & 2032
- Figure 28: North America ASEAN EV Battery Pack Market Revenue (Million), by Country 2024 & 2032
- Figure 29: North America ASEAN EV Battery Pack Market Revenue Share (%), by Country 2024 & 2032
- Figure 30: South America ASEAN EV Battery Pack Market Revenue (Million), by Body Type 2024 & 2032
- Figure 31: South America ASEAN EV Battery Pack Market Revenue Share (%), by Body Type 2024 & 2032
- Figure 32: South America ASEAN EV Battery Pack Market Revenue (Million), by Propulsion Type 2024 & 2032
- Figure 33: South America ASEAN EV Battery Pack Market Revenue Share (%), by Propulsion Type 2024 & 2032
- Figure 34: South America ASEAN EV Battery Pack Market Revenue (Million), by Battery Chemistry 2024 & 2032
- Figure 35: South America ASEAN EV Battery Pack Market Revenue Share (%), by Battery Chemistry 2024 & 2032
- Figure 36: South America ASEAN EV Battery Pack Market Revenue (Million), by Capacity 2024 & 2032
- Figure 37: South America ASEAN EV Battery Pack Market Revenue Share (%), by Capacity 2024 & 2032
- Figure 38: South America ASEAN EV Battery Pack Market Revenue (Million), by Battery Form 2024 & 2032
- Figure 39: South America ASEAN EV Battery Pack Market Revenue Share (%), by Battery Form 2024 & 2032
- Figure 40: South America ASEAN EV Battery Pack Market Revenue (Million), by Method 2024 & 2032
- Figure 41: South America ASEAN EV Battery Pack Market Revenue Share (%), by Method 2024 & 2032
- Figure 42: South America ASEAN EV Battery Pack Market Revenue (Million), by Component 2024 & 2032
- Figure 43: South America ASEAN EV Battery Pack Market Revenue Share (%), by Component 2024 & 2032
- Figure 44: South America ASEAN EV Battery Pack Market Revenue (Million), by Material Type 2024 & 2032
- Figure 45: South America ASEAN EV Battery Pack Market Revenue Share (%), by Material Type 2024 & 2032
- Figure 46: South America ASEAN EV Battery Pack Market Revenue (Million), by Country 2024 & 2032
- Figure 47: South America ASEAN EV Battery Pack Market Revenue Share (%), by Country 2024 & 2032
- Figure 48: Europe ASEAN EV Battery Pack Market Revenue (Million), by Body Type 2024 & 2032
- Figure 49: Europe ASEAN EV Battery Pack Market Revenue Share (%), by Body Type 2024 & 2032
- Figure 50: Europe ASEAN EV Battery Pack Market Revenue (Million), by Propulsion Type 2024 & 2032
- Figure 51: Europe ASEAN EV Battery Pack Market Revenue Share (%), by Propulsion Type 2024 & 2032
- Figure 52: Europe ASEAN EV Battery Pack Market Revenue (Million), by Battery Chemistry 2024 & 2032
- Figure 53: Europe ASEAN EV Battery Pack Market Revenue Share (%), by Battery Chemistry 2024 & 2032
- Figure 54: Europe ASEAN EV Battery Pack Market Revenue (Million), by Capacity 2024 & 2032
- Figure 55: Europe ASEAN EV Battery Pack Market Revenue Share (%), by Capacity 2024 & 2032
- Figure 56: Europe ASEAN EV Battery Pack Market Revenue (Million), by Battery Form 2024 & 2032
- Figure 57: Europe ASEAN EV Battery Pack Market Revenue Share (%), by Battery Form 2024 & 2032
- Figure 58: Europe ASEAN EV Battery Pack Market Revenue (Million), by Method 2024 & 2032
- Figure 59: Europe ASEAN EV Battery Pack Market Revenue Share (%), by Method 2024 & 2032
- Figure 60: Europe ASEAN EV Battery Pack Market Revenue (Million), by Component 2024 & 2032
- Figure 61: Europe ASEAN EV Battery Pack Market Revenue Share (%), by Component 2024 & 2032
- Figure 62: Europe ASEAN EV Battery Pack Market Revenue (Million), by Material Type 2024 & 2032
- Figure 63: Europe ASEAN EV Battery Pack Market Revenue Share (%), by Material Type 2024 & 2032
- Figure 64: Europe ASEAN EV Battery Pack Market Revenue (Million), by Country 2024 & 2032
- Figure 65: Europe ASEAN EV Battery Pack Market Revenue Share (%), by Country 2024 & 2032
- Figure 66: Middle East & Africa ASEAN EV Battery Pack Market Revenue (Million), by Body Type 2024 & 2032
- Figure 67: Middle East & Africa ASEAN EV Battery Pack Market Revenue Share (%), by Body Type 2024 & 2032
- Figure 68: Middle East & Africa ASEAN EV Battery Pack Market Revenue (Million), by Propulsion Type 2024 & 2032
- Figure 69: Middle East & Africa ASEAN EV Battery Pack Market Revenue Share (%), by Propulsion Type 2024 & 2032
- Figure 70: Middle East & Africa ASEAN EV Battery Pack Market Revenue (Million), by Battery Chemistry 2024 & 2032
- Figure 71: Middle East & Africa ASEAN EV Battery Pack Market Revenue Share (%), by Battery Chemistry 2024 & 2032
- Figure 72: Middle East & Africa ASEAN EV Battery Pack Market Revenue (Million), by Capacity 2024 & 2032
- Figure 73: Middle East & Africa ASEAN EV Battery Pack Market Revenue Share (%), by Capacity 2024 & 2032
- Figure 74: Middle East & Africa ASEAN EV Battery Pack Market Revenue (Million), by Battery Form 2024 & 2032
- Figure 75: Middle East & Africa ASEAN EV Battery Pack Market Revenue Share (%), by Battery Form 2024 & 2032
- Figure 76: Middle East & Africa ASEAN EV Battery Pack Market Revenue (Million), by Method 2024 & 2032
- Figure 77: Middle East & Africa ASEAN EV Battery Pack Market Revenue Share (%), by Method 2024 & 2032
- Figure 78: Middle East & Africa ASEAN EV Battery Pack Market Revenue (Million), by Component 2024 & 2032
- Figure 79: Middle East & Africa ASEAN EV Battery Pack Market Revenue Share (%), by Component 2024 & 2032
- Figure 80: Middle East & Africa ASEAN EV Battery Pack Market Revenue (Million), by Material Type 2024 & 2032
- Figure 81: Middle East & Africa ASEAN EV Battery Pack Market Revenue Share (%), by Material Type 2024 & 2032
- Figure 82: Middle East & Africa ASEAN EV Battery Pack Market Revenue (Million), by Country 2024 & 2032
- Figure 83: Middle East & Africa ASEAN EV Battery Pack Market Revenue Share (%), by Country 2024 & 2032
- Figure 84: Asia Pacific ASEAN EV Battery Pack Market Revenue (Million), by Body Type 2024 & 2032
- Figure 85: Asia Pacific ASEAN EV Battery Pack Market Revenue Share (%), by Body Type 2024 & 2032
- Figure 86: Asia Pacific ASEAN EV Battery Pack Market Revenue (Million), by Propulsion Type 2024 & 2032
- Figure 87: Asia Pacific ASEAN EV Battery Pack Market Revenue Share (%), by Propulsion Type 2024 & 2032
- Figure 88: Asia Pacific ASEAN EV Battery Pack Market Revenue (Million), by Battery Chemistry 2024 & 2032
- Figure 89: Asia Pacific ASEAN EV Battery Pack Market Revenue Share (%), by Battery Chemistry 2024 & 2032
- Figure 90: Asia Pacific ASEAN EV Battery Pack Market Revenue (Million), by Capacity 2024 & 2032
- Figure 91: Asia Pacific ASEAN EV Battery Pack Market Revenue Share (%), by Capacity 2024 & 2032
- Figure 92: Asia Pacific ASEAN EV Battery Pack Market Revenue (Million), by Battery Form 2024 & 2032
- Figure 93: Asia Pacific ASEAN EV Battery Pack Market Revenue Share (%), by Battery Form 2024 & 2032
- Figure 94: Asia Pacific ASEAN EV Battery Pack Market Revenue (Million), by Method 2024 & 2032
- Figure 95: Asia Pacific ASEAN EV Battery Pack Market Revenue Share (%), by Method 2024 & 2032
- Figure 96: Asia Pacific ASEAN EV Battery Pack Market Revenue (Million), by Component 2024 & 2032
- Figure 97: Asia Pacific ASEAN EV Battery Pack Market Revenue Share (%), by Component 2024 & 2032
- Figure 98: Asia Pacific ASEAN EV Battery Pack Market Revenue (Million), by Material Type 2024 & 2032
- Figure 99: Asia Pacific ASEAN EV Battery Pack Market Revenue Share (%), by Material Type 2024 & 2032
- Figure 100: Asia Pacific ASEAN EV Battery Pack Market Revenue (Million), by Country 2024 & 2032
- Figure 101: Asia Pacific ASEAN EV Battery Pack Market Revenue Share (%), by Country 2024 & 2032
List of Tables
- Table 1: Global ASEAN EV Battery Pack Market Revenue Million Forecast, by Region 2019 & 2032
- Table 2: Global ASEAN EV Battery Pack Market Revenue Million Forecast, by Body Type 2019 & 2032
- Table 3: Global ASEAN EV Battery Pack Market Revenue Million Forecast, by Propulsion Type 2019 & 2032
- Table 4: Global ASEAN EV Battery Pack Market Revenue Million Forecast, by Battery Chemistry 2019 & 2032
- Table 5: Global ASEAN EV Battery Pack Market Revenue Million Forecast, by Capacity 2019 & 2032
- Table 6: Global ASEAN EV Battery Pack Market Revenue Million Forecast, by Battery Form 2019 & 2032
- Table 7: Global ASEAN EV Battery Pack Market Revenue Million Forecast, by Method 2019 & 2032
- Table 8: Global ASEAN EV Battery Pack Market Revenue Million Forecast, by Component 2019 & 2032
- Table 9: Global ASEAN EV Battery Pack Market Revenue Million Forecast, by Material Type 2019 & 2032
- Table 10: Global ASEAN EV Battery Pack Market Revenue Million Forecast, by Region 2019 & 2032
- Table 11: Global ASEAN EV Battery Pack Market Revenue Million Forecast, by Country 2019 & 2032
- Table 12: United States ASEAN EV Battery Pack Market Revenue (Million) Forecast, by Application 2019 & 2032
- Table 13: Canada ASEAN EV Battery Pack Market Revenue (Million) Forecast, by Application 2019 & 2032
- Table 14: Mexico ASEAN EV Battery Pack Market Revenue (Million) Forecast, by Application 2019 & 2032
- Table 15: Rest of North America ASEAN EV Battery Pack Market Revenue (Million) Forecast, by Application 2019 & 2032
- Table 16: Global ASEAN EV Battery Pack Market Revenue Million Forecast, by Country 2019 & 2032
- Table 17: Germany ASEAN EV Battery Pack Market Revenue (Million) Forecast, by Application 2019 & 2032
- Table 18: United Kingdom ASEAN EV Battery Pack Market Revenue (Million) Forecast, by Application 2019 & 2032
- Table 19: France ASEAN EV Battery Pack Market Revenue (Million) Forecast, by Application 2019 & 2032
- Table 20: Italy ASEAN EV Battery Pack Market Revenue (Million) Forecast, by Application 2019 & 2032
- Table 21: Rest of Europe ASEAN EV Battery Pack Market Revenue (Million) Forecast, by Application 2019 & 2032
- Table 22: Global ASEAN EV Battery Pack Market Revenue Million Forecast, by Country 2019 & 2032
- Table 23: China ASEAN EV Battery Pack Market Revenue (Million) Forecast, by Application 2019 & 2032
- Table 24: Japan ASEAN EV Battery Pack Market Revenue (Million) Forecast, by Application 2019 & 2032
- Table 25: India ASEAN EV Battery Pack Market Revenue (Million) Forecast, by Application 2019 & 2032
- Table 26: Australia ASEAN EV Battery Pack Market Revenue (Million) Forecast, by Application 2019 & 2032
- Table 27: Rest of Asia Pacific ASEAN EV Battery Pack Market Revenue (Million) Forecast, by Application 2019 & 2032
- Table 28: Global ASEAN EV Battery Pack Market Revenue Million Forecast, by Country 2019 & 2032
- Table 29: Brazil ASEAN EV Battery Pack Market Revenue (Million) Forecast, by Application 2019 & 2032
- Table 30: Argentina ASEAN EV Battery Pack Market Revenue (Million) Forecast, by Application 2019 & 2032
- Table 31: Rest of South America ASEAN EV Battery Pack Market Revenue (Million) Forecast, by Application 2019 & 2032
- Table 32: Global ASEAN EV Battery Pack Market Revenue Million Forecast, by Country 2019 & 2032
- Table 33: United Arab Emirates ASEAN EV Battery Pack Market Revenue (Million) Forecast, by Application 2019 & 2032
- Table 34: Saudi Arabia ASEAN EV Battery Pack Market Revenue (Million) Forecast, by Application 2019 & 2032
- Table 35: Rest of Middle East and Africa ASEAN EV Battery Pack Market Revenue (Million) Forecast, by Application 2019 & 2032
- Table 36: Global ASEAN EV Battery Pack Market Revenue Million Forecast, by Body Type 2019 & 2032
- Table 37: Global ASEAN EV Battery Pack Market Revenue Million Forecast, by Propulsion Type 2019 & 2032
- Table 38: Global ASEAN EV Battery Pack Market Revenue Million Forecast, by Battery Chemistry 2019 & 2032
- Table 39: Global ASEAN EV Battery Pack Market Revenue Million Forecast, by Capacity 2019 & 2032
- Table 40: Global ASEAN EV Battery Pack Market Revenue Million Forecast, by Battery Form 2019 & 2032
- Table 41: Global ASEAN EV Battery Pack Market Revenue Million Forecast, by Method 2019 & 2032
- Table 42: Global ASEAN EV Battery Pack Market Revenue Million Forecast, by Component 2019 & 2032
- Table 43: Global ASEAN EV Battery Pack Market Revenue Million Forecast, by Material Type 2019 & 2032
- Table 44: Global ASEAN EV Battery Pack Market Revenue Million Forecast, by Country 2019 & 2032
- Table 45: United States ASEAN EV Battery Pack Market Revenue (Million) Forecast, by Application 2019 & 2032
- Table 46: Canada ASEAN EV Battery Pack Market Revenue (Million) Forecast, by Application 2019 & 2032
- Table 47: Mexico ASEAN EV Battery Pack Market Revenue (Million) Forecast, by Application 2019 & 2032
- Table 48: Global ASEAN EV Battery Pack Market Revenue Million Forecast, by Body Type 2019 & 2032
- Table 49: Global ASEAN EV Battery Pack Market Revenue Million Forecast, by Propulsion Type 2019 & 2032
- Table 50: Global ASEAN EV Battery Pack Market Revenue Million Forecast, by Battery Chemistry 2019 & 2032
- Table 51: Global ASEAN EV Battery Pack Market Revenue Million Forecast, by Capacity 2019 & 2032
- Table 52: Global ASEAN EV Battery Pack Market Revenue Million Forecast, by Battery Form 2019 & 2032
- Table 53: Global ASEAN EV Battery Pack Market Revenue Million Forecast, by Method 2019 & 2032
- Table 54: Global ASEAN EV Battery Pack Market Revenue Million Forecast, by Component 2019 & 2032
- Table 55: Global ASEAN EV Battery Pack Market Revenue Million Forecast, by Material Type 2019 & 2032
- Table 56: Global ASEAN EV Battery Pack Market Revenue Million Forecast, by Country 2019 & 2032
- Table 57: Brazil ASEAN EV Battery Pack Market Revenue (Million) Forecast, by Application 2019 & 2032
- Table 58: Argentina ASEAN EV Battery Pack Market Revenue (Million) Forecast, by Application 2019 & 2032
- Table 59: Rest of South America ASEAN EV Battery Pack Market Revenue (Million) Forecast, by Application 2019 & 2032
- Table 60: Global ASEAN EV Battery Pack Market Revenue Million Forecast, by Body Type 2019 & 2032
- Table 61: Global ASEAN EV Battery Pack Market Revenue Million Forecast, by Propulsion Type 2019 & 2032
- Table 62: Global ASEAN EV Battery Pack Market Revenue Million Forecast, by Battery Chemistry 2019 & 2032
- Table 63: Global ASEAN EV Battery Pack Market Revenue Million Forecast, by Capacity 2019 & 2032
- Table 64: Global ASEAN EV Battery Pack Market Revenue Million Forecast, by Battery Form 2019 & 2032
- Table 65: Global ASEAN EV Battery Pack Market Revenue Million Forecast, by Method 2019 & 2032
- Table 66: Global ASEAN EV Battery Pack Market Revenue Million Forecast, by Component 2019 & 2032
- Table 67: Global ASEAN EV Battery Pack Market Revenue Million Forecast, by Material Type 2019 & 2032
- Table 68: Global ASEAN EV Battery Pack Market Revenue Million Forecast, by Country 2019 & 2032
- Table 69: United Kingdom ASEAN EV Battery Pack Market Revenue (Million) Forecast, by Application 2019 & 2032
- Table 70: Germany ASEAN EV Battery Pack Market Revenue (Million) Forecast, by Application 2019 & 2032
- Table 71: France ASEAN EV Battery Pack Market Revenue (Million) Forecast, by Application 2019 & 2032
- Table 72: Italy ASEAN EV Battery Pack Market Revenue (Million) Forecast, by Application 2019 & 2032
- Table 73: Spain ASEAN EV Battery Pack Market Revenue (Million) Forecast, by Application 2019 & 2032
- Table 74: Russia ASEAN EV Battery Pack Market Revenue (Million) Forecast, by Application 2019 & 2032
- Table 75: Benelux ASEAN EV Battery Pack Market Revenue (Million) Forecast, by Application 2019 & 2032
- Table 76: Nordics ASEAN EV Battery Pack Market Revenue (Million) Forecast, by Application 2019 & 2032
- Table 77: Rest of Europe ASEAN EV Battery Pack Market Revenue (Million) Forecast, by Application 2019 & 2032
- Table 78: Global ASEAN EV Battery Pack Market Revenue Million Forecast, by Body Type 2019 & 2032
- Table 79: Global ASEAN EV Battery Pack Market Revenue Million Forecast, by Propulsion Type 2019 & 2032
- Table 80: Global ASEAN EV Battery Pack Market Revenue Million Forecast, by Battery Chemistry 2019 & 2032
- Table 81: Global ASEAN EV Battery Pack Market Revenue Million Forecast, by Capacity 2019 & 2032
- Table 82: Global ASEAN EV Battery Pack Market Revenue Million Forecast, by Battery Form 2019 & 2032
- Table 83: Global ASEAN EV Battery Pack Market Revenue Million Forecast, by Method 2019 & 2032
- Table 84: Global ASEAN EV Battery Pack Market Revenue Million Forecast, by Component 2019 & 2032
- Table 85: Global ASEAN EV Battery Pack Market Revenue Million Forecast, by Material Type 2019 & 2032
- Table 86: Global ASEAN EV Battery Pack Market Revenue Million Forecast, by Country 2019 & 2032
- Table 87: Turkey ASEAN EV Battery Pack Market Revenue (Million) Forecast, by Application 2019 & 2032
- Table 88: Israel ASEAN EV Battery Pack Market Revenue (Million) Forecast, by Application 2019 & 2032
- Table 89: GCC ASEAN EV Battery Pack Market Revenue (Million) Forecast, by Application 2019 & 2032
- Table 90: North Africa ASEAN EV Battery Pack Market Revenue (Million) Forecast, by Application 2019 & 2032
- Table 91: South Africa ASEAN EV Battery Pack Market Revenue (Million) Forecast, by Application 2019 & 2032
- Table 92: Rest of Middle East & Africa ASEAN EV Battery Pack Market Revenue (Million) Forecast, by Application 2019 & 2032
- Table 93: Global ASEAN EV Battery Pack Market Revenue Million Forecast, by Body Type 2019 & 2032
- Table 94: Global ASEAN EV Battery Pack Market Revenue Million Forecast, by Propulsion Type 2019 & 2032
- Table 95: Global ASEAN EV Battery Pack Market Revenue Million Forecast, by Battery Chemistry 2019 & 2032
- Table 96: Global ASEAN EV Battery Pack Market Revenue Million Forecast, by Capacity 2019 & 2032
- Table 97: Global ASEAN EV Battery Pack Market Revenue Million Forecast, by Battery Form 2019 & 2032
- Table 98: Global ASEAN EV Battery Pack Market Revenue Million Forecast, by Method 2019 & 2032
- Table 99: Global ASEAN EV Battery Pack Market Revenue Million Forecast, by Component 2019 & 2032
- Table 100: Global ASEAN EV Battery Pack Market Revenue Million Forecast, by Material Type 2019 & 2032
- Table 101: Global ASEAN EV Battery Pack Market Revenue Million Forecast, by Country 2019 & 2032
- Table 102: China ASEAN EV Battery Pack Market Revenue (Million) Forecast, by Application 2019 & 2032
- Table 103: India ASEAN EV Battery Pack Market Revenue (Million) Forecast, by Application 2019 & 2032
- Table 104: Japan ASEAN EV Battery Pack Market Revenue (Million) Forecast, by Application 2019 & 2032
- Table 105: South Korea ASEAN EV Battery Pack Market Revenue (Million) Forecast, by Application 2019 & 2032
- Table 106: ASEAN ASEAN EV Battery Pack Market Revenue (Million) Forecast, by Application 2019 & 2032
- Table 107: Oceania ASEAN EV Battery Pack Market Revenue (Million) Forecast, by Application 2019 & 2032
- Table 108: Rest of Asia Pacific ASEAN EV Battery Pack Market Revenue (Million) Forecast, by Application 2019 & 2032
Frequently Asked Questions
1. What is the projected Compound Annual Growth Rate (CAGR) of the ASEAN EV Battery Pack Market?
The projected CAGR is approximately 13.50%.
2. Which companies are prominent players in the ASEAN EV Battery Pack Market?
Key companies in the market include Ningde E-CON Power System Co Ltd, Denso Corporation, Samsung SDI Co Ltd, LG Energy Solution Ltd, Guoxuan High-tech Co Ltd, SVOLT Energy Technology Co Ltd (SVOLT, Deutsche ACCUmotive GmbH & Co KG, Contemporary Amperex Technology Co Ltd (CATL), BYD Company Ltd, SK Innovation Co Ltd, Do-Fluoride (Jiaozuo) New Energy Technology, Panasonic Holdings Corporation.
3. What are the main segments of the ASEAN EV Battery Pack Market?
The market segments include Body Type, Propulsion Type, Battery Chemistry, Capacity, Battery Form, Method, Component, Material Type.
4. Can you provide details about the market size?
The market size is estimated to be USD XX Million as of 2022.
5. What are some drivers contributing to market growth?
Governments worldwide are implementing strict regulations and providing incentives to promote the adoption of electric vehicles; Others.
6. What are the notable trends driving market growth?
OTHER KEY INDUSTRY TRENDS COVERED IN THE REPORT.
7. Are there any restraints impacting market growth?
High Initial Costs; Others.
8. Can you provide examples of recent developments in the market?
April 2023: CATL announced that it will launch its sodium-ion battery in Chery models first. In addition, the two parties will jointly build the new ENER-Q battery brand, covering all application scenarios of all power types and all material systems.March 2023: Contemporary Amperex Technology Co., Ltd. (CATL) announced that it signed a strategic cooperation agreement on business cooperation and advanced technology development with Beijing Automotive Group Co., Ltd. (BAIC Group).March 2023: Contemporary Amperex Technology Co., Ltd. (CATL) announced that it has established a joint venture (JV) named Jiefang Shidai New Energy Technology Co., Ltd. with FAW Jiefang Automotive Co., Ltd. (FAW Jiefang). The JV has a registered capital of CNY 90 million, with CATL and FAW Jiefang each holding a 50% share.
9. What pricing options are available for accessing the report?
Pricing options include single-user, multi-user, and enterprise licenses priced at USD 3800, USD 4500, and USD 5800 respectively.
10. Is the market size provided in terms of value or volume?
The market size is provided in terms of value, measured in Million.
11. Are there any specific market keywords associated with the report?
Yes, the market keyword associated with the report is "ASEAN EV Battery Pack Market," which aids in identifying and referencing the specific market segment covered.
12. How do I determine which pricing option suits my needs best?
The pricing options vary based on user requirements and access needs. Individual users may opt for single-user licenses, while businesses requiring broader access may choose multi-user or enterprise licenses for cost-effective access to the report.
13. Are there any additional resources or data provided in the ASEAN EV Battery Pack Market report?
While the report offers comprehensive insights, it's advisable to review the specific contents or supplementary materials provided to ascertain if additional resources or data are available.
14. How can I stay updated on further developments or reports in the ASEAN EV Battery Pack Market?
To stay informed about further developments, trends, and reports in the ASEAN EV Battery Pack Market, consider subscribing to industry newsletters, following relevant companies and organizations, or regularly checking reputable industry news sources and publications.
Methodology
Step 1 - Identification of Relevant Samples Size from Population Database


Step 2 - Approaches for Defining Global Market Size (Value, Volume* & Price*)

Note*: In applicable scenarios
Step 3 - Data Sources
Primary Research
- Web Analytics
- Survey Reports
- Research Institute
- Latest Research Reports
- Opinion Leaders
Secondary Research
- Annual Reports
- White Paper
- Latest Press Release
- Industry Association
- Paid Database
- Investor Presentations

Step 4 - Data Triangulation
Involves using different sources of information in order to increase the validity of a study
These sources are likely to be stakeholders in a program - participants, other researchers, program staff, other community members, and so on.
Then we put all data in single framework & apply various statistical tools to find out the dynamic on the market.
During the analysis stage, feedback from the stakeholder groups would be compared to determine areas of agreement as well as areas of divergence
