

Key Insights
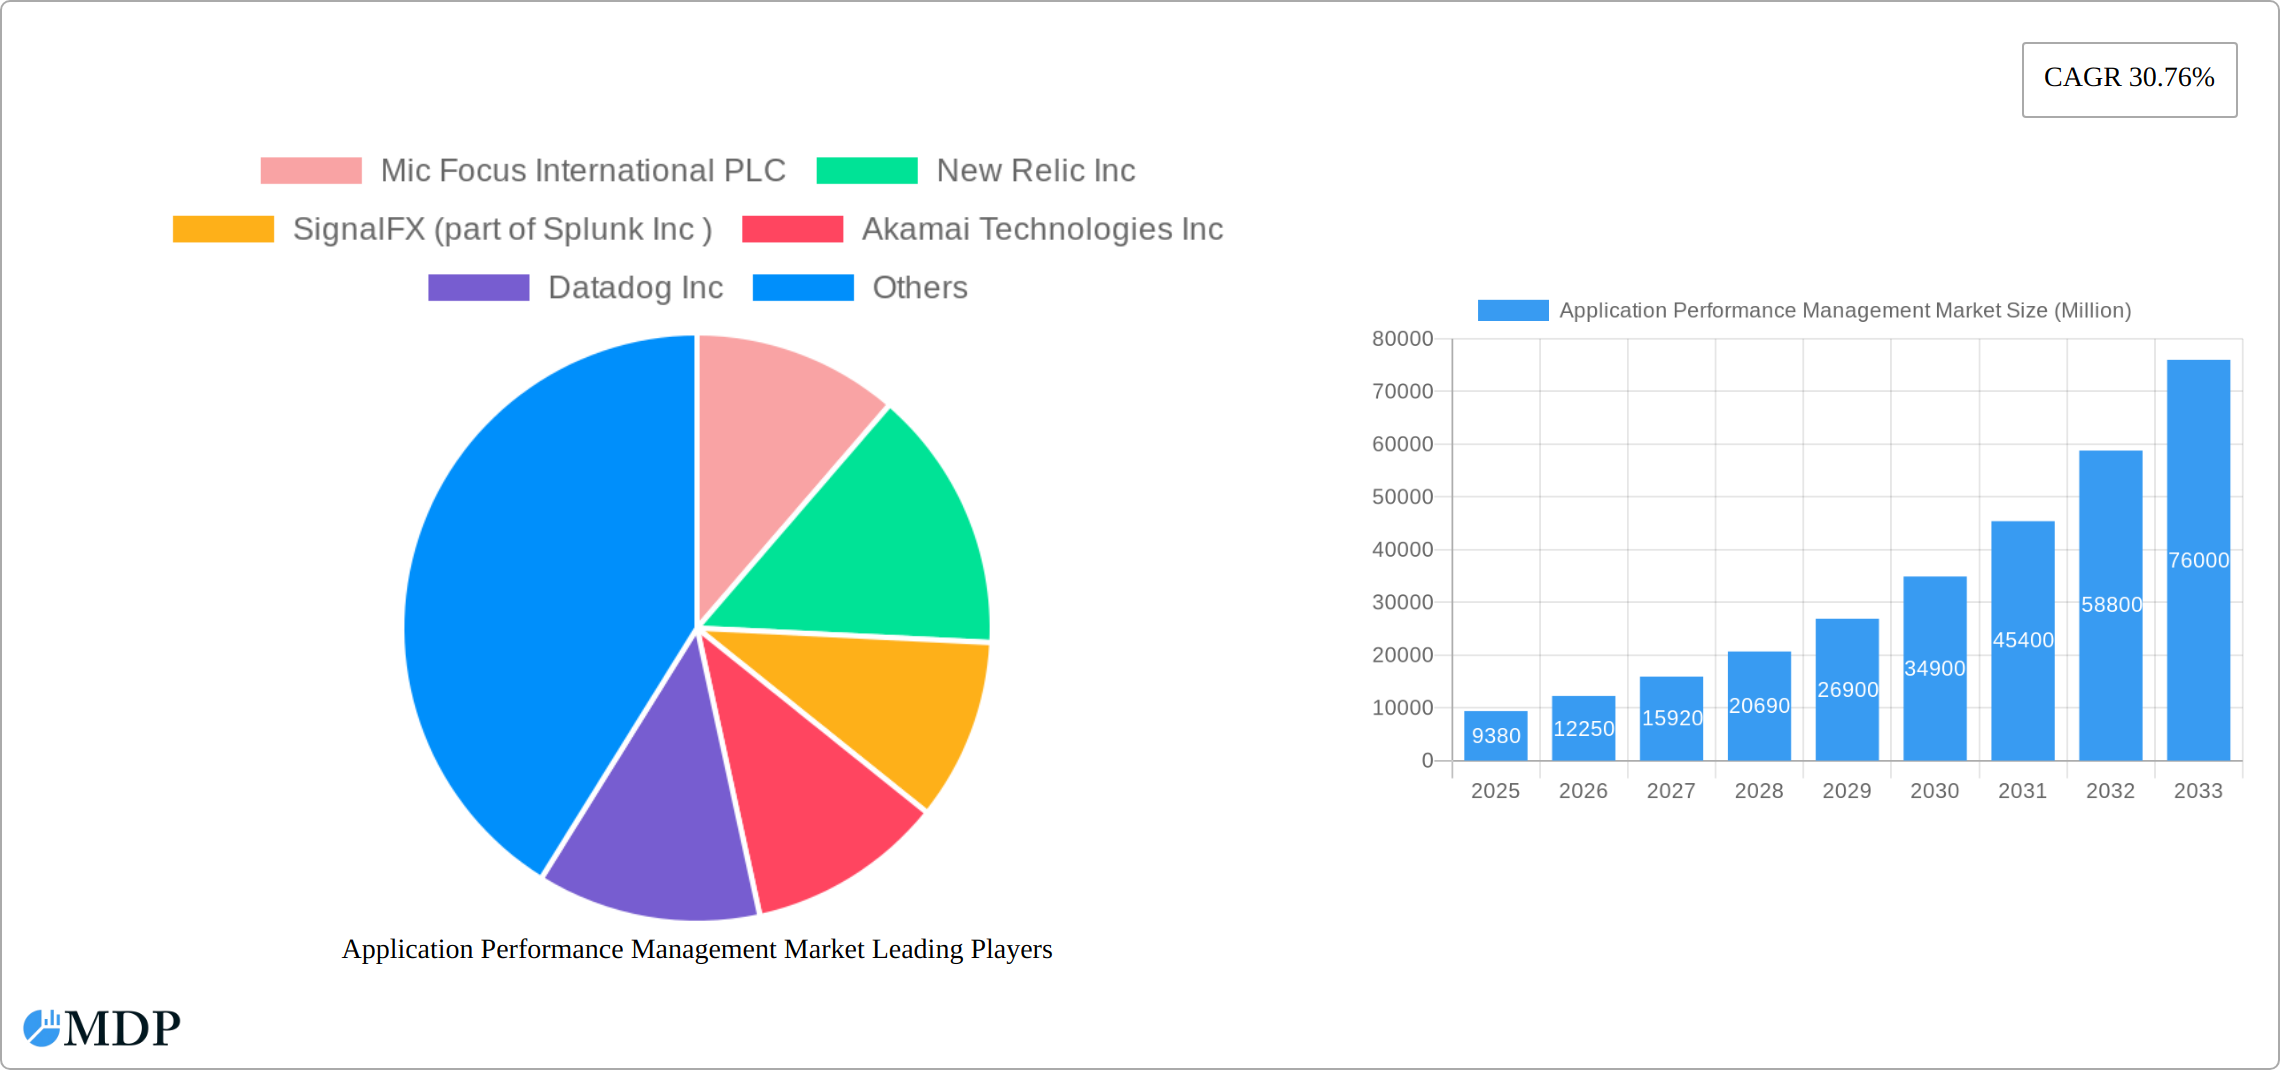
The Application Performance Management (APM) market is experiencing robust growth, projected to reach a market size of $9.38 billion in 2025 and exhibiting a Compound Annual Growth Rate (CAGR) of 30.76% from 2019 to 2033. This expansion is driven by several key factors. The increasing adoption of cloud-based applications and microservices architectures necessitates comprehensive monitoring and optimization solutions. Businesses are prioritizing digital transformation initiatives, leading to a surge in demand for APM tools to ensure the performance and availability of their critical applications. Furthermore, the rise of DevOps and Agile methodologies emphasizes continuous monitoring and faster incident resolution, further fueling the market's growth. The market is segmented by deployment (on-premise and cloud) and enterprise size (SMEs and large enterprises), with the cloud segment showing significant traction due to its scalability, flexibility, and cost-effectiveness. Competitive forces are driving innovation within the APM space, with major players like Datadog, Dynatrace, and Splunk (through SignalFX) constantly enhancing their offerings with advanced features like AI-powered analytics and automated remediation capabilities. Geographic growth is robust across North America, Europe, and Asia-Pacific, reflecting the global adoption of digital technologies.
The forecast period (2025-2033) anticipates continued strong growth, propelled by factors like the expanding Internet of Things (IoT) ecosystem generating massive data streams requiring efficient monitoring and the increasing focus on application security and compliance. However, challenges such as the complexity of integrating APM solutions across diverse IT landscapes and the need for skilled professionals to manage and interpret APM data could potentially restrain growth to some degree. Nevertheless, the overall market outlook remains exceptionally positive, driven by the ever-increasing reliance on applications for business operations and the continuous need to ensure optimal performance and user experience. The competitive landscape is dynamic, and future success will depend on players' ability to offer innovative solutions, strong customer support, and strategic partnerships.
Application Performance Management (APM) Market Report: 2019-2033 Forecast
This comprehensive report provides a detailed analysis of the Application Performance Management (APM) market, offering invaluable insights for industry stakeholders, investors, and businesses seeking to navigate this dynamic landscape. The report covers the period 2019-2033, with a base year of 2025 and a forecast period of 2025-2033. The market is segmented by deployment (on-premise, cloud) and enterprise size (small and medium enterprises, large enterprises), with key players including Mic Focus International PLC, New Relic Inc, SignalFX (part of Splunk Inc), Akamai Technologies Inc, Datadog Inc, Broadcom Inc, Microsoft Corporation, IBM Corp, AppDynamics LLC (Cisco Systems Inc), and Dynatrace LLC. The total market value is projected to reach xx Million by 2033, exhibiting a CAGR of xx%.
Application Performance Management Market Market Dynamics & Concentration
The Application Performance Management (APM) market exhibits a moderately concentrated landscape, with a few major players holding significant market share. However, the market is characterized by intense competition driven by continuous innovation and a growing need for efficient application monitoring solutions. Market concentration is influenced by factors such as M&A activities, which have seen xx deals in the past five years. This consolidation reflects the increasing strategic importance of APM in the broader digital transformation landscape. The market share of the top 5 players is estimated at xx%.
Innovation Drivers: The market is primarily driven by technological advancements such as AI-powered observability tools, cloud adoption, and the rise of DevOps and DevSecOps methodologies. These developments are leading to the emergence of sophisticated APM solutions capable of handling increasingly complex application environments.
Regulatory Frameworks: Compliance requirements, such as data privacy regulations (GDPR, CCPA), are driving demand for robust APM solutions with enhanced security features and data governance capabilities.
Product Substitutes: While APM solutions offer a specialized suite of features, alternatives like general-purpose monitoring tools and custom-built solutions exist. However, the specialized capabilities of APM solutions often outweigh the advantages of alternatives.
End-User Trends: The increasing adoption of cloud-native architectures, microservices, and serverless technologies is propelling the demand for APM solutions capable of monitoring and managing these dynamic environments.
M&A Activities: Recent M&A activity reflects consolidation trends in the market, creating larger entities with broader product portfolios and enhanced market reach. For example, the acquisition of SignalFX by Splunk Inc expanded Splunk’s APM capabilities significantly.
Application Performance Management Market Industry Trends & Analysis
The APM market is experiencing robust growth, driven by several key factors. The widespread adoption of cloud computing, increasing reliance on complex applications, and the growing importance of digital experience monitoring are major drivers. The shift towards microservices architectures and the need for real-time insights into application performance further fuels market expansion. The market penetration of APM solutions in various industry verticals is increasing at a steady rate. The projected CAGR for the forecast period is xx%, driven by the increasing adoption of cloud-based APM solutions and the growth of DevOps and DevSecOps practices. Technological disruptions, such as the integration of Artificial Intelligence (AI) and Machine Learning (ML) capabilities into APM platforms, are enhancing the capabilities of existing offerings and driving market expansion. Consumer preferences for seamless and high-performing digital experiences are putting significant pressure on businesses to implement robust APM solutions. The competitive landscape is marked by intense rivalry among established players and emerging newcomers, leading to continuous innovation and product differentiation.

Leading Markets & Segments in Application Performance Management Market
The North American region currently dominates the APM market, driven by high levels of technology adoption, a strong presence of key players, and a robust economy. However, the Asia-Pacific region is emerging as a significant growth market due to increasing digitalization and the growing adoption of cloud technologies.
Deployment: The Cloud segment holds the largest market share, driven by the increasing shift towards cloud-based infrastructure and applications. The on-premise segment is expected to remain present but experience slower growth compared to cloud-based solutions.
Enterprise Size: Large enterprises dominate the market, driven by their greater need for sophisticated APM solutions to manage their complex IT infrastructures. However, SMEs are increasingly adopting APM solutions as they recognize the importance of application performance for business success.
Key Drivers:
- North America: Strong IT infrastructure, high technology adoption rates, early adoption of cloud technologies.
- Asia-Pacific: Rapid digitalization, increasing internet penetration, significant investments in IT infrastructure.
- Europe: Stringent data privacy regulations, growing adoption of cloud computing, strong focus on digital transformation initiatives.
Application Performance Management Market Product Developments
Recent product innovations in the APM market have focused on enhancing observability capabilities, integrating AI/ML for intelligent insights, and improving security features. The integration of AI and ML allows for more proactive issue detection, predictive analysis, and automated remediation. Key technological trends include the shift towards AIOps (AI for IT operations) and the increased focus on security in APM solutions. These developments are improving the overall market fit of APM solutions by providing more efficient, insightful, and secure tools for managing application performance.
Key Drivers of Application Performance Management Market Growth
Several factors are driving the growth of the APM market. Technological advancements, such as AI-powered observability and the increasing adoption of cloud-based solutions, are key catalysts. Furthermore, economic factors such as the growing digitalization of businesses and the increasing reliance on software applications are fueling market expansion. Finally, regulatory compliance requirements related to data privacy and security further drive demand for robust and secure APM solutions.
Challenges in the Application Performance Management Market Market
The APM market faces several challenges, including the complexity of integrating APM solutions with existing IT infrastructure. This complexity can lead to higher implementation costs and extended deployment times. The high cost of premium APM solutions can also present a barrier to entry for smaller businesses. Additionally, intense competition among vendors can lead to price pressures and a need for constant innovation to stay ahead.
Emerging Opportunities in Application Performance Management Market
Emerging opportunities lie in the expansion into new markets (especially in developing economies), the development of specialized APM solutions for specific industry verticals, and the integration of APM with other IT management tools. Technological breakthroughs, such as advancements in AI and machine learning, are creating exciting opportunities for innovation. Strategic partnerships between APM vendors and other technology providers are creating synergies and expanding the reach of APM solutions.
Leading Players in the Application Performance Management Market Sector
- Mic Focus International PLC
- New Relic Inc
- SignalFX (part of Splunk Inc)
- Akamai Technologies Inc
- Datadog Inc
- Broadcom Inc
- Microsoft Corporation
- IBM Corp
- AppDynamics LLC (Cisco Systems Inc)
- Dynatrace LLC
Key Milestones in Application Performance Management Market Industry
May 2023: New Relic Inc. launched Grok, its AI-powered observability assistant, leveraging a large language model to streamline engineering tasks. This development significantly enhances the user experience and efficiency of New Relic's APM platform.
April 2023: Dynatrace Application Security received dual FedRAMP and StateRAMP authorizations, opening up significant opportunities in the public sector. This milestone enhances Dynatrace's market position and expands its addressable market.
Strategic Outlook for Application Performance Management Market Market
The future of the APM market is bright, with continued growth expected due to technological advancements, increasing adoption of cloud computing, and the growing demand for seamless digital experiences. Strategic opportunities lie in leveraging AI/ML capabilities to enhance observability, expanding into new industry verticals, and forging strategic partnerships to broaden market reach. The market is poised for further consolidation, with larger players likely to continue acquiring smaller companies to expand their product portfolios and enhance their competitive positions.
Application Performance Management Market Segmentation
-
1. Deployment
- 1.1. On-premise
- 1.2. Cloud
-
2. Enterprise Size
- 2.1. Small and Medium Enterprises
- 2.2. Large Enterprises
Application Performance Management Market Segmentation By Geography
- 1. North America
- 2. Europe
- 3. Asia
- 4. Australia and New Zealand
- 5. Latin America
- 6. Middle East and Africa

Application Performance Management Market REPORT HIGHLIGHTS
| Aspects | Details |
|---|---|
| Study Period | 2019-2033 |
| Base Year | 2024 |
| Estimated Year | 2025 |
| Forecast Period | 2025-2033 |
| Historical Period | 2019-2024 |
| Growth Rate | CAGR of 30.76% from 2019-2033 |
| Segmentation |
|
Table of Contents
- 1. Introduction
- 1.1. Research Scope
- 1.2. Market Segmentation
- 1.3. Research Methodology
- 1.4. Definitions and Assumptions
- 2. Executive Summary
- 2.1. Introduction
- 3. Market Dynamics
- 3.1. Introduction
- 3.2. Market Drivers
- 3.2.1. Increasing need for End-user satisfaction for successful Digital Business Operations
- 3.3. Market Restrains
- 3.3.1. Lack of Awareness About Intellectual Property Outsourcing
- 3.4. Market Trends
- 3.4.1. Adoption in Large Enterprises to Drive Market Growth
- 4. Market Factor Analysis
- 4.1. Porters Five Forces
- 4.2. Supply/Value Chain
- 4.3. PESTEL analysis
- 4.4. Market Entropy
- 4.5. Patent/Trademark Analysis
- 5. Global Application Performance Management Market Analysis, Insights and Forecast, 2019-2031
- 5.1. Market Analysis, Insights and Forecast - by Deployment
- 5.1.1. On-premise
- 5.1.2. Cloud
- 5.2. Market Analysis, Insights and Forecast - by Enterprise Size
- 5.2.1. Small and Medium Enterprises
- 5.2.2. Large Enterprises
- 5.3. Market Analysis, Insights and Forecast - by Region
- 5.3.1. North America
- 5.3.2. Europe
- 5.3.3. Asia
- 5.3.4. Australia and New Zealand
- 5.3.5. Latin America
- 5.3.6. Middle East and Africa
- 5.1. Market Analysis, Insights and Forecast - by Deployment
- 6. North America Application Performance Management Market Analysis, Insights and Forecast, 2019-2031
- 6.1. Market Analysis, Insights and Forecast - by Deployment
- 6.1.1. On-premise
- 6.1.2. Cloud
- 6.2. Market Analysis, Insights and Forecast - by Enterprise Size
- 6.2.1. Small and Medium Enterprises
- 6.2.2. Large Enterprises
- 6.1. Market Analysis, Insights and Forecast - by Deployment
- 7. Europe Application Performance Management Market Analysis, Insights and Forecast, 2019-2031
- 7.1. Market Analysis, Insights and Forecast - by Deployment
- 7.1.1. On-premise
- 7.1.2. Cloud
- 7.2. Market Analysis, Insights and Forecast - by Enterprise Size
- 7.2.1. Small and Medium Enterprises
- 7.2.2. Large Enterprises
- 7.1. Market Analysis, Insights and Forecast - by Deployment
- 8. Asia Application Performance Management Market Analysis, Insights and Forecast, 2019-2031
- 8.1. Market Analysis, Insights and Forecast - by Deployment
- 8.1.1. On-premise
- 8.1.2. Cloud
- 8.2. Market Analysis, Insights and Forecast - by Enterprise Size
- 8.2.1. Small and Medium Enterprises
- 8.2.2. Large Enterprises
- 8.1. Market Analysis, Insights and Forecast - by Deployment
- 9. Australia and New Zealand Application Performance Management Market Analysis, Insights and Forecast, 2019-2031
- 9.1. Market Analysis, Insights and Forecast - by Deployment
- 9.1.1. On-premise
- 9.1.2. Cloud
- 9.2. Market Analysis, Insights and Forecast - by Enterprise Size
- 9.2.1. Small and Medium Enterprises
- 9.2.2. Large Enterprises
- 9.1. Market Analysis, Insights and Forecast - by Deployment
- 10. Latin America Application Performance Management Market Analysis, Insights and Forecast, 2019-2031
- 10.1. Market Analysis, Insights and Forecast - by Deployment
- 10.1.1. On-premise
- 10.1.2. Cloud
- 10.2. Market Analysis, Insights and Forecast - by Enterprise Size
- 10.2.1. Small and Medium Enterprises
- 10.2.2. Large Enterprises
- 10.1. Market Analysis, Insights and Forecast - by Deployment
- 11. Middle East and Africa Application Performance Management Market Analysis, Insights and Forecast, 2019-2031
- 11.1. Market Analysis, Insights and Forecast - by Deployment
- 11.1.1. On-premise
- 11.1.2. Cloud
- 11.2. Market Analysis, Insights and Forecast - by Enterprise Size
- 11.2.1. Small and Medium Enterprises
- 11.2.2. Large Enterprises
- 11.1. Market Analysis, Insights and Forecast - by Deployment
- 12. North America Application Performance Management Market Analysis, Insights and Forecast, 2019-2031
- 12.1. Market Analysis, Insights and Forecast - By Country/Sub-region
- 12.1.1 United States
- 12.1.2 Canada
- 12.1.3 Mexico
- 13. Europe Application Performance Management Market Analysis, Insights and Forecast, 2019-2031
- 13.1. Market Analysis, Insights and Forecast - By Country/Sub-region
- 13.1.1 Germany
- 13.1.2 United Kingdom
- 13.1.3 France
- 13.1.4 Spain
- 13.1.5 Italy
- 13.1.6 Spain
- 13.1.7 Belgium
- 13.1.8 Netherland
- 13.1.9 Nordics
- 13.1.10 Rest of Europe
- 14. Asia Pacific Application Performance Management Market Analysis, Insights and Forecast, 2019-2031
- 14.1. Market Analysis, Insights and Forecast - By Country/Sub-region
- 14.1.1 China
- 14.1.2 Japan
- 14.1.3 India
- 14.1.4 South Korea
- 14.1.5 Southeast Asia
- 14.1.6 Australia
- 14.1.7 Indonesia
- 14.1.8 Phillipes
- 14.1.9 Singapore
- 14.1.10 Thailandc
- 14.1.11 Rest of Asia Pacific
- 15. South America Application Performance Management Market Analysis, Insights and Forecast, 2019-2031
- 15.1. Market Analysis, Insights and Forecast - By Country/Sub-region
- 15.1.1 Brazil
- 15.1.2 Argentina
- 15.1.3 Peru
- 15.1.4 Chile
- 15.1.5 Colombia
- 15.1.6 Ecuador
- 15.1.7 Venezuela
- 15.1.8 Rest of South America
- 16. MEA Application Performance Management Market Analysis, Insights and Forecast, 2019-2031
- 16.1. Market Analysis, Insights and Forecast - By Country/Sub-region
- 16.1.1 United Arab Emirates
- 16.1.2 Saudi Arabia
- 16.1.3 South Africa
- 16.1.4 Rest of Middle East and Africa
- 17. Competitive Analysis
- 17.1. Global Market Share Analysis 2024
- 17.2. Company Profiles
- 17.2.1 Mic Focus International PLC
- 17.2.1.1. Overview
- 17.2.1.2. Products
- 17.2.1.3. SWOT Analysis
- 17.2.1.4. Recent Developments
- 17.2.1.5. Financials (Based on Availability)
- 17.2.2 New Relic Inc
- 17.2.2.1. Overview
- 17.2.2.2. Products
- 17.2.2.3. SWOT Analysis
- 17.2.2.4. Recent Developments
- 17.2.2.5. Financials (Based on Availability)
- 17.2.3 SignalFX (part of Splunk Inc )
- 17.2.3.1. Overview
- 17.2.3.2. Products
- 17.2.3.3. SWOT Analysis
- 17.2.3.4. Recent Developments
- 17.2.3.5. Financials (Based on Availability)
- 17.2.4 Akamai Technologies Inc
- 17.2.4.1. Overview
- 17.2.4.2. Products
- 17.2.4.3. SWOT Analysis
- 17.2.4.4. Recent Developments
- 17.2.4.5. Financials (Based on Availability)
- 17.2.5 Datadog Inc
- 17.2.5.1. Overview
- 17.2.5.2. Products
- 17.2.5.3. SWOT Analysis
- 17.2.5.4. Recent Developments
- 17.2.5.5. Financials (Based on Availability)
- 17.2.6 Broadcom Inc
- 17.2.6.1. Overview
- 17.2.6.2. Products
- 17.2.6.3. SWOT Analysis
- 17.2.6.4. Recent Developments
- 17.2.6.5. Financials (Based on Availability)
- 17.2.7 Microsoft Corporation
- 17.2.7.1. Overview
- 17.2.7.2. Products
- 17.2.7.3. SWOT Analysis
- 17.2.7.4. Recent Developments
- 17.2.7.5. Financials (Based on Availability)
- 17.2.8 IBM Corp
- 17.2.8.1. Overview
- 17.2.8.2. Products
- 17.2.8.3. SWOT Analysis
- 17.2.8.4. Recent Developments
- 17.2.8.5. Financials (Based on Availability)
- 17.2.9 AppDynamics LLC (Cisco Systems Inc )
- 17.2.9.1. Overview
- 17.2.9.2. Products
- 17.2.9.3. SWOT Analysis
- 17.2.9.4. Recent Developments
- 17.2.9.5. Financials (Based on Availability)
- 17.2.10 Dynatrace LLC
- 17.2.10.1. Overview
- 17.2.10.2. Products
- 17.2.10.3. SWOT Analysis
- 17.2.10.4. Recent Developments
- 17.2.10.5. Financials (Based on Availability)
- 17.2.1 Mic Focus International PLC
List of Figures
- Figure 1: Global Application Performance Management Market Revenue Breakdown (Million, %) by Region 2024 & 2032
- Figure 2: North America Application Performance Management Market Revenue (Million), by Country 2024 & 2032
- Figure 3: North America Application Performance Management Market Revenue Share (%), by Country 2024 & 2032
- Figure 4: Europe Application Performance Management Market Revenue (Million), by Country 2024 & 2032
- Figure 5: Europe Application Performance Management Market Revenue Share (%), by Country 2024 & 2032
- Figure 6: Asia Pacific Application Performance Management Market Revenue (Million), by Country 2024 & 2032
- Figure 7: Asia Pacific Application Performance Management Market Revenue Share (%), by Country 2024 & 2032
- Figure 8: South America Application Performance Management Market Revenue (Million), by Country 2024 & 2032
- Figure 9: South America Application Performance Management Market Revenue Share (%), by Country 2024 & 2032
- Figure 10: MEA Application Performance Management Market Revenue (Million), by Country 2024 & 2032
- Figure 11: MEA Application Performance Management Market Revenue Share (%), by Country 2024 & 2032
- Figure 12: North America Application Performance Management Market Revenue (Million), by Deployment 2024 & 2032
- Figure 13: North America Application Performance Management Market Revenue Share (%), by Deployment 2024 & 2032
- Figure 14: North America Application Performance Management Market Revenue (Million), by Enterprise Size 2024 & 2032
- Figure 15: North America Application Performance Management Market Revenue Share (%), by Enterprise Size 2024 & 2032
- Figure 16: North America Application Performance Management Market Revenue (Million), by Country 2024 & 2032
- Figure 17: North America Application Performance Management Market Revenue Share (%), by Country 2024 & 2032
- Figure 18: Europe Application Performance Management Market Revenue (Million), by Deployment 2024 & 2032
- Figure 19: Europe Application Performance Management Market Revenue Share (%), by Deployment 2024 & 2032
- Figure 20: Europe Application Performance Management Market Revenue (Million), by Enterprise Size 2024 & 2032
- Figure 21: Europe Application Performance Management Market Revenue Share (%), by Enterprise Size 2024 & 2032
- Figure 22: Europe Application Performance Management Market Revenue (Million), by Country 2024 & 2032
- Figure 23: Europe Application Performance Management Market Revenue Share (%), by Country 2024 & 2032
- Figure 24: Asia Application Performance Management Market Revenue (Million), by Deployment 2024 & 2032
- Figure 25: Asia Application Performance Management Market Revenue Share (%), by Deployment 2024 & 2032
- Figure 26: Asia Application Performance Management Market Revenue (Million), by Enterprise Size 2024 & 2032
- Figure 27: Asia Application Performance Management Market Revenue Share (%), by Enterprise Size 2024 & 2032
- Figure 28: Asia Application Performance Management Market Revenue (Million), by Country 2024 & 2032
- Figure 29: Asia Application Performance Management Market Revenue Share (%), by Country 2024 & 2032
- Figure 30: Australia and New Zealand Application Performance Management Market Revenue (Million), by Deployment 2024 & 2032
- Figure 31: Australia and New Zealand Application Performance Management Market Revenue Share (%), by Deployment 2024 & 2032
- Figure 32: Australia and New Zealand Application Performance Management Market Revenue (Million), by Enterprise Size 2024 & 2032
- Figure 33: Australia and New Zealand Application Performance Management Market Revenue Share (%), by Enterprise Size 2024 & 2032
- Figure 34: Australia and New Zealand Application Performance Management Market Revenue (Million), by Country 2024 & 2032
- Figure 35: Australia and New Zealand Application Performance Management Market Revenue Share (%), by Country 2024 & 2032
- Figure 36: Latin America Application Performance Management Market Revenue (Million), by Deployment 2024 & 2032
- Figure 37: Latin America Application Performance Management Market Revenue Share (%), by Deployment 2024 & 2032
- Figure 38: Latin America Application Performance Management Market Revenue (Million), by Enterprise Size 2024 & 2032
- Figure 39: Latin America Application Performance Management Market Revenue Share (%), by Enterprise Size 2024 & 2032
- Figure 40: Latin America Application Performance Management Market Revenue (Million), by Country 2024 & 2032
- Figure 41: Latin America Application Performance Management Market Revenue Share (%), by Country 2024 & 2032
- Figure 42: Middle East and Africa Application Performance Management Market Revenue (Million), by Deployment 2024 & 2032
- Figure 43: Middle East and Africa Application Performance Management Market Revenue Share (%), by Deployment 2024 & 2032
- Figure 44: Middle East and Africa Application Performance Management Market Revenue (Million), by Enterprise Size 2024 & 2032
- Figure 45: Middle East and Africa Application Performance Management Market Revenue Share (%), by Enterprise Size 2024 & 2032
- Figure 46: Middle East and Africa Application Performance Management Market Revenue (Million), by Country 2024 & 2032
- Figure 47: Middle East and Africa Application Performance Management Market Revenue Share (%), by Country 2024 & 2032
List of Tables
- Table 1: Global Application Performance Management Market Revenue Million Forecast, by Region 2019 & 2032
- Table 2: Global Application Performance Management Market Revenue Million Forecast, by Deployment 2019 & 2032
- Table 3: Global Application Performance Management Market Revenue Million Forecast, by Enterprise Size 2019 & 2032
- Table 4: Global Application Performance Management Market Revenue Million Forecast, by Region 2019 & 2032
- Table 5: Global Application Performance Management Market Revenue Million Forecast, by Country 2019 & 2032
- Table 6: United States Application Performance Management Market Revenue (Million) Forecast, by Application 2019 & 2032
- Table 7: Canada Application Performance Management Market Revenue (Million) Forecast, by Application 2019 & 2032
- Table 8: Mexico Application Performance Management Market Revenue (Million) Forecast, by Application 2019 & 2032
- Table 9: Global Application Performance Management Market Revenue Million Forecast, by Country 2019 & 2032
- Table 10: Germany Application Performance Management Market Revenue (Million) Forecast, by Application 2019 & 2032
- Table 11: United Kingdom Application Performance Management Market Revenue (Million) Forecast, by Application 2019 & 2032
- Table 12: France Application Performance Management Market Revenue (Million) Forecast, by Application 2019 & 2032
- Table 13: Spain Application Performance Management Market Revenue (Million) Forecast, by Application 2019 & 2032
- Table 14: Italy Application Performance Management Market Revenue (Million) Forecast, by Application 2019 & 2032
- Table 15: Spain Application Performance Management Market Revenue (Million) Forecast, by Application 2019 & 2032
- Table 16: Belgium Application Performance Management Market Revenue (Million) Forecast, by Application 2019 & 2032
- Table 17: Netherland Application Performance Management Market Revenue (Million) Forecast, by Application 2019 & 2032
- Table 18: Nordics Application Performance Management Market Revenue (Million) Forecast, by Application 2019 & 2032
- Table 19: Rest of Europe Application Performance Management Market Revenue (Million) Forecast, by Application 2019 & 2032
- Table 20: Global Application Performance Management Market Revenue Million Forecast, by Country 2019 & 2032
- Table 21: China Application Performance Management Market Revenue (Million) Forecast, by Application 2019 & 2032
- Table 22: Japan Application Performance Management Market Revenue (Million) Forecast, by Application 2019 & 2032
- Table 23: India Application Performance Management Market Revenue (Million) Forecast, by Application 2019 & 2032
- Table 24: South Korea Application Performance Management Market Revenue (Million) Forecast, by Application 2019 & 2032
- Table 25: Southeast Asia Application Performance Management Market Revenue (Million) Forecast, by Application 2019 & 2032
- Table 26: Australia Application Performance Management Market Revenue (Million) Forecast, by Application 2019 & 2032
- Table 27: Indonesia Application Performance Management Market Revenue (Million) Forecast, by Application 2019 & 2032
- Table 28: Phillipes Application Performance Management Market Revenue (Million) Forecast, by Application 2019 & 2032
- Table 29: Singapore Application Performance Management Market Revenue (Million) Forecast, by Application 2019 & 2032
- Table 30: Thailandc Application Performance Management Market Revenue (Million) Forecast, by Application 2019 & 2032
- Table 31: Rest of Asia Pacific Application Performance Management Market Revenue (Million) Forecast, by Application 2019 & 2032
- Table 32: Global Application Performance Management Market Revenue Million Forecast, by Country 2019 & 2032
- Table 33: Brazil Application Performance Management Market Revenue (Million) Forecast, by Application 2019 & 2032
- Table 34: Argentina Application Performance Management Market Revenue (Million) Forecast, by Application 2019 & 2032
- Table 35: Peru Application Performance Management Market Revenue (Million) Forecast, by Application 2019 & 2032
- Table 36: Chile Application Performance Management Market Revenue (Million) Forecast, by Application 2019 & 2032
- Table 37: Colombia Application Performance Management Market Revenue (Million) Forecast, by Application 2019 & 2032
- Table 38: Ecuador Application Performance Management Market Revenue (Million) Forecast, by Application 2019 & 2032
- Table 39: Venezuela Application Performance Management Market Revenue (Million) Forecast, by Application 2019 & 2032
- Table 40: Rest of South America Application Performance Management Market Revenue (Million) Forecast, by Application 2019 & 2032
- Table 41: Global Application Performance Management Market Revenue Million Forecast, by Country 2019 & 2032
- Table 42: United Arab Emirates Application Performance Management Market Revenue (Million) Forecast, by Application 2019 & 2032
- Table 43: Saudi Arabia Application Performance Management Market Revenue (Million) Forecast, by Application 2019 & 2032
- Table 44: South Africa Application Performance Management Market Revenue (Million) Forecast, by Application 2019 & 2032
- Table 45: Rest of Middle East and Africa Application Performance Management Market Revenue (Million) Forecast, by Application 2019 & 2032
- Table 46: Global Application Performance Management Market Revenue Million Forecast, by Deployment 2019 & 2032
- Table 47: Global Application Performance Management Market Revenue Million Forecast, by Enterprise Size 2019 & 2032
- Table 48: Global Application Performance Management Market Revenue Million Forecast, by Country 2019 & 2032
- Table 49: Global Application Performance Management Market Revenue Million Forecast, by Deployment 2019 & 2032
- Table 50: Global Application Performance Management Market Revenue Million Forecast, by Enterprise Size 2019 & 2032
- Table 51: Global Application Performance Management Market Revenue Million Forecast, by Country 2019 & 2032
- Table 52: Global Application Performance Management Market Revenue Million Forecast, by Deployment 2019 & 2032
- Table 53: Global Application Performance Management Market Revenue Million Forecast, by Enterprise Size 2019 & 2032
- Table 54: Global Application Performance Management Market Revenue Million Forecast, by Country 2019 & 2032
- Table 55: Global Application Performance Management Market Revenue Million Forecast, by Deployment 2019 & 2032
- Table 56: Global Application Performance Management Market Revenue Million Forecast, by Enterprise Size 2019 & 2032
- Table 57: Global Application Performance Management Market Revenue Million Forecast, by Country 2019 & 2032
- Table 58: Global Application Performance Management Market Revenue Million Forecast, by Deployment 2019 & 2032
- Table 59: Global Application Performance Management Market Revenue Million Forecast, by Enterprise Size 2019 & 2032
- Table 60: Global Application Performance Management Market Revenue Million Forecast, by Country 2019 & 2032
- Table 61: Global Application Performance Management Market Revenue Million Forecast, by Deployment 2019 & 2032
- Table 62: Global Application Performance Management Market Revenue Million Forecast, by Enterprise Size 2019 & 2032
- Table 63: Global Application Performance Management Market Revenue Million Forecast, by Country 2019 & 2032
Frequently Asked Questions
1. What is the projected Compound Annual Growth Rate (CAGR) of the Application Performance Management Market?
The projected CAGR is approximately 30.76%.
2. Which companies are prominent players in the Application Performance Management Market?
Key companies in the market include Mic Focus International PLC, New Relic Inc, SignalFX (part of Splunk Inc ), Akamai Technologies Inc, Datadog Inc, Broadcom Inc, Microsoft Corporation, IBM Corp, AppDynamics LLC (Cisco Systems Inc ), Dynatrace LLC.
3. What are the main segments of the Application Performance Management Market?
The market segments include Deployment, Enterprise Size.
4. Can you provide details about the market size?
The market size is estimated to be USD 9.38 Million as of 2022.
5. What are some drivers contributing to market growth?
Increasing need for End-user satisfaction for successful Digital Business Operations.
6. What are the notable trends driving market growth?
Adoption in Large Enterprises to Drive Market Growth.
7. Are there any restraints impacting market growth?
Lack of Awareness About Intellectual Property Outsourcing.
8. Can you provide examples of recent developments in the market?
May 2023: New Relic Inc. announced the launch of Grok, its AI observability assistant, and plans to employ a big language model to assist engineers in performing numerous common activities using natural language. New Relic uses observability technologies to set up instrumentation, provide reports, and manage accounts for the DevOps and DevSecOps movements. Engineers employ observability tools to gather the information required to run and secure the software they create.
9. What pricing options are available for accessing the report?
Pricing options include single-user, multi-user, and enterprise licenses priced at USD 4750, USD 5250, and USD 8750 respectively.
10. Is the market size provided in terms of value or volume?
The market size is provided in terms of value, measured in Million.
11. Are there any specific market keywords associated with the report?
Yes, the market keyword associated with the report is "Application Performance Management Market," which aids in identifying and referencing the specific market segment covered.
12. How do I determine which pricing option suits my needs best?
The pricing options vary based on user requirements and access needs. Individual users may opt for single-user licenses, while businesses requiring broader access may choose multi-user or enterprise licenses for cost-effective access to the report.
13. Are there any additional resources or data provided in the Application Performance Management Market report?
While the report offers comprehensive insights, it's advisable to review the specific contents or supplementary materials provided to ascertain if additional resources or data are available.
14. How can I stay updated on further developments or reports in the Application Performance Management Market?
To stay informed about further developments, trends, and reports in the Application Performance Management Market, consider subscribing to industry newsletters, following relevant companies and organizations, or regularly checking reputable industry news sources and publications.
Methodology
Step 1 - Identification of Relevant Samples Size from Population Database


Step 2 - Approaches for Defining Global Market Size (Value, Volume* & Price*)

Note*: In applicable scenarios
Step 3 - Data Sources
Primary Research
- Web Analytics
- Survey Reports
- Research Institute
- Latest Research Reports
- Opinion Leaders
Secondary Research
- Annual Reports
- White Paper
- Latest Press Release
- Industry Association
- Paid Database
- Investor Presentations

Step 4 - Data Triangulation
Involves using different sources of information in order to increase the validity of a study
These sources are likely to be stakeholders in a program - participants, other researchers, program staff, other community members, and so on.
Then we put all data in single framework & apply various statistical tools to find out the dynamic on the market.
During the analysis stage, feedback from the stakeholder groups would be compared to determine areas of agreement as well as areas of divergence
