

Key Insights
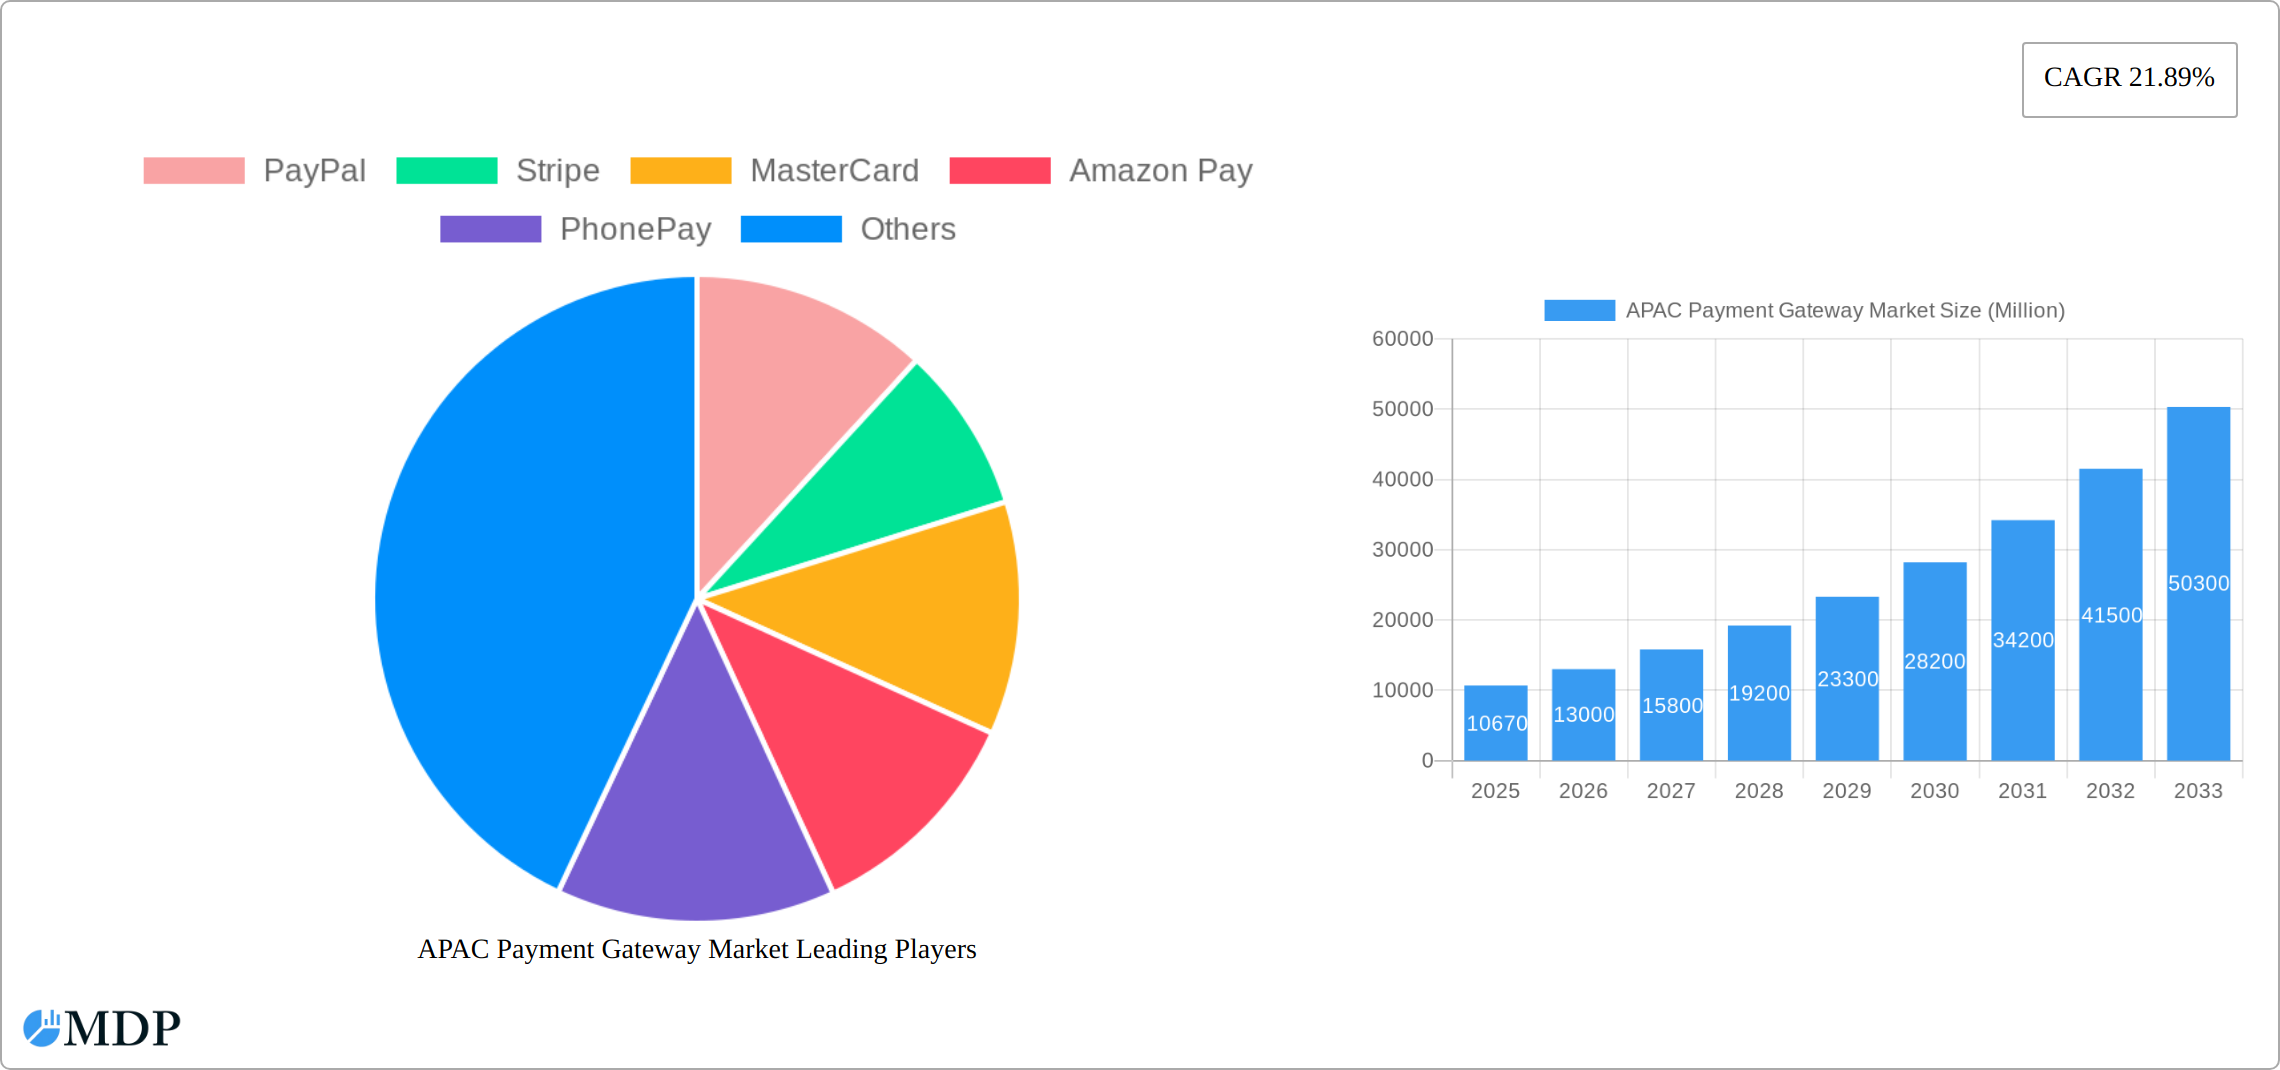
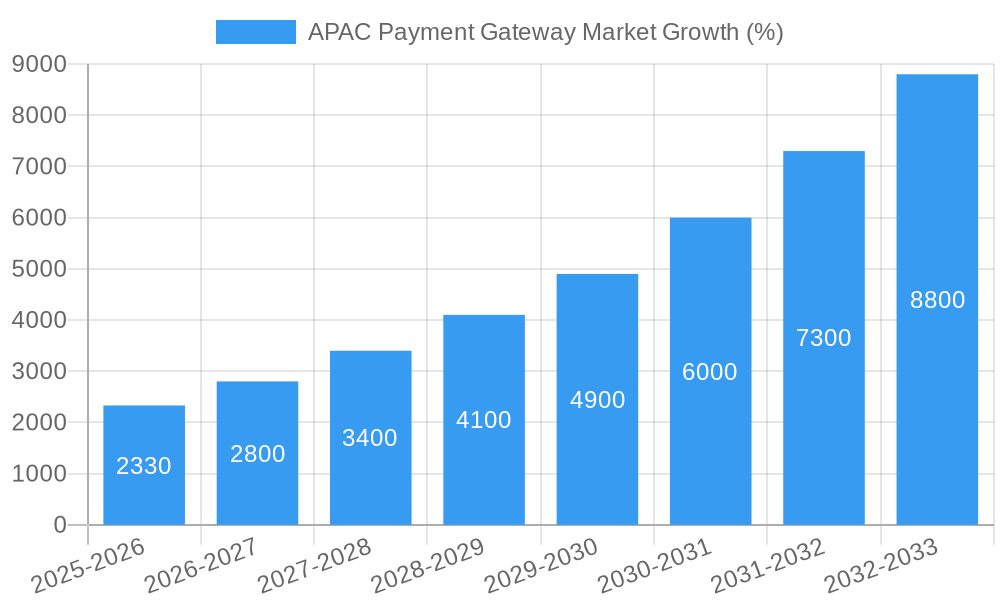
The APAC payment gateway market is experiencing robust growth, projected to reach \$10.67 billion in 2025 and exhibiting a Compound Annual Growth Rate (CAGR) of 21.89% from 2025 to 2033. This expansion is fueled by several key factors. The burgeoning e-commerce sector across the Asia-Pacific region, coupled with increasing smartphone penetration and digital literacy, is driving the adoption of online payment solutions. Consumers are increasingly comfortable using digital payment methods, leading to a significant shift away from traditional cash transactions. Furthermore, government initiatives promoting digital financial inclusion and supportive regulatory frameworks are facilitating market growth. The rise of mobile wallets and Buy Now Pay Later (BNPL) options are also significantly contributing to the market's expansion, offering consumers greater convenience and flexibility. Competition is fierce, with established players like PayPal, Stripe, and Mastercard vying for market share alongside regional giants such as PhonePe, Alipay, and RazorPay. This competitive landscape is fostering innovation and driving down transaction costs, further benefitting both businesses and consumers.
The market's growth trajectory is not without challenges. Security concerns surrounding online transactions remain a significant restraint, requiring robust security measures and consumer education. Varied levels of digital infrastructure across different APAC countries pose another hurdle, particularly in less developed regions. Regulatory complexities and cross-border transaction challenges also present obstacles to consistent market expansion. However, ongoing technological advancements, such as improved fraud detection systems and the adoption of advanced encryption technologies, are mitigating these risks. The market is expected to witness further segmentation based on payment type (credit/debit cards, mobile wallets, etc.) and industry vertical (e-commerce, travel, etc.), creating nuanced opportunities for specialized players. The forecast period (2025-2033) anticipates sustained growth driven by continued digital transformation and increased consumer confidence in online payments.
Unlock Growth in the Booming APAC Payment Gateway Market: A Comprehensive Report (2019-2033)
This in-depth report provides a comprehensive analysis of the Asia-Pacific (APAC) payment gateway market, offering invaluable insights for businesses, investors, and industry stakeholders. With a study period spanning 2019-2033, a base year of 2025, and a forecast period from 2025-2033, this report leverages historical data (2019-2024) to predict future trends and market dynamics. The APAC region is experiencing explosive growth in digital transactions, making this market ripe with opportunity. This report covers key players like PayPal, Stripe, MasterCard, Amazon Pay, PhonePay, Google Pay, RazorPay, AsiaPay, 2Checkout.com Inc, and Eway (list not exhaustive), offering a granular view of the competitive landscape. The market is segmented by [Insert Segmentation Details Here - e.g., transaction type, business size, payment method etc.], providing a nuanced understanding of market dynamics. The total market value in 2025 is estimated at XX Million, projected to reach YY Million by 2033, exhibiting a robust CAGR of ZZ%.
APAC Payment Gateway Market Market Dynamics & Concentration
The APAC payment gateway market is characterized by a dynamic interplay of factors influencing its concentration and growth. Market share is currently fragmented, with [Insert Percentage]% held by the top five players. However, ongoing mergers and acquisitions (M&A) activities are reshaping the competitive landscape. Over the historical period (2019-2024), we observed approximately XX M&A deals, indicating a high level of consolidation. Key drivers of innovation include the increasing adoption of mobile payments, the rise of fintech startups, and evolving consumer preferences. Regulatory frameworks, varying across different APAC countries, significantly impact market dynamics. The emergence of alternative payment methods like Buy Now Pay Later (BNPL) poses a significant challenge to traditional payment gateways. Furthermore, end-user trends, such as the preference for contactless payments and heightened security concerns, are shaping product development strategies.
- Market Concentration: Fragmented, with increasing consolidation through M&A.
- Innovation Drivers: Mobile payments, fintech startups, evolving consumer preferences.
- Regulatory Frameworks: Vary significantly across APAC nations, impacting market access.
- Product Substitutes: BNPL services, mobile wallets, other digital payment methods.
- End-User Trends: Contactless payments, security concerns drive innovation.
- M&A Activities: Approximately XX deals during 2019-2024, indicating significant consolidation.
APAC Payment Gateway Market Industry Trends & Analysis
The APAC payment gateway market is experiencing significant growth driven by several key factors. The increasing smartphone penetration and internet access across the region are fueling the adoption of digital payment methods. Furthermore, the rise of e-commerce and the expanding digital economy are creating a surge in demand for secure and reliable payment gateways. Technological disruptions, such as the adoption of blockchain technology and AI-powered fraud detection systems, are transforming the industry. Consumer preferences are shifting towards contactless and mobile-first payment solutions. Competitive dynamics are intense, with both established players and new entrants vying for market share. This results in continuous innovation and competitive pricing strategies. Market penetration is estimated at [Insert Percentage]% in 2025, projected to reach [Insert Percentage]% by 2033. The overall market exhibits a strong CAGR of [Insert CAGR Percentage]%. Factors contributing to this growth include [Insert Detailed Paragraph on Market Growth Drivers - at least 300 words covering consumer behavior, technological factors, economic factors etc.].
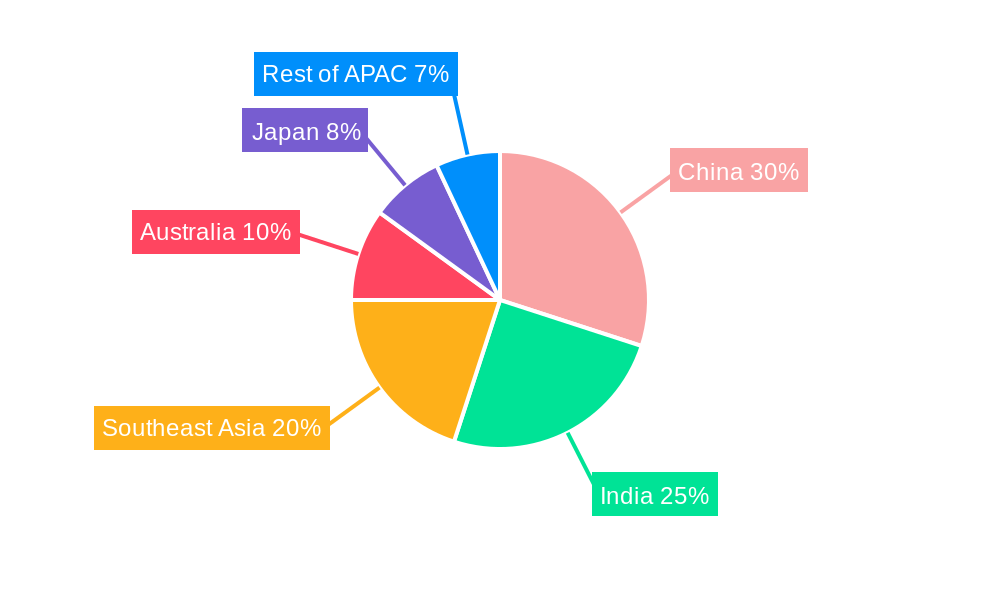
Leading Markets & Segments in APAC Payment Gateway Market
[Insert Name of Dominant Region/Country] is currently the leading market for APAC payment gateways, accounting for approximately [Insert Percentage]% of the total market revenue in 2025. Its dominance stems from a combination of factors:
- Strong Economic Growth: [Insert detailed description and figures].
- Robust E-commerce Sector: [Insert detailed description and figures].
- Favorable Regulatory Environment: [Insert detailed description and figures].
- High Smartphone and Internet Penetration: [Insert detailed description and figures].
- Government Initiatives Promoting Digital Payments: [Insert detailed description and figures].
[Insert Detailed Paragraph Analyzing the Dominance of the Leading Market - minimum 300 words. This should cover factors beyond those listed in bullet points]. Analysis of leading segments within the overall market will also be included here.
APAC Payment Gateway Market Product Developments
Recent product innovations have focused on enhancing security features, improving user experience, and expanding payment options. This includes integrating biometric authentication, incorporating AI-driven fraud detection, and supporting a wider range of local and international payment methods. The adoption of cloud-based solutions and APIs is enhancing scalability and interoperability. These developments cater to the evolving needs of businesses and consumers, driving market growth and increasing competition.
Key Drivers of APAP Payment Gateway Market Growth
Several factors are driving the growth of the APAC payment gateway market. Technological advancements, such as the development of faster and more secure payment systems, are a major catalyst. The expanding e-commerce sector and the increasing adoption of mobile payments are also key drivers. Furthermore, supportive government policies and regulations in several APAC countries are encouraging the growth of digital payments. For example, the implementation of digital payment initiatives in [Country Example] has significantly boosted market growth.
Challenges in the APAC Payment Gateway Market Market
The APAC payment gateway market faces several challenges. Strict regulatory requirements across different countries create complexities for businesses operating in the region. Supply chain disruptions and the increasing costs of cybersecurity measures can also impact profitability. Intense competition among established players and emerging fintech startups is a significant hurdle for smaller players. These challenges necessitate strategic planning and adaptability for businesses to thrive in this competitive market. For example, regulatory uncertainty in [Country] has slowed market expansion by [quantifiable impact].
Emerging Opportunities in APAC Payment Gateway Market
The APAC payment gateway market presents significant long-term growth opportunities. The increasing adoption of innovative technologies, such as blockchain and AI, offers new avenues for enhancing security and efficiency. Strategic partnerships between payment gateways and fintech companies can unlock new market segments and customer bases. Expansion into underserved markets within the APAC region presents substantial potential for growth.
Leading Players in the APAC Payment Gateway Market Sector
- PayPal
- Stripe
- MasterCard
- Amazon Pay
- PhonePay
- Google Pay
- RazorPay
- AsiaPay
- 2Checkout.com Inc
- Eway
Key Milestones in APAC Payment Gateway Market Industry
- May 2024: Mastercard launched domestic payment processing services in China through its joint venture, Mastercard NetsUnion Information Technology, significantly expanding its reach within the Chinese market.
- April 2024: Soft Space partnered with JCB to launch a payment gateway in Malaysia, catering to the rising demand for secure digital transactions and expanding JCB's network to over 156 million card members.
Strategic Outlook for APAC Payment Gateway Market Market
The APAC payment gateway market is poised for continued strong growth, driven by increasing digitalization and the expansion of e-commerce. Strategic partnerships, technological innovation, and expansion into new markets will be crucial for success. Companies focusing on enhancing security features, improving user experience, and offering a wider range of payment options are likely to gain a competitive advantage. The market offers significant potential for both established players and emerging fintech companies.
APAC Payment Gateway Market Segmentation
-
1. Type
- 1.1. Hosted
- 1.2. Non-hosted
-
2. Enterprise
- 2.1. Small and Medium Enterprise (SME)
- 2.2. Large Enterprise
-
3. End User
- 3.1. Travel
- 3.2. Retail
- 3.3. BFSI
- 3.4. Media and Entertainment
- 3.5. Other End Users
APAC Payment Gateway Market Segmentation By Geography
-
1. North America
- 1.1. United States
- 1.2. Canada
- 1.3. Mexico
-
2. South America
- 2.1. Brazil
- 2.2. Argentina
- 2.3. Rest of South America
-
3. Europe
- 3.1. United Kingdom
- 3.2. Germany
- 3.3. France
- 3.4. Italy
- 3.5. Spain
- 3.6. Russia
- 3.7. Benelux
- 3.8. Nordics
- 3.9. Rest of Europe
-
4. Middle East & Africa
- 4.1. Turkey
- 4.2. Israel
- 4.3. GCC
- 4.4. North Africa
- 4.5. South Africa
- 4.6. Rest of Middle East & Africa
-
5. Asia Pacific
- 5.1. China
- 5.2. India
- 5.3. Japan
- 5.4. South Korea
- 5.5. ASEAN
- 5.6. Oceania
- 5.7. Rest of Asia Pacific
APAC Payment Gateway Market REPORT HIGHLIGHTS
| Aspects | Details |
|---|---|
| Study Period | 2019-2033 |
| Base Year | 2024 |
| Estimated Year | 2025 |
| Forecast Period | 2025-2033 |
| Historical Period | 2019-2024 |
| Growth Rate | CAGR of 21.89% from 2019-2033 |
| Segmentation |
|
Table of Contents
- 1. Introduction
- 1.1. Research Scope
- 1.2. Market Segmentation
- 1.3. Research Methodology
- 1.4. Definitions and Assumptions
- 2. Executive Summary
- 2.1. Introduction
- 3. Market Dynamics
- 3.1. Introduction
- 3.2. Market Drivers
- 3.2.1. Increased E-commerce Sales and High Internet Penetration Rate; Increased Demand for Mobile-based Payments; Growing Adoption of Payment Gateways in Retail
- 3.3. Market Restrains
- 3.3.1. Increased E-commerce Sales and High Internet Penetration Rate; Increased Demand for Mobile-based Payments; Growing Adoption of Payment Gateways in Retail
- 3.4. Market Trends
- 3.4.1. Growing Use of Payment Gateway in Tavel Industry.
- 4. Market Factor Analysis
- 4.1. Porters Five Forces
- 4.2. Supply/Value Chain
- 4.3. PESTEL analysis
- 4.4. Market Entropy
- 4.5. Patent/Trademark Analysis
- 5. Global APAC Payment Gateway Market Analysis, Insights and Forecast, 2019-2031
- 5.1. Market Analysis, Insights and Forecast - by Type
- 5.1.1. Hosted
- 5.1.2. Non-hosted
- 5.2. Market Analysis, Insights and Forecast - by Enterprise
- 5.2.1. Small and Medium Enterprise (SME)
- 5.2.2. Large Enterprise
- 5.3. Market Analysis, Insights and Forecast - by End User
- 5.3.1. Travel
- 5.3.2. Retail
- 5.3.3. BFSI
- 5.3.4. Media and Entertainment
- 5.3.5. Other End Users
- 5.4. Market Analysis, Insights and Forecast - by Region
- 5.4.1. North America
- 5.4.2. South America
- 5.4.3. Europe
- 5.4.4. Middle East & Africa
- 5.4.5. Asia Pacific
- 5.1. Market Analysis, Insights and Forecast - by Type
- 6. North America APAC Payment Gateway Market Analysis, Insights and Forecast, 2019-2031
- 6.1. Market Analysis, Insights and Forecast - by Type
- 6.1.1. Hosted
- 6.1.2. Non-hosted
- 6.2. Market Analysis, Insights and Forecast - by Enterprise
- 6.2.1. Small and Medium Enterprise (SME)
- 6.2.2. Large Enterprise
- 6.3. Market Analysis, Insights and Forecast - by End User
- 6.3.1. Travel
- 6.3.2. Retail
- 6.3.3. BFSI
- 6.3.4. Media and Entertainment
- 6.3.5. Other End Users
- 6.1. Market Analysis, Insights and Forecast - by Type
- 7. South America APAC Payment Gateway Market Analysis, Insights and Forecast, 2019-2031
- 7.1. Market Analysis, Insights and Forecast - by Type
- 7.1.1. Hosted
- 7.1.2. Non-hosted
- 7.2. Market Analysis, Insights and Forecast - by Enterprise
- 7.2.1. Small and Medium Enterprise (SME)
- 7.2.2. Large Enterprise
- 7.3. Market Analysis, Insights and Forecast - by End User
- 7.3.1. Travel
- 7.3.2. Retail
- 7.3.3. BFSI
- 7.3.4. Media and Entertainment
- 7.3.5. Other End Users
- 7.1. Market Analysis, Insights and Forecast - by Type
- 8. Europe APAC Payment Gateway Market Analysis, Insights and Forecast, 2019-2031
- 8.1. Market Analysis, Insights and Forecast - by Type
- 8.1.1. Hosted
- 8.1.2. Non-hosted
- 8.2. Market Analysis, Insights and Forecast - by Enterprise
- 8.2.1. Small and Medium Enterprise (SME)
- 8.2.2. Large Enterprise
- 8.3. Market Analysis, Insights and Forecast - by End User
- 8.3.1. Travel
- 8.3.2. Retail
- 8.3.3. BFSI
- 8.3.4. Media and Entertainment
- 8.3.5. Other End Users
- 8.1. Market Analysis, Insights and Forecast - by Type
- 9. Middle East & Africa APAC Payment Gateway Market Analysis, Insights and Forecast, 2019-2031
- 9.1. Market Analysis, Insights and Forecast - by Type
- 9.1.1. Hosted
- 9.1.2. Non-hosted
- 9.2. Market Analysis, Insights and Forecast - by Enterprise
- 9.2.1. Small and Medium Enterprise (SME)
- 9.2.2. Large Enterprise
- 9.3. Market Analysis, Insights and Forecast - by End User
- 9.3.1. Travel
- 9.3.2. Retail
- 9.3.3. BFSI
- 9.3.4. Media and Entertainment
- 9.3.5. Other End Users
- 9.1. Market Analysis, Insights and Forecast - by Type
- 10. Asia Pacific APAC Payment Gateway Market Analysis, Insights and Forecast, 2019-2031
- 10.1. Market Analysis, Insights and Forecast - by Type
- 10.1.1. Hosted
- 10.1.2. Non-hosted
- 10.2. Market Analysis, Insights and Forecast - by Enterprise
- 10.2.1. Small and Medium Enterprise (SME)
- 10.2.2. Large Enterprise
- 10.3. Market Analysis, Insights and Forecast - by End User
- 10.3.1. Travel
- 10.3.2. Retail
- 10.3.3. BFSI
- 10.3.4. Media and Entertainment
- 10.3.5. Other End Users
- 10.1. Market Analysis, Insights and Forecast - by Type
- 11. Competitive Analysis
- 11.1. Global Market Share Analysis 2024
- 11.2. Company Profiles
- 11.2.1 PayPal
- 11.2.1.1. Overview
- 11.2.1.2. Products
- 11.2.1.3. SWOT Analysis
- 11.2.1.4. Recent Developments
- 11.2.1.5. Financials (Based on Availability)
- 11.2.2 Stripe
- 11.2.2.1. Overview
- 11.2.2.2. Products
- 11.2.2.3. SWOT Analysis
- 11.2.2.4. Recent Developments
- 11.2.2.5. Financials (Based on Availability)
- 11.2.3 MasterCard
- 11.2.3.1. Overview
- 11.2.3.2. Products
- 11.2.3.3. SWOT Analysis
- 11.2.3.4. Recent Developments
- 11.2.3.5. Financials (Based on Availability)
- 11.2.4 Amazon Pay
- 11.2.4.1. Overview
- 11.2.4.2. Products
- 11.2.4.3. SWOT Analysis
- 11.2.4.4. Recent Developments
- 11.2.4.5. Financials (Based on Availability)
- 11.2.5 PhonePay
- 11.2.5.1. Overview
- 11.2.5.2. Products
- 11.2.5.3. SWOT Analysis
- 11.2.5.4. Recent Developments
- 11.2.5.5. Financials (Based on Availability)
- 11.2.6 GooglePay
- 11.2.6.1. Overview
- 11.2.6.2. Products
- 11.2.6.3. SWOT Analysis
- 11.2.6.4. Recent Developments
- 11.2.6.5. Financials (Based on Availability)
- 11.2.7 RazorPay
- 11.2.7.1. Overview
- 11.2.7.2. Products
- 11.2.7.3. SWOT Analysis
- 11.2.7.4. Recent Developments
- 11.2.7.5. Financials (Based on Availability)
- 11.2.8 AsiaPay
- 11.2.8.1. Overview
- 11.2.8.2. Products
- 11.2.8.3. SWOT Analysis
- 11.2.8.4. Recent Developments
- 11.2.8.5. Financials (Based on Availability)
- 11.2.9 2Checkout com Inc
- 11.2.9.1. Overview
- 11.2.9.2. Products
- 11.2.9.3. SWOT Analysis
- 11.2.9.4. Recent Developments
- 11.2.9.5. Financials (Based on Availability)
- 11.2.10 Eway*List Not Exhaustive
- 11.2.10.1. Overview
- 11.2.10.2. Products
- 11.2.10.3. SWOT Analysis
- 11.2.10.4. Recent Developments
- 11.2.10.5. Financials (Based on Availability)
- 11.2.1 PayPal
List of Figures
- Figure 1: Global APAC Payment Gateway Market Revenue Breakdown (Million, %) by Region 2024 & 2032
- Figure 2: Global APAC Payment Gateway Market Volume Breakdown (Billion, %) by Region 2024 & 2032
- Figure 3: North America APAC Payment Gateway Market Revenue (Million), by Type 2024 & 2032
- Figure 4: North America APAC Payment Gateway Market Volume (Billion), by Type 2024 & 2032
- Figure 5: North America APAC Payment Gateway Market Revenue Share (%), by Type 2024 & 2032
- Figure 6: North America APAC Payment Gateway Market Volume Share (%), by Type 2024 & 2032
- Figure 7: North America APAC Payment Gateway Market Revenue (Million), by Enterprise 2024 & 2032
- Figure 8: North America APAC Payment Gateway Market Volume (Billion), by Enterprise 2024 & 2032
- Figure 9: North America APAC Payment Gateway Market Revenue Share (%), by Enterprise 2024 & 2032
- Figure 10: North America APAC Payment Gateway Market Volume Share (%), by Enterprise 2024 & 2032
- Figure 11: North America APAC Payment Gateway Market Revenue (Million), by End User 2024 & 2032
- Figure 12: North America APAC Payment Gateway Market Volume (Billion), by End User 2024 & 2032
- Figure 13: North America APAC Payment Gateway Market Revenue Share (%), by End User 2024 & 2032
- Figure 14: North America APAC Payment Gateway Market Volume Share (%), by End User 2024 & 2032
- Figure 15: North America APAC Payment Gateway Market Revenue (Million), by Country 2024 & 2032
- Figure 16: North America APAC Payment Gateway Market Volume (Billion), by Country 2024 & 2032
- Figure 17: North America APAC Payment Gateway Market Revenue Share (%), by Country 2024 & 2032
- Figure 18: North America APAC Payment Gateway Market Volume Share (%), by Country 2024 & 2032
- Figure 19: South America APAC Payment Gateway Market Revenue (Million), by Type 2024 & 2032
- Figure 20: South America APAC Payment Gateway Market Volume (Billion), by Type 2024 & 2032
- Figure 21: South America APAC Payment Gateway Market Revenue Share (%), by Type 2024 & 2032
- Figure 22: South America APAC Payment Gateway Market Volume Share (%), by Type 2024 & 2032
- Figure 23: South America APAC Payment Gateway Market Revenue (Million), by Enterprise 2024 & 2032
- Figure 24: South America APAC Payment Gateway Market Volume (Billion), by Enterprise 2024 & 2032
- Figure 25: South America APAC Payment Gateway Market Revenue Share (%), by Enterprise 2024 & 2032
- Figure 26: South America APAC Payment Gateway Market Volume Share (%), by Enterprise 2024 & 2032
- Figure 27: South America APAC Payment Gateway Market Revenue (Million), by End User 2024 & 2032
- Figure 28: South America APAC Payment Gateway Market Volume (Billion), by End User 2024 & 2032
- Figure 29: South America APAC Payment Gateway Market Revenue Share (%), by End User 2024 & 2032
- Figure 30: South America APAC Payment Gateway Market Volume Share (%), by End User 2024 & 2032
- Figure 31: South America APAC Payment Gateway Market Revenue (Million), by Country 2024 & 2032
- Figure 32: South America APAC Payment Gateway Market Volume (Billion), by Country 2024 & 2032
- Figure 33: South America APAC Payment Gateway Market Revenue Share (%), by Country 2024 & 2032
- Figure 34: South America APAC Payment Gateway Market Volume Share (%), by Country 2024 & 2032
- Figure 35: Europe APAC Payment Gateway Market Revenue (Million), by Type 2024 & 2032
- Figure 36: Europe APAC Payment Gateway Market Volume (Billion), by Type 2024 & 2032
- Figure 37: Europe APAC Payment Gateway Market Revenue Share (%), by Type 2024 & 2032
- Figure 38: Europe APAC Payment Gateway Market Volume Share (%), by Type 2024 & 2032
- Figure 39: Europe APAC Payment Gateway Market Revenue (Million), by Enterprise 2024 & 2032
- Figure 40: Europe APAC Payment Gateway Market Volume (Billion), by Enterprise 2024 & 2032
- Figure 41: Europe APAC Payment Gateway Market Revenue Share (%), by Enterprise 2024 & 2032
- Figure 42: Europe APAC Payment Gateway Market Volume Share (%), by Enterprise 2024 & 2032
- Figure 43: Europe APAC Payment Gateway Market Revenue (Million), by End User 2024 & 2032
- Figure 44: Europe APAC Payment Gateway Market Volume (Billion), by End User 2024 & 2032
- Figure 45: Europe APAC Payment Gateway Market Revenue Share (%), by End User 2024 & 2032
- Figure 46: Europe APAC Payment Gateway Market Volume Share (%), by End User 2024 & 2032
- Figure 47: Europe APAC Payment Gateway Market Revenue (Million), by Country 2024 & 2032
- Figure 48: Europe APAC Payment Gateway Market Volume (Billion), by Country 2024 & 2032
- Figure 49: Europe APAC Payment Gateway Market Revenue Share (%), by Country 2024 & 2032
- Figure 50: Europe APAC Payment Gateway Market Volume Share (%), by Country 2024 & 2032
- Figure 51: Middle East & Africa APAC Payment Gateway Market Revenue (Million), by Type 2024 & 2032
- Figure 52: Middle East & Africa APAC Payment Gateway Market Volume (Billion), by Type 2024 & 2032
- Figure 53: Middle East & Africa APAC Payment Gateway Market Revenue Share (%), by Type 2024 & 2032
- Figure 54: Middle East & Africa APAC Payment Gateway Market Volume Share (%), by Type 2024 & 2032
- Figure 55: Middle East & Africa APAC Payment Gateway Market Revenue (Million), by Enterprise 2024 & 2032
- Figure 56: Middle East & Africa APAC Payment Gateway Market Volume (Billion), by Enterprise 2024 & 2032
- Figure 57: Middle East & Africa APAC Payment Gateway Market Revenue Share (%), by Enterprise 2024 & 2032
- Figure 58: Middle East & Africa APAC Payment Gateway Market Volume Share (%), by Enterprise 2024 & 2032
- Figure 59: Middle East & Africa APAC Payment Gateway Market Revenue (Million), by End User 2024 & 2032
- Figure 60: Middle East & Africa APAC Payment Gateway Market Volume (Billion), by End User 2024 & 2032
- Figure 61: Middle East & Africa APAC Payment Gateway Market Revenue Share (%), by End User 2024 & 2032
- Figure 62: Middle East & Africa APAC Payment Gateway Market Volume Share (%), by End User 2024 & 2032
- Figure 63: Middle East & Africa APAC Payment Gateway Market Revenue (Million), by Country 2024 & 2032
- Figure 64: Middle East & Africa APAC Payment Gateway Market Volume (Billion), by Country 2024 & 2032
- Figure 65: Middle East & Africa APAC Payment Gateway Market Revenue Share (%), by Country 2024 & 2032
- Figure 66: Middle East & Africa APAC Payment Gateway Market Volume Share (%), by Country 2024 & 2032
- Figure 67: Asia Pacific APAC Payment Gateway Market Revenue (Million), by Type 2024 & 2032
- Figure 68: Asia Pacific APAC Payment Gateway Market Volume (Billion), by Type 2024 & 2032
- Figure 69: Asia Pacific APAC Payment Gateway Market Revenue Share (%), by Type 2024 & 2032
- Figure 70: Asia Pacific APAC Payment Gateway Market Volume Share (%), by Type 2024 & 2032
- Figure 71: Asia Pacific APAC Payment Gateway Market Revenue (Million), by Enterprise 2024 & 2032
- Figure 72: Asia Pacific APAC Payment Gateway Market Volume (Billion), by Enterprise 2024 & 2032
- Figure 73: Asia Pacific APAC Payment Gateway Market Revenue Share (%), by Enterprise 2024 & 2032
- Figure 74: Asia Pacific APAC Payment Gateway Market Volume Share (%), by Enterprise 2024 & 2032
- Figure 75: Asia Pacific APAC Payment Gateway Market Revenue (Million), by End User 2024 & 2032
- Figure 76: Asia Pacific APAC Payment Gateway Market Volume (Billion), by End User 2024 & 2032
- Figure 77: Asia Pacific APAC Payment Gateway Market Revenue Share (%), by End User 2024 & 2032
- Figure 78: Asia Pacific APAC Payment Gateway Market Volume Share (%), by End User 2024 & 2032
- Figure 79: Asia Pacific APAC Payment Gateway Market Revenue (Million), by Country 2024 & 2032
- Figure 80: Asia Pacific APAC Payment Gateway Market Volume (Billion), by Country 2024 & 2032
- Figure 81: Asia Pacific APAC Payment Gateway Market Revenue Share (%), by Country 2024 & 2032
- Figure 82: Asia Pacific APAC Payment Gateway Market Volume Share (%), by Country 2024 & 2032
List of Tables
- Table 1: Global APAC Payment Gateway Market Revenue Million Forecast, by Region 2019 & 2032
- Table 2: Global APAC Payment Gateway Market Volume Billion Forecast, by Region 2019 & 2032
- Table 3: Global APAC Payment Gateway Market Revenue Million Forecast, by Type 2019 & 2032
- Table 4: Global APAC Payment Gateway Market Volume Billion Forecast, by Type 2019 & 2032
- Table 5: Global APAC Payment Gateway Market Revenue Million Forecast, by Enterprise 2019 & 2032
- Table 6: Global APAC Payment Gateway Market Volume Billion Forecast, by Enterprise 2019 & 2032
- Table 7: Global APAC Payment Gateway Market Revenue Million Forecast, by End User 2019 & 2032
- Table 8: Global APAC Payment Gateway Market Volume Billion Forecast, by End User 2019 & 2032
- Table 9: Global APAC Payment Gateway Market Revenue Million Forecast, by Region 2019 & 2032
- Table 10: Global APAC Payment Gateway Market Volume Billion Forecast, by Region 2019 & 2032
- Table 11: Global APAC Payment Gateway Market Revenue Million Forecast, by Type 2019 & 2032
- Table 12: Global APAC Payment Gateway Market Volume Billion Forecast, by Type 2019 & 2032
- Table 13: Global APAC Payment Gateway Market Revenue Million Forecast, by Enterprise 2019 & 2032
- Table 14: Global APAC Payment Gateway Market Volume Billion Forecast, by Enterprise 2019 & 2032
- Table 15: Global APAC Payment Gateway Market Revenue Million Forecast, by End User 2019 & 2032
- Table 16: Global APAC Payment Gateway Market Volume Billion Forecast, by End User 2019 & 2032
- Table 17: Global APAC Payment Gateway Market Revenue Million Forecast, by Country 2019 & 2032
- Table 18: Global APAC Payment Gateway Market Volume Billion Forecast, by Country 2019 & 2032
- Table 19: United States APAC Payment Gateway Market Revenue (Million) Forecast, by Application 2019 & 2032
- Table 20: United States APAC Payment Gateway Market Volume (Billion) Forecast, by Application 2019 & 2032
- Table 21: Canada APAC Payment Gateway Market Revenue (Million) Forecast, by Application 2019 & 2032
- Table 22: Canada APAC Payment Gateway Market Volume (Billion) Forecast, by Application 2019 & 2032
- Table 23: Mexico APAC Payment Gateway Market Revenue (Million) Forecast, by Application 2019 & 2032
- Table 24: Mexico APAC Payment Gateway Market Volume (Billion) Forecast, by Application 2019 & 2032
- Table 25: Global APAC Payment Gateway Market Revenue Million Forecast, by Type 2019 & 2032
- Table 26: Global APAC Payment Gateway Market Volume Billion Forecast, by Type 2019 & 2032
- Table 27: Global APAC Payment Gateway Market Revenue Million Forecast, by Enterprise 2019 & 2032
- Table 28: Global APAC Payment Gateway Market Volume Billion Forecast, by Enterprise 2019 & 2032
- Table 29: Global APAC Payment Gateway Market Revenue Million Forecast, by End User 2019 & 2032
- Table 30: Global APAC Payment Gateway Market Volume Billion Forecast, by End User 2019 & 2032
- Table 31: Global APAC Payment Gateway Market Revenue Million Forecast, by Country 2019 & 2032
- Table 32: Global APAC Payment Gateway Market Volume Billion Forecast, by Country 2019 & 2032
- Table 33: Brazil APAC Payment Gateway Market Revenue (Million) Forecast, by Application 2019 & 2032
- Table 34: Brazil APAC Payment Gateway Market Volume (Billion) Forecast, by Application 2019 & 2032
- Table 35: Argentina APAC Payment Gateway Market Revenue (Million) Forecast, by Application 2019 & 2032
- Table 36: Argentina APAC Payment Gateway Market Volume (Billion) Forecast, by Application 2019 & 2032
- Table 37: Rest of South America APAC Payment Gateway Market Revenue (Million) Forecast, by Application 2019 & 2032
- Table 38: Rest of South America APAC Payment Gateway Market Volume (Billion) Forecast, by Application 2019 & 2032
- Table 39: Global APAC Payment Gateway Market Revenue Million Forecast, by Type 2019 & 2032
- Table 40: Global APAC Payment Gateway Market Volume Billion Forecast, by Type 2019 & 2032
- Table 41: Global APAC Payment Gateway Market Revenue Million Forecast, by Enterprise 2019 & 2032
- Table 42: Global APAC Payment Gateway Market Volume Billion Forecast, by Enterprise 2019 & 2032
- Table 43: Global APAC Payment Gateway Market Revenue Million Forecast, by End User 2019 & 2032
- Table 44: Global APAC Payment Gateway Market Volume Billion Forecast, by End User 2019 & 2032
- Table 45: Global APAC Payment Gateway Market Revenue Million Forecast, by Country 2019 & 2032
- Table 46: Global APAC Payment Gateway Market Volume Billion Forecast, by Country 2019 & 2032
- Table 47: United Kingdom APAC Payment Gateway Market Revenue (Million) Forecast, by Application 2019 & 2032
- Table 48: United Kingdom APAC Payment Gateway Market Volume (Billion) Forecast, by Application 2019 & 2032
- Table 49: Germany APAC Payment Gateway Market Revenue (Million) Forecast, by Application 2019 & 2032
- Table 50: Germany APAC Payment Gateway Market Volume (Billion) Forecast, by Application 2019 & 2032
- Table 51: France APAC Payment Gateway Market Revenue (Million) Forecast, by Application 2019 & 2032
- Table 52: France APAC Payment Gateway Market Volume (Billion) Forecast, by Application 2019 & 2032
- Table 53: Italy APAC Payment Gateway Market Revenue (Million) Forecast, by Application 2019 & 2032
- Table 54: Italy APAC Payment Gateway Market Volume (Billion) Forecast, by Application 2019 & 2032
- Table 55: Spain APAC Payment Gateway Market Revenue (Million) Forecast, by Application 2019 & 2032
- Table 56: Spain APAC Payment Gateway Market Volume (Billion) Forecast, by Application 2019 & 2032
- Table 57: Russia APAC Payment Gateway Market Revenue (Million) Forecast, by Application 2019 & 2032
- Table 58: Russia APAC Payment Gateway Market Volume (Billion) Forecast, by Application 2019 & 2032
- Table 59: Benelux APAC Payment Gateway Market Revenue (Million) Forecast, by Application 2019 & 2032
- Table 60: Benelux APAC Payment Gateway Market Volume (Billion) Forecast, by Application 2019 & 2032
- Table 61: Nordics APAC Payment Gateway Market Revenue (Million) Forecast, by Application 2019 & 2032
- Table 62: Nordics APAC Payment Gateway Market Volume (Billion) Forecast, by Application 2019 & 2032
- Table 63: Rest of Europe APAC Payment Gateway Market Revenue (Million) Forecast, by Application 2019 & 2032
- Table 64: Rest of Europe APAC Payment Gateway Market Volume (Billion) Forecast, by Application 2019 & 2032
- Table 65: Global APAC Payment Gateway Market Revenue Million Forecast, by Type 2019 & 2032
- Table 66: Global APAC Payment Gateway Market Volume Billion Forecast, by Type 2019 & 2032
- Table 67: Global APAC Payment Gateway Market Revenue Million Forecast, by Enterprise 2019 & 2032
- Table 68: Global APAC Payment Gateway Market Volume Billion Forecast, by Enterprise 2019 & 2032
- Table 69: Global APAC Payment Gateway Market Revenue Million Forecast, by End User 2019 & 2032
- Table 70: Global APAC Payment Gateway Market Volume Billion Forecast, by End User 2019 & 2032
- Table 71: Global APAC Payment Gateway Market Revenue Million Forecast, by Country 2019 & 2032
- Table 72: Global APAC Payment Gateway Market Volume Billion Forecast, by Country 2019 & 2032
- Table 73: Turkey APAC Payment Gateway Market Revenue (Million) Forecast, by Application 2019 & 2032
- Table 74: Turkey APAC Payment Gateway Market Volume (Billion) Forecast, by Application 2019 & 2032
- Table 75: Israel APAC Payment Gateway Market Revenue (Million) Forecast, by Application 2019 & 2032
- Table 76: Israel APAC Payment Gateway Market Volume (Billion) Forecast, by Application 2019 & 2032
- Table 77: GCC APAC Payment Gateway Market Revenue (Million) Forecast, by Application 2019 & 2032
- Table 78: GCC APAC Payment Gateway Market Volume (Billion) Forecast, by Application 2019 & 2032
- Table 79: North Africa APAC Payment Gateway Market Revenue (Million) Forecast, by Application 2019 & 2032
- Table 80: North Africa APAC Payment Gateway Market Volume (Billion) Forecast, by Application 2019 & 2032
- Table 81: South Africa APAC Payment Gateway Market Revenue (Million) Forecast, by Application 2019 & 2032
- Table 82: South Africa APAC Payment Gateway Market Volume (Billion) Forecast, by Application 2019 & 2032
- Table 83: Rest of Middle East & Africa APAC Payment Gateway Market Revenue (Million) Forecast, by Application 2019 & 2032
- Table 84: Rest of Middle East & Africa APAC Payment Gateway Market Volume (Billion) Forecast, by Application 2019 & 2032
- Table 85: Global APAC Payment Gateway Market Revenue Million Forecast, by Type 2019 & 2032
- Table 86: Global APAC Payment Gateway Market Volume Billion Forecast, by Type 2019 & 2032
- Table 87: Global APAC Payment Gateway Market Revenue Million Forecast, by Enterprise 2019 & 2032
- Table 88: Global APAC Payment Gateway Market Volume Billion Forecast, by Enterprise 2019 & 2032
- Table 89: Global APAC Payment Gateway Market Revenue Million Forecast, by End User 2019 & 2032
- Table 90: Global APAC Payment Gateway Market Volume Billion Forecast, by End User 2019 & 2032
- Table 91: Global APAC Payment Gateway Market Revenue Million Forecast, by Country 2019 & 2032
- Table 92: Global APAC Payment Gateway Market Volume Billion Forecast, by Country 2019 & 2032
- Table 93: China APAC Payment Gateway Market Revenue (Million) Forecast, by Application 2019 & 2032
- Table 94: China APAC Payment Gateway Market Volume (Billion) Forecast, by Application 2019 & 2032
- Table 95: India APAC Payment Gateway Market Revenue (Million) Forecast, by Application 2019 & 2032
- Table 96: India APAC Payment Gateway Market Volume (Billion) Forecast, by Application 2019 & 2032
- Table 97: Japan APAC Payment Gateway Market Revenue (Million) Forecast, by Application 2019 & 2032
- Table 98: Japan APAC Payment Gateway Market Volume (Billion) Forecast, by Application 2019 & 2032
- Table 99: South Korea APAC Payment Gateway Market Revenue (Million) Forecast, by Application 2019 & 2032
- Table 100: South Korea APAC Payment Gateway Market Volume (Billion) Forecast, by Application 2019 & 2032
- Table 101: ASEAN APAC Payment Gateway Market Revenue (Million) Forecast, by Application 2019 & 2032
- Table 102: ASEAN APAC Payment Gateway Market Volume (Billion) Forecast, by Application 2019 & 2032
- Table 103: Oceania APAC Payment Gateway Market Revenue (Million) Forecast, by Application 2019 & 2032
- Table 104: Oceania APAC Payment Gateway Market Volume (Billion) Forecast, by Application 2019 & 2032
- Table 105: Rest of Asia Pacific APAC Payment Gateway Market Revenue (Million) Forecast, by Application 2019 & 2032
- Table 106: Rest of Asia Pacific APAC Payment Gateway Market Volume (Billion) Forecast, by Application 2019 & 2032
Frequently Asked Questions
1. What is the projected Compound Annual Growth Rate (CAGR) of the APAC Payment Gateway Market?
The projected CAGR is approximately 21.89%.
2. Which companies are prominent players in the APAC Payment Gateway Market?
Key companies in the market include PayPal, Stripe, MasterCard, Amazon Pay, PhonePay, GooglePay, RazorPay, AsiaPay, 2Checkout com Inc, Eway*List Not Exhaustive.
3. What are the main segments of the APAC Payment Gateway Market?
The market segments include Type, Enterprise, End User.
4. Can you provide details about the market size?
The market size is estimated to be USD 10.67 Million as of 2022.
5. What are some drivers contributing to market growth?
Increased E-commerce Sales and High Internet Penetration Rate; Increased Demand for Mobile-based Payments; Growing Adoption of Payment Gateways in Retail.
6. What are the notable trends driving market growth?
Growing Use of Payment Gateway in Tavel Industry..
7. Are there any restraints impacting market growth?
Increased E-commerce Sales and High Internet Penetration Rate; Increased Demand for Mobile-based Payments; Growing Adoption of Payment Gateways in Retail.
8. Can you provide examples of recent developments in the market?
May 2024: Mastercard officially rolled out its domestic payment processing services in China. Through its joint venture, Mastercard NetsUnion Information Technology, the company can now process payments made with Mastercard cards issued by Chinese banks. The payment services provider can also accept Mastercard-branded cards from China for international transactions.April 2024: Soft Space, a fintech-as-a-service provider, teamed up with JCB, a prominent international payments brand from Japan, to introduce a payment gateway in Malaysia. The new gateway addresses the surging demand for secure digital transactions by leveraging JCB's expansive global network and Soft Space's advanced technical expertise. Furthermore, Soft Space's API specification empowers acquirers and payment facilitators, enabling retail merchants to tap into JCB's vast network serving over 156 million card members—without needing a direct connection.
9. What pricing options are available for accessing the report?
Pricing options include single-user, multi-user, and enterprise licenses priced at USD 3800, USD 4500, and USD 5800 respectively.
10. Is the market size provided in terms of value or volume?
The market size is provided in terms of value, measured in Million and volume, measured in Billion.
11. Are there any specific market keywords associated with the report?
Yes, the market keyword associated with the report is "APAC Payment Gateway Market," which aids in identifying and referencing the specific market segment covered.
12. How do I determine which pricing option suits my needs best?
The pricing options vary based on user requirements and access needs. Individual users may opt for single-user licenses, while businesses requiring broader access may choose multi-user or enterprise licenses for cost-effective access to the report.
13. Are there any additional resources or data provided in the APAC Payment Gateway Market report?
While the report offers comprehensive insights, it's advisable to review the specific contents or supplementary materials provided to ascertain if additional resources or data are available.
14. How can I stay updated on further developments or reports in the APAC Payment Gateway Market?
To stay informed about further developments, trends, and reports in the APAC Payment Gateway Market, consider subscribing to industry newsletters, following relevant companies and organizations, or regularly checking reputable industry news sources and publications.
Methodology
Step 1 - Identification of Relevant Samples Size from Population Database


Step 2 - Approaches for Defining Global Market Size (Value, Volume* & Price*)

Note*: In applicable scenarios
Step 3 - Data Sources
Primary Research
- Web Analytics
- Survey Reports
- Research Institute
- Latest Research Reports
- Opinion Leaders
Secondary Research
- Annual Reports
- White Paper
- Latest Press Release
- Industry Association
- Paid Database
- Investor Presentations

Step 4 - Data Triangulation
Involves using different sources of information in order to increase the validity of a study
These sources are likely to be stakeholders in a program - participants, other researchers, program staff, other community members, and so on.
Then we put all data in single framework & apply various statistical tools to find out the dynamic on the market.
During the analysis stage, feedback from the stakeholder groups would be compared to determine areas of agreement as well as areas of divergence
