

Key Insights
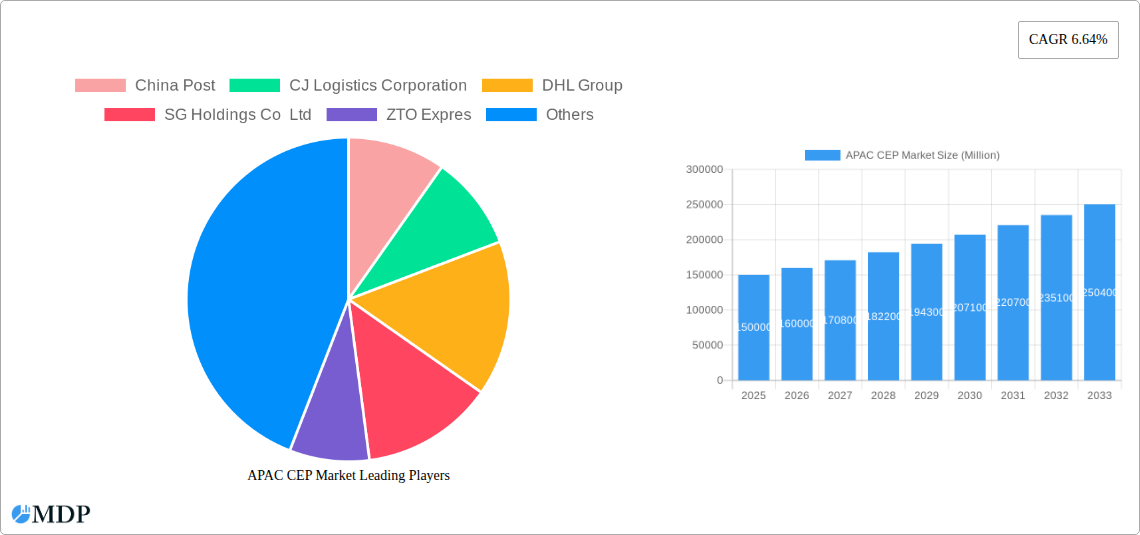
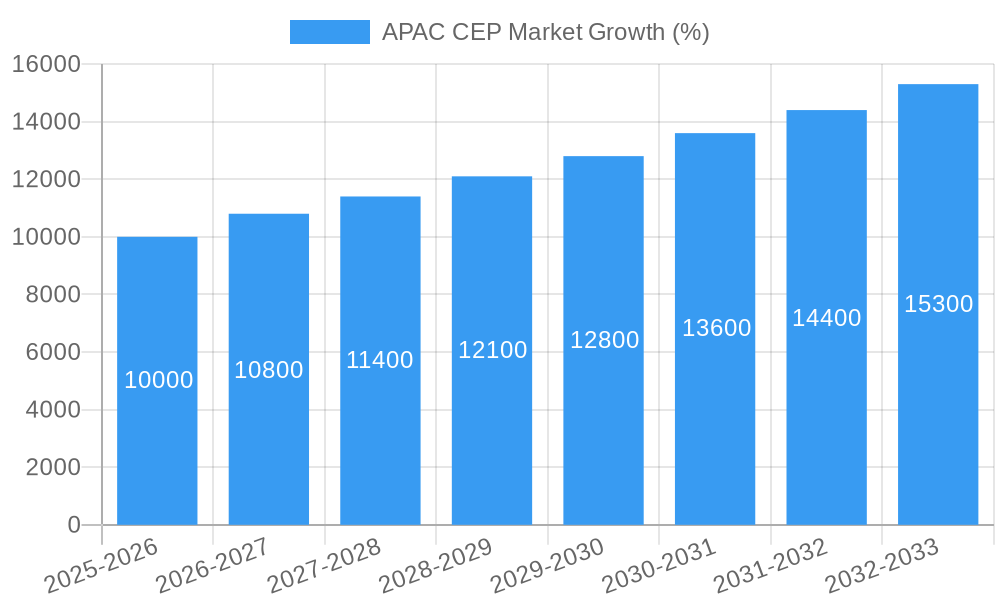
The Asia-Pacific (APAC) Courier, Express, and Parcel (CEP) market is experiencing robust growth, driven by the region's expanding e-commerce sector, increasing cross-border trade, and the rising adoption of advanced logistics technologies. The market's Compound Annual Growth Rate (CAGR) of 6.64% indicates a significant expansion trajectory from 2019 to 2033. Key growth drivers include the rapid urbanization and rising disposable incomes across many APAC nations, fueling consumer demand for faster and more reliable delivery services. The increasing prevalence of B2C e-commerce transactions, especially in countries like China, India, and Indonesia, is a major catalyst. Furthermore, businesses across various sectors, including e-commerce, BFSI, healthcare, and manufacturing, are increasingly relying on efficient CEP services for their supply chain management. While factors such as fluctuating fuel prices and stringent regulatory environments present challenges, the overall market outlook remains positive, fueled by continuous technological advancements, including automation and improved tracking capabilities.
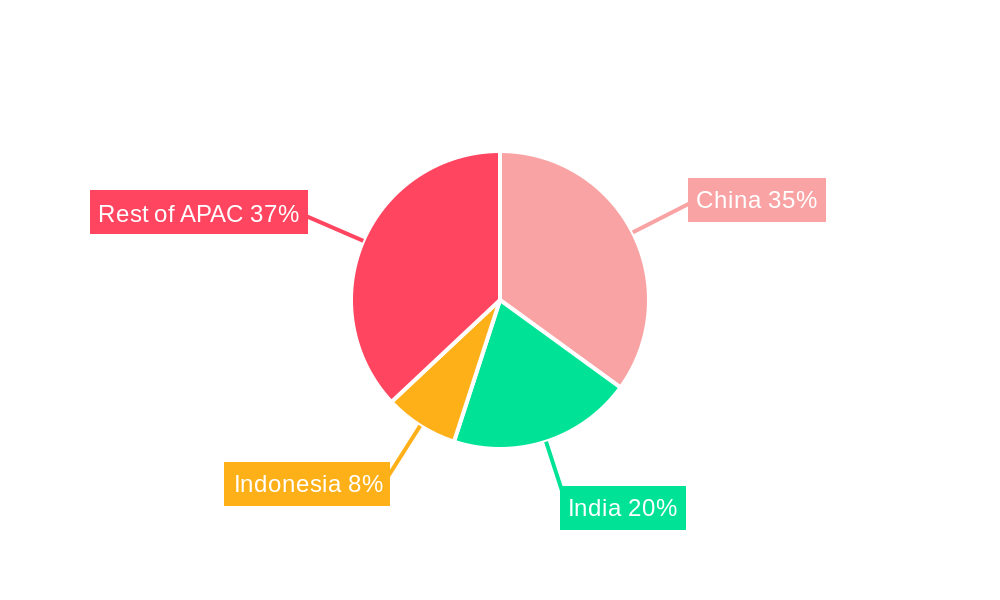
The segmentation of the APAC CEP market reveals distinct trends. The air mode of transport dominates the express delivery segment, while road transport accounts for a significant portion of non-express deliveries. E-commerce is the largest end-user industry, followed by the BFSI and healthcare sectors. China and India are the largest national markets, exhibiting substantial growth potential due to their vast populations and burgeoning economies. The B2C model is the most prominent, highlighting the dominance of consumer-driven demand. While data on specific shipment weight segments isn’t provided, it's reasonable to assume that light and medium-weight shipments comprise the majority given the e-commerce dominance. Major players, such as China Post, DHL, FedEx, and UPS, are strategically investing in infrastructure and technology to maintain their market share and cater to the increasing demand for faster and more efficient delivery solutions. The forecast period (2025-2033) promises further expansion, driven by ongoing digital transformation and evolving consumer expectations.
APAC CEP Market Report: 2019-2033 Forecast
This comprehensive report provides an in-depth analysis of the Asia-Pacific (APAC) Courier, Express, and Parcel (CEP) market, offering invaluable insights for stakeholders across the industry. With a study period spanning 2019-2033, a base year of 2025, and a forecast period of 2025-2033, this report meticulously examines market dynamics, trends, leading players, and future opportunities. The market size is predicted to reach xx Million by 2033, showcasing significant growth potential. This report is essential for businesses looking to navigate the complexities of this rapidly evolving sector and capitalize on emerging opportunities.
APAC CEP Market Market Dynamics & Concentration
The APAC CEP market is characterized by a dynamic interplay of factors influencing its growth and concentration. Market concentration is moderately high, with a few dominant players holding significant market share, while numerous smaller players compete for niche segments. In 2024, the top 5 players held an estimated xx% market share collectively. Innovation is a key driver, with companies investing heavily in technologies like AI-powered logistics and automation to enhance efficiency and delivery speed. Regulatory frameworks, varying across countries in the region, impact operational costs and market access. The rise of e-commerce is a major growth catalyst, creating substantial demand for express delivery services. Product substitutes, such as postal services, exist but often lack the speed and reliability of CEP solutions. Furthermore, the market witnesses significant M&A activity, with an estimated xx M&A deals in the last 5 years, signaling consolidation and expansion strategies.
- Market Concentration: Top 5 players hold approximately xx% market share (2024).
- Innovation Drivers: AI-powered logistics, automation, drone delivery.
- Regulatory Frameworks: Varying regulations across APAC nations impact operational costs.
- Product Substitutes: Traditional postal services, but limited speed and reliability.
- End-User Trends: Booming e-commerce drives significant demand.
- M&A Activity: Approximately xx M&A deals recorded in the last five years.
APAC CEP Market Industry Trends & Analysis
The APAC CEP market exhibits robust growth, driven by the explosive growth of e-commerce, rapid urbanization, and rising disposable incomes. The market is experiencing a compound annual growth rate (CAGR) of xx% during the forecast period (2025-2033). Technological disruptions, such as the implementation of AI and big data analytics for route optimization and predictive maintenance, are reshaping the industry. Consumer preferences are shifting towards faster delivery options, increased transparency, and improved customer service. The competitive landscape is characterized by intense rivalry, with established players and new entrants vying for market share through price competition, service innovation, and strategic partnerships. Market penetration for express delivery services is increasing steadily, particularly in rapidly developing economies.
Leading Markets & Segments in APAC CEP Market
China remains the dominant market in the APAC CEP sector, accounting for approximately xx% of the total market revenue in 2024. This dominance is driven by its massive population, burgeoning e-commerce sector, and robust infrastructure investments. India and other Southeast Asian nations also show significant growth potential.
- Dominant Region: China (xx% of total market revenue in 2024).
- Leading Segments:
- Mode of Transport: Road (xx Million) dominates due to extensive road networks, followed by Air (xx Million) for faster delivery and then Others (xx Million).
- End-User Industry: E-commerce (xx Million) leads, followed by Wholesale and Retail Trade (Offline) (xx Million), and Healthcare (xx Million).
- Destination: Domestic shipments (xx Million) far outweigh International shipments (xx Million).
- Speed of Delivery: Express delivery (xx Million) is the dominant segment due to the increased demand for quick deliveries.
- Model: B2C (xx Million) is the leading model due to the exponential growth in e-commerce, followed by B2B (xx Million).
- Shipment Weight: Light Weight Shipments (xx Million) dominates due to the nature of e-commerce shipments.
Key drivers vary across regions; China's growth is fueled by robust infrastructure development and government policies, while India's market expansion is driven by increasing smartphone penetration and digital adoption. Specific policies and infrastructural advancements contribute heavily to the market’s dynamism.
APAC CEP Market Product Developments
The APAC CEP market is witnessing a wave of product innovations, primarily driven by technological advancements. Companies are integrating AI, IoT, and big data analytics to optimize delivery routes, enhance tracking capabilities, and improve overall efficiency. This leads to improved delivery times, enhanced transparency, and reduced operational costs. New products focus on catering to specific needs of e-commerce businesses, such as automated sorting systems and last-mile delivery solutions, offering competitive advantages.
Key Drivers of APAC CEP Market Growth
The APAC CEP market's growth is driven by several factors:
- E-commerce boom: The rapid expansion of online shopping fuels demand for efficient delivery services.
- Technological advancements: AI, automation, and IoT enhance efficiency and reduce costs.
- Rising disposable incomes: Increased purchasing power supports higher spending on goods and services, including express deliveries.
- Favorable government policies: supportive regulations boost market development.
- Improved infrastructure: better transportation networks facilitate faster delivery.
Challenges in the APAC CEP Market Market
The APAC CEP market faces several challenges:
- Varying regulatory landscapes: inconsistent rules across countries increase operational complexity.
- Supply chain disruptions: geopolitical uncertainties and natural disasters affect delivery reliability.
- Intense competition: price wars and service differentiation pressures profit margins. Smaller players face significant challenges competing with the larger corporations.
- Infrastructure limitations: underdeveloped logistics infrastructure in some areas hinder efficient delivery.
Emerging Opportunities in APAP CEP Market
The APAC CEP market presents various opportunities:
- Growth of cross-border e-commerce: expanding international trade requires efficient and reliable delivery solutions.
- Technological innovation: AI, drone delivery, and other technologies offer opportunities for cost reduction and service enhancement.
- Strategic partnerships: collaborations between CEP providers and e-commerce platforms can lead to mutually beneficial growth.
- Market expansion into less-penetrated areas: untapped markets in rural areas and emerging economies represent significant growth potential.
Leading Players in the APAC CEP Market Sector
- China Post
- CJ Logistics Corporation
- DHL Group
- SG Holdings Co Ltd
- ZTO Express
- FedEx
- United Parcel Service of America Inc (UPS)
- YTO Express
- Yamato Holdings
- SF Express (KEX-SF)
- Blue Dart Express
- DTDC Express Limited
- Toll Group
- JWD Group
Key Milestones in APAC CEP Market Industry
- June 2023: China Post launches its first integrated indoor and outdoor “Robot Plus” AI delivery solution, significantly enhancing last-mile delivery efficiency.
- April 2023: China Post and Ping An Bank launch an intelligent archives service center, integrating auto finance and express logistics.
- March 2023: Colowide MD Co. Ltd. and Yamato Transport Co. Ltd. agree to optimize the Colowide Group's supply chain, showcasing collaboration for improved logistics.
Strategic Outlook for APAC CEP Market Market
The APAC CEP market holds immense potential for future growth, driven by sustained e-commerce expansion, technological advancements, and strategic partnerships. Companies that invest in innovative technologies, optimize their operations, and adapt to evolving consumer preferences are poised to capture a significant share of this expanding market. Focus on last-mile delivery solutions, cross-border logistics, and sustainable practices will be crucial for long-term success.
APAC CEP Market Segmentation
-
1. Destination
- 1.1. Domestic
- 1.2. International
-
2. Speed Of Delivery
- 2.1. Express
- 2.2. Non-Express
-
3. Model
- 3.1. Business-to-Business (B2B)
- 3.2. Business-to-Consumer (B2C)
- 3.3. Consumer-to-Consumer (C2C)
-
4. Shipment Weight
- 4.1. Heavy Weight Shipments
- 4.2. Light Weight Shipments
- 4.3. Medium Weight Shipments
-
5. Mode Of Transport
- 5.1. Air
- 5.2. Road
- 5.3. Others
-
6. End User Industry
- 6.1. E-Commerce
- 6.2. Financial Services (BFSI)
- 6.3. Healthcare
- 6.4. Manufacturing
- 6.5. Primary Industry
- 6.6. Wholesale and Retail Trade (Offline)
- 6.7. Others
APAC CEP Market Segmentation By Geography
-
1. North America
- 1.1. United States
- 1.2. Canada
- 1.3. Mexico
-
2. South America
- 2.1. Brazil
- 2.2. Argentina
- 2.3. Rest of South America
-
3. Europe
- 3.1. United Kingdom
- 3.2. Germany
- 3.3. France
- 3.4. Italy
- 3.5. Spain
- 3.6. Russia
- 3.7. Benelux
- 3.8. Nordics
- 3.9. Rest of Europe
-
4. Middle East & Africa
- 4.1. Turkey
- 4.2. Israel
- 4.3. GCC
- 4.4. North Africa
- 4.5. South Africa
- 4.6. Rest of Middle East & Africa
-
5. Asia Pacific
- 5.1. China
- 5.2. India
- 5.3. Japan
- 5.4. South Korea
- 5.5. ASEAN
- 5.6. Oceania
- 5.7. Rest of Asia Pacific
APAC CEP Market REPORT HIGHLIGHTS
| Aspects | Details |
|---|---|
| Study Period | 2019-2033 |
| Base Year | 2024 |
| Estimated Year | 2025 |
| Forecast Period | 2025-2033 |
| Historical Period | 2019-2024 |
| Growth Rate | CAGR of 6.64% from 2019-2033 |
| Segmentation |
|
Table of Contents
- 1. Introduction
- 1.1. Research Scope
- 1.2. Market Segmentation
- 1.3. Research Methodology
- 1.4. Definitions and Assumptions
- 2. Executive Summary
- 2.1. Introduction
- 3. Market Dynamics
- 3.1. Introduction
- 3.2. Market Drivers
- 3.2.1. E-commerce Fueling the Growth of 3PL Market
- 3.3. Market Restrains
- 3.3.1. Slow Infrastructure Development
- 3.4. Market Trends
- 3.4.1. OTHER KEY INDUSTRY TRENDS COVERED IN THE REPORT
- 4. Market Factor Analysis
- 4.1. Porters Five Forces
- 4.2. Supply/Value Chain
- 4.3. PESTEL analysis
- 4.4. Market Entropy
- 4.5. Patent/Trademark Analysis
- 5. Global APAC CEP Market Analysis, Insights and Forecast, 2019-2031
- 5.1. Market Analysis, Insights and Forecast - by Destination
- 5.1.1. Domestic
- 5.1.2. International
- 5.2. Market Analysis, Insights and Forecast - by Speed Of Delivery
- 5.2.1. Express
- 5.2.2. Non-Express
- 5.3. Market Analysis, Insights and Forecast - by Model
- 5.3.1. Business-to-Business (B2B)
- 5.3.2. Business-to-Consumer (B2C)
- 5.3.3. Consumer-to-Consumer (C2C)
- 5.4. Market Analysis, Insights and Forecast - by Shipment Weight
- 5.4.1. Heavy Weight Shipments
- 5.4.2. Light Weight Shipments
- 5.4.3. Medium Weight Shipments
- 5.5. Market Analysis, Insights and Forecast - by Mode Of Transport
- 5.5.1. Air
- 5.5.2. Road
- 5.5.3. Others
- 5.6. Market Analysis, Insights and Forecast - by End User Industry
- 5.6.1. E-Commerce
- 5.6.2. Financial Services (BFSI)
- 5.6.3. Healthcare
- 5.6.4. Manufacturing
- 5.6.5. Primary Industry
- 5.6.6. Wholesale and Retail Trade (Offline)
- 5.6.7. Others
- 5.7. Market Analysis, Insights and Forecast - by Region
- 5.7.1. North America
- 5.7.2. South America
- 5.7.3. Europe
- 5.7.4. Middle East & Africa
- 5.7.5. Asia Pacific
- 5.1. Market Analysis, Insights and Forecast - by Destination
- 6. North America APAC CEP Market Analysis, Insights and Forecast, 2019-2031
- 6.1. Market Analysis, Insights and Forecast - by Destination
- 6.1.1. Domestic
- 6.1.2. International
- 6.2. Market Analysis, Insights and Forecast - by Speed Of Delivery
- 6.2.1. Express
- 6.2.2. Non-Express
- 6.3. Market Analysis, Insights and Forecast - by Model
- 6.3.1. Business-to-Business (B2B)
- 6.3.2. Business-to-Consumer (B2C)
- 6.3.3. Consumer-to-Consumer (C2C)
- 6.4. Market Analysis, Insights and Forecast - by Shipment Weight
- 6.4.1. Heavy Weight Shipments
- 6.4.2. Light Weight Shipments
- 6.4.3. Medium Weight Shipments
- 6.5. Market Analysis, Insights and Forecast - by Mode Of Transport
- 6.5.1. Air
- 6.5.2. Road
- 6.5.3. Others
- 6.6. Market Analysis, Insights and Forecast - by End User Industry
- 6.6.1. E-Commerce
- 6.6.2. Financial Services (BFSI)
- 6.6.3. Healthcare
- 6.6.4. Manufacturing
- 6.6.5. Primary Industry
- 6.6.6. Wholesale and Retail Trade (Offline)
- 6.6.7. Others
- 6.1. Market Analysis, Insights and Forecast - by Destination
- 7. South America APAC CEP Market Analysis, Insights and Forecast, 2019-2031
- 7.1. Market Analysis, Insights and Forecast - by Destination
- 7.1.1. Domestic
- 7.1.2. International
- 7.2. Market Analysis, Insights and Forecast - by Speed Of Delivery
- 7.2.1. Express
- 7.2.2. Non-Express
- 7.3. Market Analysis, Insights and Forecast - by Model
- 7.3.1. Business-to-Business (B2B)
- 7.3.2. Business-to-Consumer (B2C)
- 7.3.3. Consumer-to-Consumer (C2C)
- 7.4. Market Analysis, Insights and Forecast - by Shipment Weight
- 7.4.1. Heavy Weight Shipments
- 7.4.2. Light Weight Shipments
- 7.4.3. Medium Weight Shipments
- 7.5. Market Analysis, Insights and Forecast - by Mode Of Transport
- 7.5.1. Air
- 7.5.2. Road
- 7.5.3. Others
- 7.6. Market Analysis, Insights and Forecast - by End User Industry
- 7.6.1. E-Commerce
- 7.6.2. Financial Services (BFSI)
- 7.6.3. Healthcare
- 7.6.4. Manufacturing
- 7.6.5. Primary Industry
- 7.6.6. Wholesale and Retail Trade (Offline)
- 7.6.7. Others
- 7.1. Market Analysis, Insights and Forecast - by Destination
- 8. Europe APAC CEP Market Analysis, Insights and Forecast, 2019-2031
- 8.1. Market Analysis, Insights and Forecast - by Destination
- 8.1.1. Domestic
- 8.1.2. International
- 8.2. Market Analysis, Insights and Forecast - by Speed Of Delivery
- 8.2.1. Express
- 8.2.2. Non-Express
- 8.3. Market Analysis, Insights and Forecast - by Model
- 8.3.1. Business-to-Business (B2B)
- 8.3.2. Business-to-Consumer (B2C)
- 8.3.3. Consumer-to-Consumer (C2C)
- 8.4. Market Analysis, Insights and Forecast - by Shipment Weight
- 8.4.1. Heavy Weight Shipments
- 8.4.2. Light Weight Shipments
- 8.4.3. Medium Weight Shipments
- 8.5. Market Analysis, Insights and Forecast - by Mode Of Transport
- 8.5.1. Air
- 8.5.2. Road
- 8.5.3. Others
- 8.6. Market Analysis, Insights and Forecast - by End User Industry
- 8.6.1. E-Commerce
- 8.6.2. Financial Services (BFSI)
- 8.6.3. Healthcare
- 8.6.4. Manufacturing
- 8.6.5. Primary Industry
- 8.6.6. Wholesale and Retail Trade (Offline)
- 8.6.7. Others
- 8.1. Market Analysis, Insights and Forecast - by Destination
- 9. Middle East & Africa APAC CEP Market Analysis, Insights and Forecast, 2019-2031
- 9.1. Market Analysis, Insights and Forecast - by Destination
- 9.1.1. Domestic
- 9.1.2. International
- 9.2. Market Analysis, Insights and Forecast - by Speed Of Delivery
- 9.2.1. Express
- 9.2.2. Non-Express
- 9.3. Market Analysis, Insights and Forecast - by Model
- 9.3.1. Business-to-Business (B2B)
- 9.3.2. Business-to-Consumer (B2C)
- 9.3.3. Consumer-to-Consumer (C2C)
- 9.4. Market Analysis, Insights and Forecast - by Shipment Weight
- 9.4.1. Heavy Weight Shipments
- 9.4.2. Light Weight Shipments
- 9.4.3. Medium Weight Shipments
- 9.5. Market Analysis, Insights and Forecast - by Mode Of Transport
- 9.5.1. Air
- 9.5.2. Road
- 9.5.3. Others
- 9.6. Market Analysis, Insights and Forecast - by End User Industry
- 9.6.1. E-Commerce
- 9.6.2. Financial Services (BFSI)
- 9.6.3. Healthcare
- 9.6.4. Manufacturing
- 9.6.5. Primary Industry
- 9.6.6. Wholesale and Retail Trade (Offline)
- 9.6.7. Others
- 9.1. Market Analysis, Insights and Forecast - by Destination
- 10. Asia Pacific APAC CEP Market Analysis, Insights and Forecast, 2019-2031
- 10.1. Market Analysis, Insights and Forecast - by Destination
- 10.1.1. Domestic
- 10.1.2. International
- 10.2. Market Analysis, Insights and Forecast - by Speed Of Delivery
- 10.2.1. Express
- 10.2.2. Non-Express
- 10.3. Market Analysis, Insights and Forecast - by Model
- 10.3.1. Business-to-Business (B2B)
- 10.3.2. Business-to-Consumer (B2C)
- 10.3.3. Consumer-to-Consumer (C2C)
- 10.4. Market Analysis, Insights and Forecast - by Shipment Weight
- 10.4.1. Heavy Weight Shipments
- 10.4.2. Light Weight Shipments
- 10.4.3. Medium Weight Shipments
- 10.5. Market Analysis, Insights and Forecast - by Mode Of Transport
- 10.5.1. Air
- 10.5.2. Road
- 10.5.3. Others
- 10.6. Market Analysis, Insights and Forecast - by End User Industry
- 10.6.1. E-Commerce
- 10.6.2. Financial Services (BFSI)
- 10.6.3. Healthcare
- 10.6.4. Manufacturing
- 10.6.5. Primary Industry
- 10.6.6. Wholesale and Retail Trade (Offline)
- 10.6.7. Others
- 10.1. Market Analysis, Insights and Forecast - by Destination
- 11. Netherland APAC CEP Market Analysis, Insights and Forecast, 2019-2031
- 11.1. Market Analysis, Insights and Forecast - By Country/Sub-region
- 11.1.1.
- 12. Germany APAC CEP Market Analysis, Insights and Forecast, 2019-2031
- 12.1. Market Analysis, Insights and Forecast - By Country/Sub-region
- 12.1.1.
- 13. Begium APAC CEP Market Analysis, Insights and Forecast, 2019-2031
- 13.1. Market Analysis, Insights and Forecast - By Country/Sub-region
- 13.1.1.
- 14. France APAC CEP Market Analysis, Insights and Forecast, 2019-2031
- 14.1. Market Analysis, Insights and Forecast - By Country/Sub-region
- 14.1.1.
- 15. Romania APAC CEP Market Analysis, Insights and Forecast, 2019-2031
- 15.1. Market Analysis, Insights and Forecast - By Country/Sub-region
- 15.1.1.
- 16. Bulgaria APAC CEP Market Analysis, Insights and Forecast, 2019-2031
- 16.1. Market Analysis, Insights and Forecast - By Country/Sub-region
- 16.1.1.
- 17. Rest of Europe APAC CEP Market Analysis, Insights and Forecast, 2019-2031
- 17.1. Market Analysis, Insights and Forecast - By Country/Sub-region
- 17.1.1.
- 18. Competitive Analysis
- 18.1. Global Market Share Analysis 2024
- 18.2. Company Profiles
- 18.2.1 China Post
- 18.2.1.1. Overview
- 18.2.1.2. Products
- 18.2.1.3. SWOT Analysis
- 18.2.1.4. Recent Developments
- 18.2.1.5. Financials (Based on Availability)
- 18.2.2 CJ Logistics Corporation
- 18.2.2.1. Overview
- 18.2.2.2. Products
- 18.2.2.3. SWOT Analysis
- 18.2.2.4. Recent Developments
- 18.2.2.5. Financials (Based on Availability)
- 18.2.3 DHL Group
- 18.2.3.1. Overview
- 18.2.3.2. Products
- 18.2.3.3. SWOT Analysis
- 18.2.3.4. Recent Developments
- 18.2.3.5. Financials (Based on Availability)
- 18.2.4 SG Holdings Co Ltd
- 18.2.4.1. Overview
- 18.2.4.2. Products
- 18.2.4.3. SWOT Analysis
- 18.2.4.4. Recent Developments
- 18.2.4.5. Financials (Based on Availability)
- 18.2.5 ZTO Expres
- 18.2.5.1. Overview
- 18.2.5.2. Products
- 18.2.5.3. SWOT Analysis
- 18.2.5.4. Recent Developments
- 18.2.5.5. Financials (Based on Availability)
- 18.2.6 FedEx
- 18.2.6.1. Overview
- 18.2.6.2. Products
- 18.2.6.3. SWOT Analysis
- 18.2.6.4. Recent Developments
- 18.2.6.5. Financials (Based on Availability)
- 18.2.7 United Parcel Service of America Inc (UPS)
- 18.2.7.1. Overview
- 18.2.7.2. Products
- 18.2.7.3. SWOT Analysis
- 18.2.7.4. Recent Developments
- 18.2.7.5. Financials (Based on Availability)
- 18.2.8 YTO Express
- 18.2.8.1. Overview
- 18.2.8.2. Products
- 18.2.8.3. SWOT Analysis
- 18.2.8.4. Recent Developments
- 18.2.8.5. Financials (Based on Availability)
- 18.2.9 Yamato Holdings
- 18.2.9.1. Overview
- 18.2.9.2. Products
- 18.2.9.3. SWOT Analysis
- 18.2.9.4. Recent Developments
- 18.2.9.5. Financials (Based on Availability)
- 18.2.10 SF Express (KEX-SF)
- 18.2.10.1. Overview
- 18.2.10.2. Products
- 18.2.10.3. SWOT Analysis
- 18.2.10.4. Recent Developments
- 18.2.10.5. Financials (Based on Availability)
- 18.2.11 Blue Dart Express
- 18.2.11.1. Overview
- 18.2.11.2. Products
- 18.2.11.3. SWOT Analysis
- 18.2.11.4. Recent Developments
- 18.2.11.5. Financials (Based on Availability)
- 18.2.12 DTDC Express Limited
- 18.2.12.1. Overview
- 18.2.12.2. Products
- 18.2.12.3. SWOT Analysis
- 18.2.12.4. Recent Developments
- 18.2.12.5. Financials (Based on Availability)
- 18.2.13 Toll Group
- 18.2.13.1. Overview
- 18.2.13.2. Products
- 18.2.13.3. SWOT Analysis
- 18.2.13.4. Recent Developments
- 18.2.13.5. Financials (Based on Availability)
- 18.2.14 JWD Group
- 18.2.14.1. Overview
- 18.2.14.2. Products
- 18.2.14.3. SWOT Analysis
- 18.2.14.4. Recent Developments
- 18.2.14.5. Financials (Based on Availability)
- 18.2.1 China Post
List of Figures
- Figure 1: Global APAC CEP Market Revenue Breakdown (Million, %) by Region 2024 & 2032
- Figure 2: Netherland APAC CEP Market Revenue (Million), by Country 2024 & 2032
- Figure 3: Netherland APAC CEP Market Revenue Share (%), by Country 2024 & 2032
- Figure 4: Germany APAC CEP Market Revenue (Million), by Country 2024 & 2032
- Figure 5: Germany APAC CEP Market Revenue Share (%), by Country 2024 & 2032
- Figure 6: Begium APAC CEP Market Revenue (Million), by Country 2024 & 2032
- Figure 7: Begium APAC CEP Market Revenue Share (%), by Country 2024 & 2032
- Figure 8: France APAC CEP Market Revenue (Million), by Country 2024 & 2032
- Figure 9: France APAC CEP Market Revenue Share (%), by Country 2024 & 2032
- Figure 10: Romania APAC CEP Market Revenue (Million), by Country 2024 & 2032
- Figure 11: Romania APAC CEP Market Revenue Share (%), by Country 2024 & 2032
- Figure 12: Bulgaria APAC CEP Market Revenue (Million), by Country 2024 & 2032
- Figure 13: Bulgaria APAC CEP Market Revenue Share (%), by Country 2024 & 2032
- Figure 14: Rest of Europe APAC CEP Market Revenue (Million), by Country 2024 & 2032
- Figure 15: Rest of Europe APAC CEP Market Revenue Share (%), by Country 2024 & 2032
- Figure 16: North America APAC CEP Market Revenue (Million), by Destination 2024 & 2032
- Figure 17: North America APAC CEP Market Revenue Share (%), by Destination 2024 & 2032
- Figure 18: North America APAC CEP Market Revenue (Million), by Speed Of Delivery 2024 & 2032
- Figure 19: North America APAC CEP Market Revenue Share (%), by Speed Of Delivery 2024 & 2032
- Figure 20: North America APAC CEP Market Revenue (Million), by Model 2024 & 2032
- Figure 21: North America APAC CEP Market Revenue Share (%), by Model 2024 & 2032
- Figure 22: North America APAC CEP Market Revenue (Million), by Shipment Weight 2024 & 2032
- Figure 23: North America APAC CEP Market Revenue Share (%), by Shipment Weight 2024 & 2032
- Figure 24: North America APAC CEP Market Revenue (Million), by Mode Of Transport 2024 & 2032
- Figure 25: North America APAC CEP Market Revenue Share (%), by Mode Of Transport 2024 & 2032
- Figure 26: North America APAC CEP Market Revenue (Million), by End User Industry 2024 & 2032
- Figure 27: North America APAC CEP Market Revenue Share (%), by End User Industry 2024 & 2032
- Figure 28: North America APAC CEP Market Revenue (Million), by Country 2024 & 2032
- Figure 29: North America APAC CEP Market Revenue Share (%), by Country 2024 & 2032
- Figure 30: South America APAC CEP Market Revenue (Million), by Destination 2024 & 2032
- Figure 31: South America APAC CEP Market Revenue Share (%), by Destination 2024 & 2032
- Figure 32: South America APAC CEP Market Revenue (Million), by Speed Of Delivery 2024 & 2032
- Figure 33: South America APAC CEP Market Revenue Share (%), by Speed Of Delivery 2024 & 2032
- Figure 34: South America APAC CEP Market Revenue (Million), by Model 2024 & 2032
- Figure 35: South America APAC CEP Market Revenue Share (%), by Model 2024 & 2032
- Figure 36: South America APAC CEP Market Revenue (Million), by Shipment Weight 2024 & 2032
- Figure 37: South America APAC CEP Market Revenue Share (%), by Shipment Weight 2024 & 2032
- Figure 38: South America APAC CEP Market Revenue (Million), by Mode Of Transport 2024 & 2032
- Figure 39: South America APAC CEP Market Revenue Share (%), by Mode Of Transport 2024 & 2032
- Figure 40: South America APAC CEP Market Revenue (Million), by End User Industry 2024 & 2032
- Figure 41: South America APAC CEP Market Revenue Share (%), by End User Industry 2024 & 2032
- Figure 42: South America APAC CEP Market Revenue (Million), by Country 2024 & 2032
- Figure 43: South America APAC CEP Market Revenue Share (%), by Country 2024 & 2032
- Figure 44: Europe APAC CEP Market Revenue (Million), by Destination 2024 & 2032
- Figure 45: Europe APAC CEP Market Revenue Share (%), by Destination 2024 & 2032
- Figure 46: Europe APAC CEP Market Revenue (Million), by Speed Of Delivery 2024 & 2032
- Figure 47: Europe APAC CEP Market Revenue Share (%), by Speed Of Delivery 2024 & 2032
- Figure 48: Europe APAC CEP Market Revenue (Million), by Model 2024 & 2032
- Figure 49: Europe APAC CEP Market Revenue Share (%), by Model 2024 & 2032
- Figure 50: Europe APAC CEP Market Revenue (Million), by Shipment Weight 2024 & 2032
- Figure 51: Europe APAC CEP Market Revenue Share (%), by Shipment Weight 2024 & 2032
- Figure 52: Europe APAC CEP Market Revenue (Million), by Mode Of Transport 2024 & 2032
- Figure 53: Europe APAC CEP Market Revenue Share (%), by Mode Of Transport 2024 & 2032
- Figure 54: Europe APAC CEP Market Revenue (Million), by End User Industry 2024 & 2032
- Figure 55: Europe APAC CEP Market Revenue Share (%), by End User Industry 2024 & 2032
- Figure 56: Europe APAC CEP Market Revenue (Million), by Country 2024 & 2032
- Figure 57: Europe APAC CEP Market Revenue Share (%), by Country 2024 & 2032
- Figure 58: Middle East & Africa APAC CEP Market Revenue (Million), by Destination 2024 & 2032
- Figure 59: Middle East & Africa APAC CEP Market Revenue Share (%), by Destination 2024 & 2032
- Figure 60: Middle East & Africa APAC CEP Market Revenue (Million), by Speed Of Delivery 2024 & 2032
- Figure 61: Middle East & Africa APAC CEP Market Revenue Share (%), by Speed Of Delivery 2024 & 2032
- Figure 62: Middle East & Africa APAC CEP Market Revenue (Million), by Model 2024 & 2032
- Figure 63: Middle East & Africa APAC CEP Market Revenue Share (%), by Model 2024 & 2032
- Figure 64: Middle East & Africa APAC CEP Market Revenue (Million), by Shipment Weight 2024 & 2032
- Figure 65: Middle East & Africa APAC CEP Market Revenue Share (%), by Shipment Weight 2024 & 2032
- Figure 66: Middle East & Africa APAC CEP Market Revenue (Million), by Mode Of Transport 2024 & 2032
- Figure 67: Middle East & Africa APAC CEP Market Revenue Share (%), by Mode Of Transport 2024 & 2032
- Figure 68: Middle East & Africa APAC CEP Market Revenue (Million), by End User Industry 2024 & 2032
- Figure 69: Middle East & Africa APAC CEP Market Revenue Share (%), by End User Industry 2024 & 2032
- Figure 70: Middle East & Africa APAC CEP Market Revenue (Million), by Country 2024 & 2032
- Figure 71: Middle East & Africa APAC CEP Market Revenue Share (%), by Country 2024 & 2032
- Figure 72: Asia Pacific APAC CEP Market Revenue (Million), by Destination 2024 & 2032
- Figure 73: Asia Pacific APAC CEP Market Revenue Share (%), by Destination 2024 & 2032
- Figure 74: Asia Pacific APAC CEP Market Revenue (Million), by Speed Of Delivery 2024 & 2032
- Figure 75: Asia Pacific APAC CEP Market Revenue Share (%), by Speed Of Delivery 2024 & 2032
- Figure 76: Asia Pacific APAC CEP Market Revenue (Million), by Model 2024 & 2032
- Figure 77: Asia Pacific APAC CEP Market Revenue Share (%), by Model 2024 & 2032
- Figure 78: Asia Pacific APAC CEP Market Revenue (Million), by Shipment Weight 2024 & 2032
- Figure 79: Asia Pacific APAC CEP Market Revenue Share (%), by Shipment Weight 2024 & 2032
- Figure 80: Asia Pacific APAC CEP Market Revenue (Million), by Mode Of Transport 2024 & 2032
- Figure 81: Asia Pacific APAC CEP Market Revenue Share (%), by Mode Of Transport 2024 & 2032
- Figure 82: Asia Pacific APAC CEP Market Revenue (Million), by End User Industry 2024 & 2032
- Figure 83: Asia Pacific APAC CEP Market Revenue Share (%), by End User Industry 2024 & 2032
- Figure 84: Asia Pacific APAC CEP Market Revenue (Million), by Country 2024 & 2032
- Figure 85: Asia Pacific APAC CEP Market Revenue Share (%), by Country 2024 & 2032
List of Tables
- Table 1: Global APAC CEP Market Revenue Million Forecast, by Region 2019 & 2032
- Table 2: Global APAC CEP Market Revenue Million Forecast, by Destination 2019 & 2032
- Table 3: Global APAC CEP Market Revenue Million Forecast, by Speed Of Delivery 2019 & 2032
- Table 4: Global APAC CEP Market Revenue Million Forecast, by Model 2019 & 2032
- Table 5: Global APAC CEP Market Revenue Million Forecast, by Shipment Weight 2019 & 2032
- Table 6: Global APAC CEP Market Revenue Million Forecast, by Mode Of Transport 2019 & 2032
- Table 7: Global APAC CEP Market Revenue Million Forecast, by End User Industry 2019 & 2032
- Table 8: Global APAC CEP Market Revenue Million Forecast, by Region 2019 & 2032
- Table 9: Global APAC CEP Market Revenue Million Forecast, by Country 2019 & 2032
- Table 10: APAC CEP Market Revenue (Million) Forecast, by Application 2019 & 2032
- Table 11: Global APAC CEP Market Revenue Million Forecast, by Country 2019 & 2032
- Table 12: APAC CEP Market Revenue (Million) Forecast, by Application 2019 & 2032
- Table 13: Global APAC CEP Market Revenue Million Forecast, by Country 2019 & 2032
- Table 14: APAC CEP Market Revenue (Million) Forecast, by Application 2019 & 2032
- Table 15: Global APAC CEP Market Revenue Million Forecast, by Country 2019 & 2032
- Table 16: APAC CEP Market Revenue (Million) Forecast, by Application 2019 & 2032
- Table 17: Global APAC CEP Market Revenue Million Forecast, by Country 2019 & 2032
- Table 18: APAC CEP Market Revenue (Million) Forecast, by Application 2019 & 2032
- Table 19: Global APAC CEP Market Revenue Million Forecast, by Country 2019 & 2032
- Table 20: APAC CEP Market Revenue (Million) Forecast, by Application 2019 & 2032
- Table 21: Global APAC CEP Market Revenue Million Forecast, by Country 2019 & 2032
- Table 22: APAC CEP Market Revenue (Million) Forecast, by Application 2019 & 2032
- Table 23: Global APAC CEP Market Revenue Million Forecast, by Destination 2019 & 2032
- Table 24: Global APAC CEP Market Revenue Million Forecast, by Speed Of Delivery 2019 & 2032
- Table 25: Global APAC CEP Market Revenue Million Forecast, by Model 2019 & 2032
- Table 26: Global APAC CEP Market Revenue Million Forecast, by Shipment Weight 2019 & 2032
- Table 27: Global APAC CEP Market Revenue Million Forecast, by Mode Of Transport 2019 & 2032
- Table 28: Global APAC CEP Market Revenue Million Forecast, by End User Industry 2019 & 2032
- Table 29: Global APAC CEP Market Revenue Million Forecast, by Country 2019 & 2032
- Table 30: United States APAC CEP Market Revenue (Million) Forecast, by Application 2019 & 2032
- Table 31: Canada APAC CEP Market Revenue (Million) Forecast, by Application 2019 & 2032
- Table 32: Mexico APAC CEP Market Revenue (Million) Forecast, by Application 2019 & 2032
- Table 33: Global APAC CEP Market Revenue Million Forecast, by Destination 2019 & 2032
- Table 34: Global APAC CEP Market Revenue Million Forecast, by Speed Of Delivery 2019 & 2032
- Table 35: Global APAC CEP Market Revenue Million Forecast, by Model 2019 & 2032
- Table 36: Global APAC CEP Market Revenue Million Forecast, by Shipment Weight 2019 & 2032
- Table 37: Global APAC CEP Market Revenue Million Forecast, by Mode Of Transport 2019 & 2032
- Table 38: Global APAC CEP Market Revenue Million Forecast, by End User Industry 2019 & 2032
- Table 39: Global APAC CEP Market Revenue Million Forecast, by Country 2019 & 2032
- Table 40: Brazil APAC CEP Market Revenue (Million) Forecast, by Application 2019 & 2032
- Table 41: Argentina APAC CEP Market Revenue (Million) Forecast, by Application 2019 & 2032
- Table 42: Rest of South America APAC CEP Market Revenue (Million) Forecast, by Application 2019 & 2032
- Table 43: Global APAC CEP Market Revenue Million Forecast, by Destination 2019 & 2032
- Table 44: Global APAC CEP Market Revenue Million Forecast, by Speed Of Delivery 2019 & 2032
- Table 45: Global APAC CEP Market Revenue Million Forecast, by Model 2019 & 2032
- Table 46: Global APAC CEP Market Revenue Million Forecast, by Shipment Weight 2019 & 2032
- Table 47: Global APAC CEP Market Revenue Million Forecast, by Mode Of Transport 2019 & 2032
- Table 48: Global APAC CEP Market Revenue Million Forecast, by End User Industry 2019 & 2032
- Table 49: Global APAC CEP Market Revenue Million Forecast, by Country 2019 & 2032
- Table 50: United Kingdom APAC CEP Market Revenue (Million) Forecast, by Application 2019 & 2032
- Table 51: Germany APAC CEP Market Revenue (Million) Forecast, by Application 2019 & 2032
- Table 52: France APAC CEP Market Revenue (Million) Forecast, by Application 2019 & 2032
- Table 53: Italy APAC CEP Market Revenue (Million) Forecast, by Application 2019 & 2032
- Table 54: Spain APAC CEP Market Revenue (Million) Forecast, by Application 2019 & 2032
- Table 55: Russia APAC CEP Market Revenue (Million) Forecast, by Application 2019 & 2032
- Table 56: Benelux APAC CEP Market Revenue (Million) Forecast, by Application 2019 & 2032
- Table 57: Nordics APAC CEP Market Revenue (Million) Forecast, by Application 2019 & 2032
- Table 58: Rest of Europe APAC CEP Market Revenue (Million) Forecast, by Application 2019 & 2032
- Table 59: Global APAC CEP Market Revenue Million Forecast, by Destination 2019 & 2032
- Table 60: Global APAC CEP Market Revenue Million Forecast, by Speed Of Delivery 2019 & 2032
- Table 61: Global APAC CEP Market Revenue Million Forecast, by Model 2019 & 2032
- Table 62: Global APAC CEP Market Revenue Million Forecast, by Shipment Weight 2019 & 2032
- Table 63: Global APAC CEP Market Revenue Million Forecast, by Mode Of Transport 2019 & 2032
- Table 64: Global APAC CEP Market Revenue Million Forecast, by End User Industry 2019 & 2032
- Table 65: Global APAC CEP Market Revenue Million Forecast, by Country 2019 & 2032
- Table 66: Turkey APAC CEP Market Revenue (Million) Forecast, by Application 2019 & 2032
- Table 67: Israel APAC CEP Market Revenue (Million) Forecast, by Application 2019 & 2032
- Table 68: GCC APAC CEP Market Revenue (Million) Forecast, by Application 2019 & 2032
- Table 69: North Africa APAC CEP Market Revenue (Million) Forecast, by Application 2019 & 2032
- Table 70: South Africa APAC CEP Market Revenue (Million) Forecast, by Application 2019 & 2032
- Table 71: Rest of Middle East & Africa APAC CEP Market Revenue (Million) Forecast, by Application 2019 & 2032
- Table 72: Global APAC CEP Market Revenue Million Forecast, by Destination 2019 & 2032
- Table 73: Global APAC CEP Market Revenue Million Forecast, by Speed Of Delivery 2019 & 2032
- Table 74: Global APAC CEP Market Revenue Million Forecast, by Model 2019 & 2032
- Table 75: Global APAC CEP Market Revenue Million Forecast, by Shipment Weight 2019 & 2032
- Table 76: Global APAC CEP Market Revenue Million Forecast, by Mode Of Transport 2019 & 2032
- Table 77: Global APAC CEP Market Revenue Million Forecast, by End User Industry 2019 & 2032
- Table 78: Global APAC CEP Market Revenue Million Forecast, by Country 2019 & 2032
- Table 79: China APAC CEP Market Revenue (Million) Forecast, by Application 2019 & 2032
- Table 80: India APAC CEP Market Revenue (Million) Forecast, by Application 2019 & 2032
- Table 81: Japan APAC CEP Market Revenue (Million) Forecast, by Application 2019 & 2032
- Table 82: South Korea APAC CEP Market Revenue (Million) Forecast, by Application 2019 & 2032
- Table 83: ASEAN APAC CEP Market Revenue (Million) Forecast, by Application 2019 & 2032
- Table 84: Oceania APAC CEP Market Revenue (Million) Forecast, by Application 2019 & 2032
- Table 85: Rest of Asia Pacific APAC CEP Market Revenue (Million) Forecast, by Application 2019 & 2032
Frequently Asked Questions
1. What is the projected Compound Annual Growth Rate (CAGR) of the APAC CEP Market?
The projected CAGR is approximately 6.64%.
2. Which companies are prominent players in the APAC CEP Market?
Key companies in the market include China Post, CJ Logistics Corporation, DHL Group, SG Holdings Co Ltd, ZTO Expres, FedEx, United Parcel Service of America Inc (UPS), YTO Express, Yamato Holdings, SF Express (KEX-SF), Blue Dart Express, DTDC Express Limited, Toll Group, JWD Group.
3. What are the main segments of the APAC CEP Market?
The market segments include Destination, Speed Of Delivery, Model, Shipment Weight, Mode Of Transport, End User Industry.
4. Can you provide details about the market size?
The market size is estimated to be USD XX Million as of 2022.
5. What are some drivers contributing to market growth?
E-commerce Fueling the Growth of 3PL Market.
6. What are the notable trends driving market growth?
OTHER KEY INDUSTRY TRENDS COVERED IN THE REPORT.
7. Are there any restraints impacting market growth?
Slow Infrastructure Development.
8. Can you provide examples of recent developments in the market?
June 2023: China Post launched its first integrated indoor and outdoor “Robot Plus” AI delivery solution in China. The intelligent delivery solution relies on a combination of unmanned vehicles outdoors and robots indoors, constructing an integrated indoor and outdoor unmanned distribution mode and developing a last-mile logistics network with AI transport capacity sharing.April 2023: China Post and the Automobile Consumption Financial Center of Ping An Bank Co. Ltd launched an intelligent archives service center in Guangdong to promote the service integration of auto finance and express and logistics businesses.March 2023: Colowide MD Co. Ltd, which oversees merchandising for the Colowide Group, and Yamato Transport Co. Ltd entered an agreement. The two companies will promote the visualization and optimization of the entire supply chain of Colowide Group, which operates multiple brands such as Gyu-Kaku, Kappa Sushi, and OOTOYA.
9. What pricing options are available for accessing the report?
Pricing options include single-user, multi-user, and enterprise licenses priced at USD 3800, USD 4500, and USD 5800 respectively.
10. Is the market size provided in terms of value or volume?
The market size is provided in terms of value, measured in Million.
11. Are there any specific market keywords associated with the report?
Yes, the market keyword associated with the report is "APAC CEP Market," which aids in identifying and referencing the specific market segment covered.
12. How do I determine which pricing option suits my needs best?
The pricing options vary based on user requirements and access needs. Individual users may opt for single-user licenses, while businesses requiring broader access may choose multi-user or enterprise licenses for cost-effective access to the report.
13. Are there any additional resources or data provided in the APAC CEP Market report?
While the report offers comprehensive insights, it's advisable to review the specific contents or supplementary materials provided to ascertain if additional resources or data are available.
14. How can I stay updated on further developments or reports in the APAC CEP Market?
To stay informed about further developments, trends, and reports in the APAC CEP Market, consider subscribing to industry newsletters, following relevant companies and organizations, or regularly checking reputable industry news sources and publications.
Methodology
Step 1 - Identification of Relevant Samples Size from Population Database


Step 2 - Approaches for Defining Global Market Size (Value, Volume* & Price*)

Note*: In applicable scenarios
Step 3 - Data Sources
Primary Research
- Web Analytics
- Survey Reports
- Research Institute
- Latest Research Reports
- Opinion Leaders
Secondary Research
- Annual Reports
- White Paper
- Latest Press Release
- Industry Association
- Paid Database
- Investor Presentations

Step 4 - Data Triangulation
Involves using different sources of information in order to increase the validity of a study
These sources are likely to be stakeholders in a program - participants, other researchers, program staff, other community members, and so on.
Then we put all data in single framework & apply various statistical tools to find out the dynamic on the market.
During the analysis stage, feedback from the stakeholder groups would be compared to determine areas of agreement as well as areas of divergence
