

Key Insights
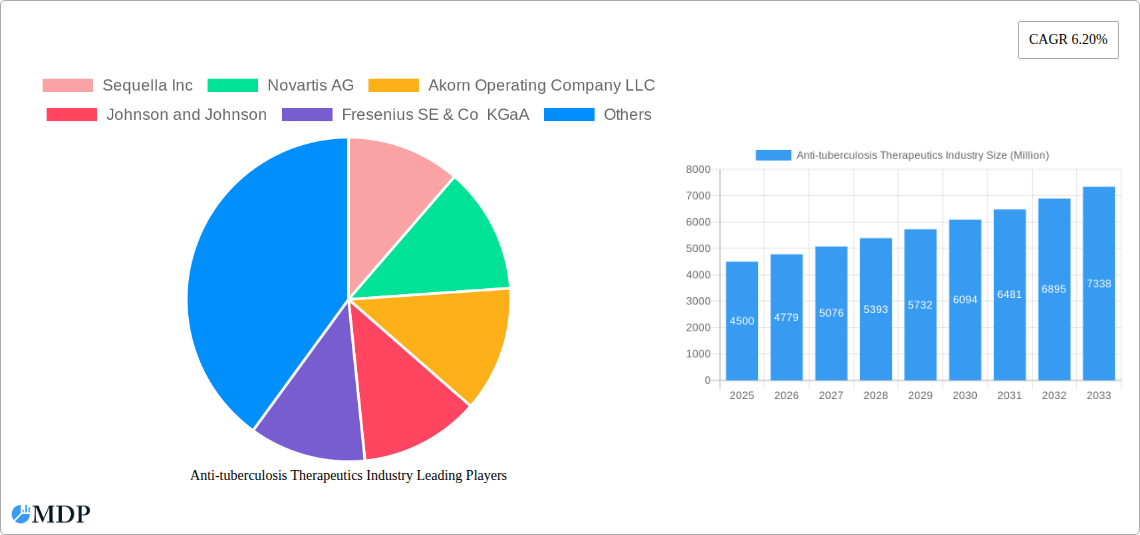
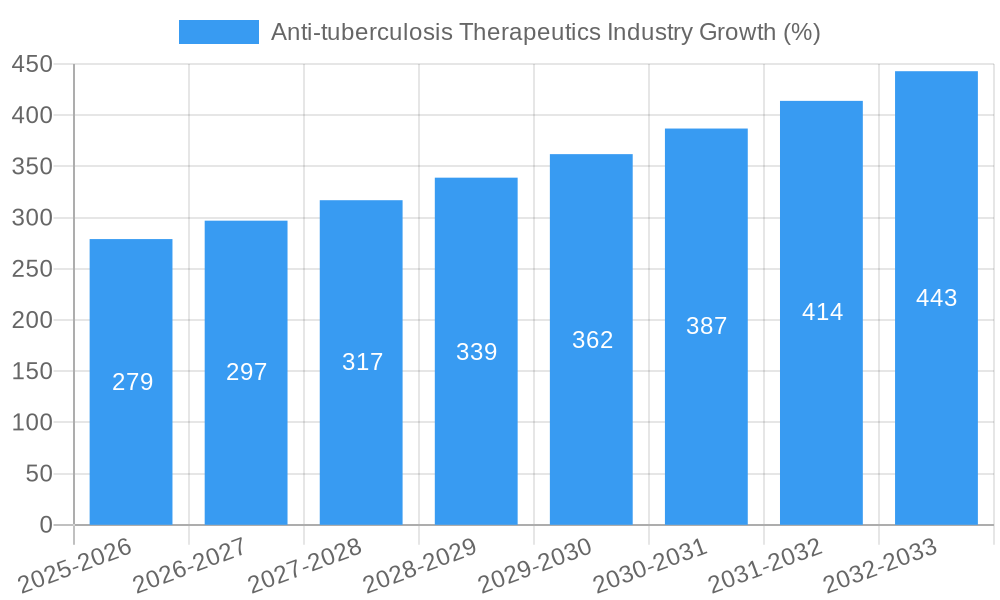
The global anti-tuberculosis (TB) therapeutics market, valued at approximately $4.5 billion in 2025, is projected to experience robust growth, exhibiting a Compound Annual Growth Rate (CAGR) of 6.20% from 2025 to 2033. This expansion is fueled by several key factors. Rising TB prevalence, particularly in developing nations with limited access to healthcare, coupled with the emergence of drug-resistant strains, necessitates the development and wider adoption of advanced therapeutic options. Increased government initiatives aimed at improving TB diagnosis and treatment programs, along with growing awareness campaigns promoting early detection and prevention, further bolster market growth. The market is segmented by drug class, encompassing first-line treatments like isoniazid, rifampin, ethambutol, and pyrazinamide, as well as second-line agents such as fluoroquinolones, bedaquiline, and others. The segment of second-line drugs is expected to show significant growth due to increasing drug resistance. Furthermore, the end-user segment is diversified across hospitals and clinics, government agencies, non-profit organizations, and others, reflecting the multi-faceted nature of TB management. Leading pharmaceutical companies, including Sequella Inc, Novartis AG, Johnson & Johnson, and others, are actively involved in research and development, contributing to the market's dynamism.
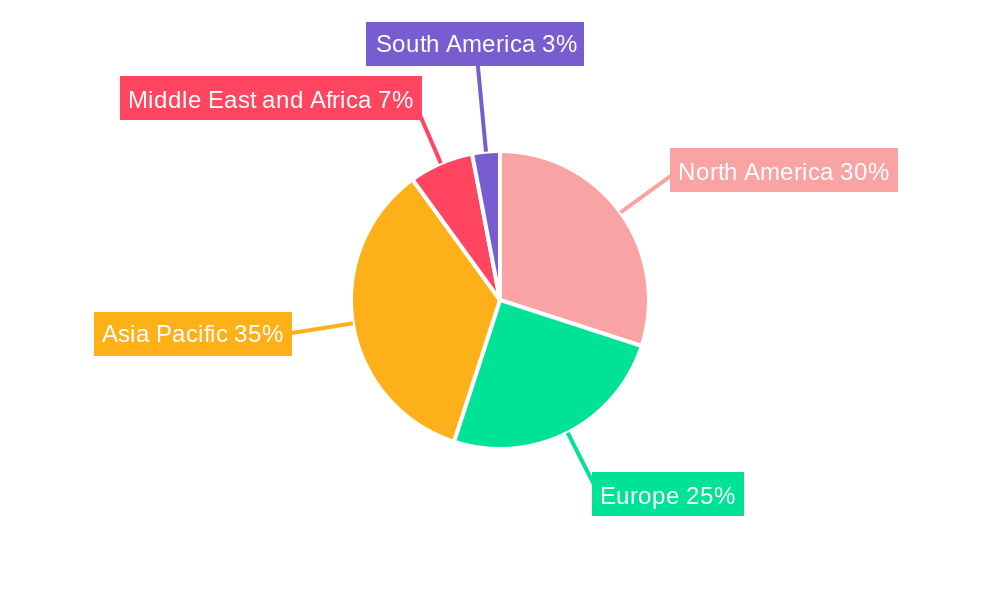
Market restraints include the high cost of newer TB drugs, particularly in low- and middle-income countries, posing a significant barrier to access. Furthermore, the complex treatment regimens, requiring long-term adherence, contribute to challenges in patient compliance and treatment completion rates. However, ongoing research focusing on developing shorter, more effective regimens and innovative drug delivery systems promises to mitigate these challenges and drive future growth. Geographical variations in TB prevalence and healthcare infrastructure significantly influence regional market dynamics. North America and Europe are expected to hold substantial market share due to advanced healthcare systems and higher per capita spending, while the Asia-Pacific region is likely to witness faster growth driven by high TB incidence rates. The market's future trajectory is intricately linked to the success of ongoing research and development efforts, focusing on the development of novel drugs to combat drug-resistant TB and improve treatment outcomes.
Anti-tuberculosis Therapeutics Market Report: 2019-2033
This comprehensive report provides a detailed analysis of the anti-tuberculosis therapeutics industry, offering invaluable insights for stakeholders, investors, and industry professionals. Covering the period from 2019 to 2033, with a base year of 2025 and a forecast period of 2025-2033, this report unveils the market dynamics, leading players, and future trends shaping this crucial sector. The report includes a detailed market size breakdown in Millions (USD) across various segments and geographies, providing actionable intelligence for strategic decision-making.
Anti-tuberculosis Therapeutics Industry Market Dynamics & Concentration
The anti-tuberculosis therapeutics market is characterized by a moderate level of concentration, with several large multinational pharmaceutical companies holding significant market share. Market share data indicates that the top five players account for approximately xx% of the global market in 2025. However, the market is also witnessing increased participation from smaller companies and generic drug manufacturers, especially in emerging markets.
Innovation in the anti-tuberculosis therapeutics space is primarily driven by the need for more effective and shorter treatment regimens, the emergence of drug-resistant strains of tuberculosis, and the pursuit of improved patient compliance. Regulatory frameworks, varying across different countries, influence market access and pricing strategies. The presence of alternative treatment options and their efficacy plays a role in shaping treatment preferences. End-user trends, particularly the increasing focus on early diagnosis and preventative care, are influencing market growth. The number of M&A deals in the anti-tuberculosis therapeutics space has increased in recent years (xx deals in 2024), reflecting the strategic consolidation within the industry.
- Market Concentration: Top 5 players hold xx% market share (2025).
- Innovation Drivers: Drug resistance, shorter treatment regimens, improved compliance.
- Regulatory Landscape: Varies significantly across geographies.
- Product Substitutes: Existing and emerging treatment options.
- End-User Trends: Focus on early diagnosis and preventative care.
- M&A Activity: xx deals recorded in 2024.
Anti-tuberculosis Therapeutics Industry Industry Trends & Analysis
The global anti-tuberculosis therapeutics market is projected to witness robust growth, with a Compound Annual Growth Rate (CAGR) of xx% during the forecast period (2025-2033). This growth is fueled by several key factors, including the rising incidence of tuberculosis globally, especially in high-burden countries. Technological advancements, particularly in diagnostics and drug delivery systems, are significantly influencing market penetration. Changes in consumer preferences, such as a demand for more convenient and patient-friendly treatment options, are also shaping market dynamics. Competitive dynamics, including the entry of new players and the development of innovative therapies, are intensifying the pace of innovation and shaping the market landscape. The market penetration of newer drug classes such as Bedaquiline is steadily increasing, though challenges remain in terms of affordability and access in certain regions.
Leading Markets & Segments in Anti-tuberculosis Therapeutics Industry
The leading markets for anti-tuberculosis therapeutics are primarily located in regions with high tuberculosis prevalence, such as India, China, and several countries in sub-Saharan Africa. Within these regions, government agencies play a significant role in procurement and distribution. Among drug classes, Rifampin and Isoniazid continue to dominate, although the increased prevalence of drug-resistant strains is driving the demand for newer agents like Bedaquiline.
- Dominant Regions: India, China, Sub-Saharan Africa.
- Key Segments:
- Drug Classes: Rifampin and Isoniazid maintain market leadership; Bedaquiline is gaining traction.
- End Users: Hospitals and Clinics, Government Agencies, Non-profit Organizations.
- Key Drivers: High TB prevalence, government initiatives, and rising healthcare expenditure. Specific country-level economic policies impacting healthcare infrastructure significantly affect market performance.
Anti-tuberculosis Therapeutics Industry Product Developments
Significant advancements are being made in the development of new anti-tuberculosis drugs and treatment regimens, focusing on addressing drug resistance and shortening treatment duration. These innovations include the development of new drug combinations, improved delivery systems (e.g., once-weekly formulations), and diagnostic tools to enable rapid identification of drug-resistant strains. The key competitive advantage lies in developing effective and affordable treatment options suitable for high-burden settings.
Key Drivers of Anti-tuberculosis Therapeutics Industry Growth
The growth of the anti-tuberculosis therapeutics market is propelled by several key factors. Firstly, the continued high global incidence of tuberculosis, particularly drug-resistant strains, creates a persistent need for effective treatments. Secondly, increased government funding and initiatives aimed at tackling tuberculosis in various countries are boosting market growth. Thirdly, technological advancements in diagnostics and drug development are leading to more effective and patient-friendly treatment options.
Challenges in the Anti-tuberculosis Therapeutics Industry Market
Significant challenges hinder the growth of the anti-tuberculosis therapeutics market. The high cost of newer drugs can limit access, particularly in low- and middle-income countries. The emergence of multi-drug-resistant and extensively drug-resistant tuberculosis strains poses a significant threat. Supply chain disruptions and challenges in ensuring affordability and accessibility continue to hamper market expansion. The global impact of these challenges is estimated at xx Million USD annually.
Emerging Opportunities in Anti-tuberculosis Therapeutics Industry
The anti-tuberculosis therapeutics market presents several promising opportunities. The development of novel drug candidates targeting drug-resistant strains offers significant potential. Strategic partnerships between pharmaceutical companies and non-profit organizations are crucial for improving access to affordable treatments in high-burden settings. Expanding market reach into underserved populations through public-private partnerships will drive future growth.
Leading Players in the Anti-tuberculosis Therapeutics Industry Sector
- Sequella Inc
- Novartis AG
- Akorn Operating Company LLC
- Johnson and Johnson
- Fresenius SE & Co KGaA
- Viatris Inc
- Lupin Limited
- Otsuka Pharmaceutical Co Ltd
- Macleods Pharmaceuticals Ltd
Key Milestones in Anti-tuberculosis Therapeutics Industry Industry
- September 2021: TB Alliance grants Lupin a non-exclusive license for pretomanid, expanding access to the BPaL regimen in approximately 140 countries.
- March 2022: Johnson & Johnson India launches "Be The Change For TB," a youth-focused digital initiative to combat tuberculosis.
Strategic Outlook for Anti-tuberculosis Therapeutics Market
The future of the anti-tuberculosis therapeutics market is promising, driven by continuous innovation in drug development, improved diagnostics, and increased global awareness. Strategic partnerships, focused on improving affordability and accessibility, will play a key role in expanding market reach and effectively combating tuberculosis globally. The market is expected to grow significantly, driven by ongoing research and development activities, government support, and increasing awareness of the disease.
Anti-tuberculosis Therapeutics Industry Segmentation
-
1. Drug Class
- 1.1. Isoniazid
- 1.2. Rifampin
- 1.3. Ethambutol
- 1.4. Pyrazinamide
- 1.5. Fluoroquinolones
- 1.6. Bedaquiline
- 1.7. Amynoglycosides
- 1.8. Thioamides
- 1.9. Cyclic Peptides
- 1.10. Other Drug Classes
-
2. End User
- 2.1. Hospitals and Clinics
- 2.2. Government Agencies
- 2.3. Non Profit Organizations
- 2.4. Other End Users
Anti-tuberculosis Therapeutics Industry Segmentation By Geography
-
1. North America
- 1.1. United States
- 1.2. Canada
- 1.3. Mexico
-
2. Europe
- 2.1. Germany
- 2.2. United Kingdom
- 2.3. France
- 2.4. Italy
- 2.5. Spain
- 2.6. Rest of Europe
-
3. Asia Pacific
- 3.1. China
- 3.2. Japan
- 3.3. India
- 3.4. Australia
- 3.5. South Korea
- 3.6. Rest of Asia Pacific
-
4. Middle East and Africa
- 4.1. GCC
- 4.2. South Africa
- 4.3. Rest of Middle East and Africa
-
5. South America
- 5.1. Brazil
- 5.2. Argentina
- 5.3. Rest of South America
Anti-tuberculosis Therapeutics Industry REPORT HIGHLIGHTS
| Aspects | Details |
|---|---|
| Study Period | 2019-2033 |
| Base Year | 2024 |
| Estimated Year | 2025 |
| Forecast Period | 2025-2033 |
| Historical Period | 2019-2024 |
| Growth Rate | CAGR of 6.20% from 2019-2033 |
| Segmentation |
|
Table of Contents
- 1. Introduction
- 1.1. Research Scope
- 1.2. Market Segmentation
- 1.3. Research Methodology
- 1.4. Definitions and Assumptions
- 2. Executive Summary
- 2.1. Introduction
- 3. Market Dynamics
- 3.1. Introduction
- 3.2. Market Drivers
- 3.2.1. Rising Prevalence of Tuberculosis; Growing Initiative from Government Organization for Tuberculosis Awareness; Rising Incidence of MDR and XDR Cases in Developing Countries
- 3.3. Market Restrains
- 3.3.1. Adverse Side Effects of Anti-tuberculosis Drugs; High Cost of MDR and XDR TB Drugs
- 3.4. Market Trends
- 3.4.1. Isoniazid Segment Expects to Register a High CAGR in the Anti-tuberculosis Therapeutics Market Over the Forecast Period
- 4. Market Factor Analysis
- 4.1. Porters Five Forces
- 4.2. Supply/Value Chain
- 4.3. PESTEL analysis
- 4.4. Market Entropy
- 4.5. Patent/Trademark Analysis
- 5. Global Anti-tuberculosis Therapeutics Industry Analysis, Insights and Forecast, 2019-2031
- 5.1. Market Analysis, Insights and Forecast - by Drug Class
- 5.1.1. Isoniazid
- 5.1.2. Rifampin
- 5.1.3. Ethambutol
- 5.1.4. Pyrazinamide
- 5.1.5. Fluoroquinolones
- 5.1.6. Bedaquiline
- 5.1.7. Amynoglycosides
- 5.1.8. Thioamides
- 5.1.9. Cyclic Peptides
- 5.1.10. Other Drug Classes
- 5.2. Market Analysis, Insights and Forecast - by End User
- 5.2.1. Hospitals and Clinics
- 5.2.2. Government Agencies
- 5.2.3. Non Profit Organizations
- 5.2.4. Other End Users
- 5.3. Market Analysis, Insights and Forecast - by Region
- 5.3.1. North America
- 5.3.2. Europe
- 5.3.3. Asia Pacific
- 5.3.4. Middle East and Africa
- 5.3.5. South America
- 5.1. Market Analysis, Insights and Forecast - by Drug Class
- 6. North America Anti-tuberculosis Therapeutics Industry Analysis, Insights and Forecast, 2019-2031
- 6.1. Market Analysis, Insights and Forecast - by Drug Class
- 6.1.1. Isoniazid
- 6.1.2. Rifampin
- 6.1.3. Ethambutol
- 6.1.4. Pyrazinamide
- 6.1.5. Fluoroquinolones
- 6.1.6. Bedaquiline
- 6.1.7. Amynoglycosides
- 6.1.8. Thioamides
- 6.1.9. Cyclic Peptides
- 6.1.10. Other Drug Classes
- 6.2. Market Analysis, Insights and Forecast - by End User
- 6.2.1. Hospitals and Clinics
- 6.2.2. Government Agencies
- 6.2.3. Non Profit Organizations
- 6.2.4. Other End Users
- 6.1. Market Analysis, Insights and Forecast - by Drug Class
- 7. Europe Anti-tuberculosis Therapeutics Industry Analysis, Insights and Forecast, 2019-2031
- 7.1. Market Analysis, Insights and Forecast - by Drug Class
- 7.1.1. Isoniazid
- 7.1.2. Rifampin
- 7.1.3. Ethambutol
- 7.1.4. Pyrazinamide
- 7.1.5. Fluoroquinolones
- 7.1.6. Bedaquiline
- 7.1.7. Amynoglycosides
- 7.1.8. Thioamides
- 7.1.9. Cyclic Peptides
- 7.1.10. Other Drug Classes
- 7.2. Market Analysis, Insights and Forecast - by End User
- 7.2.1. Hospitals and Clinics
- 7.2.2. Government Agencies
- 7.2.3. Non Profit Organizations
- 7.2.4. Other End Users
- 7.1. Market Analysis, Insights and Forecast - by Drug Class
- 8. Asia Pacific Anti-tuberculosis Therapeutics Industry Analysis, Insights and Forecast, 2019-2031
- 8.1. Market Analysis, Insights and Forecast - by Drug Class
- 8.1.1. Isoniazid
- 8.1.2. Rifampin
- 8.1.3. Ethambutol
- 8.1.4. Pyrazinamide
- 8.1.5. Fluoroquinolones
- 8.1.6. Bedaquiline
- 8.1.7. Amynoglycosides
- 8.1.8. Thioamides
- 8.1.9. Cyclic Peptides
- 8.1.10. Other Drug Classes
- 8.2. Market Analysis, Insights and Forecast - by End User
- 8.2.1. Hospitals and Clinics
- 8.2.2. Government Agencies
- 8.2.3. Non Profit Organizations
- 8.2.4. Other End Users
- 8.1. Market Analysis, Insights and Forecast - by Drug Class
- 9. Middle East and Africa Anti-tuberculosis Therapeutics Industry Analysis, Insights and Forecast, 2019-2031
- 9.1. Market Analysis, Insights and Forecast - by Drug Class
- 9.1.1. Isoniazid
- 9.1.2. Rifampin
- 9.1.3. Ethambutol
- 9.1.4. Pyrazinamide
- 9.1.5. Fluoroquinolones
- 9.1.6. Bedaquiline
- 9.1.7. Amynoglycosides
- 9.1.8. Thioamides
- 9.1.9. Cyclic Peptides
- 9.1.10. Other Drug Classes
- 9.2. Market Analysis, Insights and Forecast - by End User
- 9.2.1. Hospitals and Clinics
- 9.2.2. Government Agencies
- 9.2.3. Non Profit Organizations
- 9.2.4. Other End Users
- 9.1. Market Analysis, Insights and Forecast - by Drug Class
- 10. South America Anti-tuberculosis Therapeutics Industry Analysis, Insights and Forecast, 2019-2031
- 10.1. Market Analysis, Insights and Forecast - by Drug Class
- 10.1.1. Isoniazid
- 10.1.2. Rifampin
- 10.1.3. Ethambutol
- 10.1.4. Pyrazinamide
- 10.1.5. Fluoroquinolones
- 10.1.6. Bedaquiline
- 10.1.7. Amynoglycosides
- 10.1.8. Thioamides
- 10.1.9. Cyclic Peptides
- 10.1.10. Other Drug Classes
- 10.2. Market Analysis, Insights and Forecast - by End User
- 10.2.1. Hospitals and Clinics
- 10.2.2. Government Agencies
- 10.2.3. Non Profit Organizations
- 10.2.4. Other End Users
- 10.1. Market Analysis, Insights and Forecast - by Drug Class
- 11. North America Anti-tuberculosis Therapeutics Industry Analysis, Insights and Forecast, 2019-2031
- 11.1. Market Analysis, Insights and Forecast - By Country/Sub-region
- 11.1.1. undefined
- 12. Europe Anti-tuberculosis Therapeutics Industry Analysis, Insights and Forecast, 2019-2031
- 12.1. Market Analysis, Insights and Forecast - By Country/Sub-region
- 12.1.1. undefined
- 13. Asia Pacific Anti-tuberculosis Therapeutics Industry Analysis, Insights and Forecast, 2019-2031
- 13.1. Market Analysis, Insights and Forecast - By Country/Sub-region
- 13.1.1. undefined
- 14. Middle East and Africa Anti-tuberculosis Therapeutics Industry Analysis, Insights and Forecast, 2019-2031
- 14.1. Market Analysis, Insights and Forecast - By Country/Sub-region
- 14.1.1. undefined
- 15. South America Anti-tuberculosis Therapeutics Industry Analysis, Insights and Forecast, 2019-2031
- 15.1. Market Analysis, Insights and Forecast - By Country/Sub-region
- 15.1.1. undefined
- 16. Competitive Analysis
- 16.1. Global Market Share Analysis 2024
- 16.2. Company Profiles
- 16.2.1 Sequella Inc
- 16.2.1.1. Overview
- 16.2.1.2. Products
- 16.2.1.3. SWOT Analysis
- 16.2.1.4. Recent Developments
- 16.2.1.5. Financials (Based on Availability)
- 16.2.2 Novartis AG
- 16.2.2.1. Overview
- 16.2.2.2. Products
- 16.2.2.3. SWOT Analysis
- 16.2.2.4. Recent Developments
- 16.2.2.5. Financials (Based on Availability)
- 16.2.3 Akorn Operating Company LLC
- 16.2.3.1. Overview
- 16.2.3.2. Products
- 16.2.3.3. SWOT Analysis
- 16.2.3.4. Recent Developments
- 16.2.3.5. Financials (Based on Availability)
- 16.2.4 Johnson and Johnson
- 16.2.4.1. Overview
- 16.2.4.2. Products
- 16.2.4.3. SWOT Analysis
- 16.2.4.4. Recent Developments
- 16.2.4.5. Financials (Based on Availability)
- 16.2.5 Fresenius SE & Co KGaA
- 16.2.5.1. Overview
- 16.2.5.2. Products
- 16.2.5.3. SWOT Analysis
- 16.2.5.4. Recent Developments
- 16.2.5.5. Financials (Based on Availability)
- 16.2.6 Viatris Inc
- 16.2.6.1. Overview
- 16.2.6.2. Products
- 16.2.6.3. SWOT Analysis
- 16.2.6.4. Recent Developments
- 16.2.6.5. Financials (Based on Availability)
- 16.2.7 Lupin Limited
- 16.2.7.1. Overview
- 16.2.7.2. Products
- 16.2.7.3. SWOT Analysis
- 16.2.7.4. Recent Developments
- 16.2.7.5. Financials (Based on Availability)
- 16.2.8 Otsuka Pharmaceutical Co Ltd
- 16.2.8.1. Overview
- 16.2.8.2. Products
- 16.2.8.3. SWOT Analysis
- 16.2.8.4. Recent Developments
- 16.2.8.5. Financials (Based on Availability)
- 16.2.9 Macleods Pharmaceuticals Ltd
- 16.2.9.1. Overview
- 16.2.9.2. Products
- 16.2.9.3. SWOT Analysis
- 16.2.9.4. Recent Developments
- 16.2.9.5. Financials (Based on Availability)
- 16.2.1 Sequella Inc
List of Figures
- Figure 1: Global Anti-tuberculosis Therapeutics Industry Revenue Breakdown (Million, %) by Region 2024 & 2032
- Figure 2: Global Anti-tuberculosis Therapeutics Industry Volume Breakdown (K Unit, %) by Region 2024 & 2032
- Figure 3: North America Anti-tuberculosis Therapeutics Industry Revenue (Million), by Country 2024 & 2032
- Figure 4: North America Anti-tuberculosis Therapeutics Industry Volume (K Unit), by Country 2024 & 2032
- Figure 5: North America Anti-tuberculosis Therapeutics Industry Revenue Share (%), by Country 2024 & 2032
- Figure 6: North America Anti-tuberculosis Therapeutics Industry Volume Share (%), by Country 2024 & 2032
- Figure 7: Europe Anti-tuberculosis Therapeutics Industry Revenue (Million), by Country 2024 & 2032
- Figure 8: Europe Anti-tuberculosis Therapeutics Industry Volume (K Unit), by Country 2024 & 2032
- Figure 9: Europe Anti-tuberculosis Therapeutics Industry Revenue Share (%), by Country 2024 & 2032
- Figure 10: Europe Anti-tuberculosis Therapeutics Industry Volume Share (%), by Country 2024 & 2032
- Figure 11: Asia Pacific Anti-tuberculosis Therapeutics Industry Revenue (Million), by Country 2024 & 2032
- Figure 12: Asia Pacific Anti-tuberculosis Therapeutics Industry Volume (K Unit), by Country 2024 & 2032
- Figure 13: Asia Pacific Anti-tuberculosis Therapeutics Industry Revenue Share (%), by Country 2024 & 2032
- Figure 14: Asia Pacific Anti-tuberculosis Therapeutics Industry Volume Share (%), by Country 2024 & 2032
- Figure 15: Middle East and Africa Anti-tuberculosis Therapeutics Industry Revenue (Million), by Country 2024 & 2032
- Figure 16: Middle East and Africa Anti-tuberculosis Therapeutics Industry Volume (K Unit), by Country 2024 & 2032
- Figure 17: Middle East and Africa Anti-tuberculosis Therapeutics Industry Revenue Share (%), by Country 2024 & 2032
- Figure 18: Middle East and Africa Anti-tuberculosis Therapeutics Industry Volume Share (%), by Country 2024 & 2032
- Figure 19: South America Anti-tuberculosis Therapeutics Industry Revenue (Million), by Country 2024 & 2032
- Figure 20: South America Anti-tuberculosis Therapeutics Industry Volume (K Unit), by Country 2024 & 2032
- Figure 21: South America Anti-tuberculosis Therapeutics Industry Revenue Share (%), by Country 2024 & 2032
- Figure 22: South America Anti-tuberculosis Therapeutics Industry Volume Share (%), by Country 2024 & 2032
- Figure 23: North America Anti-tuberculosis Therapeutics Industry Revenue (Million), by Drug Class 2024 & 2032
- Figure 24: North America Anti-tuberculosis Therapeutics Industry Volume (K Unit), by Drug Class 2024 & 2032
- Figure 25: North America Anti-tuberculosis Therapeutics Industry Revenue Share (%), by Drug Class 2024 & 2032
- Figure 26: North America Anti-tuberculosis Therapeutics Industry Volume Share (%), by Drug Class 2024 & 2032
- Figure 27: North America Anti-tuberculosis Therapeutics Industry Revenue (Million), by End User 2024 & 2032
- Figure 28: North America Anti-tuberculosis Therapeutics Industry Volume (K Unit), by End User 2024 & 2032
- Figure 29: North America Anti-tuberculosis Therapeutics Industry Revenue Share (%), by End User 2024 & 2032
- Figure 30: North America Anti-tuberculosis Therapeutics Industry Volume Share (%), by End User 2024 & 2032
- Figure 31: North America Anti-tuberculosis Therapeutics Industry Revenue (Million), by Country 2024 & 2032
- Figure 32: North America Anti-tuberculosis Therapeutics Industry Volume (K Unit), by Country 2024 & 2032
- Figure 33: North America Anti-tuberculosis Therapeutics Industry Revenue Share (%), by Country 2024 & 2032
- Figure 34: North America Anti-tuberculosis Therapeutics Industry Volume Share (%), by Country 2024 & 2032
- Figure 35: Europe Anti-tuberculosis Therapeutics Industry Revenue (Million), by Drug Class 2024 & 2032
- Figure 36: Europe Anti-tuberculosis Therapeutics Industry Volume (K Unit), by Drug Class 2024 & 2032
- Figure 37: Europe Anti-tuberculosis Therapeutics Industry Revenue Share (%), by Drug Class 2024 & 2032
- Figure 38: Europe Anti-tuberculosis Therapeutics Industry Volume Share (%), by Drug Class 2024 & 2032
- Figure 39: Europe Anti-tuberculosis Therapeutics Industry Revenue (Million), by End User 2024 & 2032
- Figure 40: Europe Anti-tuberculosis Therapeutics Industry Volume (K Unit), by End User 2024 & 2032
- Figure 41: Europe Anti-tuberculosis Therapeutics Industry Revenue Share (%), by End User 2024 & 2032
- Figure 42: Europe Anti-tuberculosis Therapeutics Industry Volume Share (%), by End User 2024 & 2032
- Figure 43: Europe Anti-tuberculosis Therapeutics Industry Revenue (Million), by Country 2024 & 2032
- Figure 44: Europe Anti-tuberculosis Therapeutics Industry Volume (K Unit), by Country 2024 & 2032
- Figure 45: Europe Anti-tuberculosis Therapeutics Industry Revenue Share (%), by Country 2024 & 2032
- Figure 46: Europe Anti-tuberculosis Therapeutics Industry Volume Share (%), by Country 2024 & 2032
- Figure 47: Asia Pacific Anti-tuberculosis Therapeutics Industry Revenue (Million), by Drug Class 2024 & 2032
- Figure 48: Asia Pacific Anti-tuberculosis Therapeutics Industry Volume (K Unit), by Drug Class 2024 & 2032
- Figure 49: Asia Pacific Anti-tuberculosis Therapeutics Industry Revenue Share (%), by Drug Class 2024 & 2032
- Figure 50: Asia Pacific Anti-tuberculosis Therapeutics Industry Volume Share (%), by Drug Class 2024 & 2032
- Figure 51: Asia Pacific Anti-tuberculosis Therapeutics Industry Revenue (Million), by End User 2024 & 2032
- Figure 52: Asia Pacific Anti-tuberculosis Therapeutics Industry Volume (K Unit), by End User 2024 & 2032
- Figure 53: Asia Pacific Anti-tuberculosis Therapeutics Industry Revenue Share (%), by End User 2024 & 2032
- Figure 54: Asia Pacific Anti-tuberculosis Therapeutics Industry Volume Share (%), by End User 2024 & 2032
- Figure 55: Asia Pacific Anti-tuberculosis Therapeutics Industry Revenue (Million), by Country 2024 & 2032
- Figure 56: Asia Pacific Anti-tuberculosis Therapeutics Industry Volume (K Unit), by Country 2024 & 2032
- Figure 57: Asia Pacific Anti-tuberculosis Therapeutics Industry Revenue Share (%), by Country 2024 & 2032
- Figure 58: Asia Pacific Anti-tuberculosis Therapeutics Industry Volume Share (%), by Country 2024 & 2032
- Figure 59: Middle East and Africa Anti-tuberculosis Therapeutics Industry Revenue (Million), by Drug Class 2024 & 2032
- Figure 60: Middle East and Africa Anti-tuberculosis Therapeutics Industry Volume (K Unit), by Drug Class 2024 & 2032
- Figure 61: Middle East and Africa Anti-tuberculosis Therapeutics Industry Revenue Share (%), by Drug Class 2024 & 2032
- Figure 62: Middle East and Africa Anti-tuberculosis Therapeutics Industry Volume Share (%), by Drug Class 2024 & 2032
- Figure 63: Middle East and Africa Anti-tuberculosis Therapeutics Industry Revenue (Million), by End User 2024 & 2032
- Figure 64: Middle East and Africa Anti-tuberculosis Therapeutics Industry Volume (K Unit), by End User 2024 & 2032
- Figure 65: Middle East and Africa Anti-tuberculosis Therapeutics Industry Revenue Share (%), by End User 2024 & 2032
- Figure 66: Middle East and Africa Anti-tuberculosis Therapeutics Industry Volume Share (%), by End User 2024 & 2032
- Figure 67: Middle East and Africa Anti-tuberculosis Therapeutics Industry Revenue (Million), by Country 2024 & 2032
- Figure 68: Middle East and Africa Anti-tuberculosis Therapeutics Industry Volume (K Unit), by Country 2024 & 2032
- Figure 69: Middle East and Africa Anti-tuberculosis Therapeutics Industry Revenue Share (%), by Country 2024 & 2032
- Figure 70: Middle East and Africa Anti-tuberculosis Therapeutics Industry Volume Share (%), by Country 2024 & 2032
- Figure 71: South America Anti-tuberculosis Therapeutics Industry Revenue (Million), by Drug Class 2024 & 2032
- Figure 72: South America Anti-tuberculosis Therapeutics Industry Volume (K Unit), by Drug Class 2024 & 2032
- Figure 73: South America Anti-tuberculosis Therapeutics Industry Revenue Share (%), by Drug Class 2024 & 2032
- Figure 74: South America Anti-tuberculosis Therapeutics Industry Volume Share (%), by Drug Class 2024 & 2032
- Figure 75: South America Anti-tuberculosis Therapeutics Industry Revenue (Million), by End User 2024 & 2032
- Figure 76: South America Anti-tuberculosis Therapeutics Industry Volume (K Unit), by End User 2024 & 2032
- Figure 77: South America Anti-tuberculosis Therapeutics Industry Revenue Share (%), by End User 2024 & 2032
- Figure 78: South America Anti-tuberculosis Therapeutics Industry Volume Share (%), by End User 2024 & 2032
- Figure 79: South America Anti-tuberculosis Therapeutics Industry Revenue (Million), by Country 2024 & 2032
- Figure 80: South America Anti-tuberculosis Therapeutics Industry Volume (K Unit), by Country 2024 & 2032
- Figure 81: South America Anti-tuberculosis Therapeutics Industry Revenue Share (%), by Country 2024 & 2032
- Figure 82: South America Anti-tuberculosis Therapeutics Industry Volume Share (%), by Country 2024 & 2032
List of Tables
- Table 1: Global Anti-tuberculosis Therapeutics Industry Revenue Million Forecast, by Region 2019 & 2032
- Table 2: Global Anti-tuberculosis Therapeutics Industry Volume K Unit Forecast, by Region 2019 & 2032
- Table 3: Global Anti-tuberculosis Therapeutics Industry Revenue Million Forecast, by Drug Class 2019 & 2032
- Table 4: Global Anti-tuberculosis Therapeutics Industry Volume K Unit Forecast, by Drug Class 2019 & 2032
- Table 5: Global Anti-tuberculosis Therapeutics Industry Revenue Million Forecast, by End User 2019 & 2032
- Table 6: Global Anti-tuberculosis Therapeutics Industry Volume K Unit Forecast, by End User 2019 & 2032
- Table 7: Global Anti-tuberculosis Therapeutics Industry Revenue Million Forecast, by Region 2019 & 2032
- Table 8: Global Anti-tuberculosis Therapeutics Industry Volume K Unit Forecast, by Region 2019 & 2032
- Table 9: Global Anti-tuberculosis Therapeutics Industry Revenue Million Forecast, by Country 2019 & 2032
- Table 10: Global Anti-tuberculosis Therapeutics Industry Volume K Unit Forecast, by Country 2019 & 2032
- Table 11: Global Anti-tuberculosis Therapeutics Industry Revenue Million Forecast, by Country 2019 & 2032
- Table 12: Global Anti-tuberculosis Therapeutics Industry Volume K Unit Forecast, by Country 2019 & 2032
- Table 13: Global Anti-tuberculosis Therapeutics Industry Revenue Million Forecast, by Country 2019 & 2032
- Table 14: Global Anti-tuberculosis Therapeutics Industry Volume K Unit Forecast, by Country 2019 & 2032
- Table 15: Global Anti-tuberculosis Therapeutics Industry Revenue Million Forecast, by Country 2019 & 2032
- Table 16: Global Anti-tuberculosis Therapeutics Industry Volume K Unit Forecast, by Country 2019 & 2032
- Table 17: Global Anti-tuberculosis Therapeutics Industry Revenue Million Forecast, by Country 2019 & 2032
- Table 18: Global Anti-tuberculosis Therapeutics Industry Volume K Unit Forecast, by Country 2019 & 2032
- Table 19: Global Anti-tuberculosis Therapeutics Industry Revenue Million Forecast, by Drug Class 2019 & 2032
- Table 20: Global Anti-tuberculosis Therapeutics Industry Volume K Unit Forecast, by Drug Class 2019 & 2032
- Table 21: Global Anti-tuberculosis Therapeutics Industry Revenue Million Forecast, by End User 2019 & 2032
- Table 22: Global Anti-tuberculosis Therapeutics Industry Volume K Unit Forecast, by End User 2019 & 2032
- Table 23: Global Anti-tuberculosis Therapeutics Industry Revenue Million Forecast, by Country 2019 & 2032
- Table 24: Global Anti-tuberculosis Therapeutics Industry Volume K Unit Forecast, by Country 2019 & 2032
- Table 25: United States Anti-tuberculosis Therapeutics Industry Revenue (Million) Forecast, by Application 2019 & 2032
- Table 26: United States Anti-tuberculosis Therapeutics Industry Volume (K Unit) Forecast, by Application 2019 & 2032
- Table 27: Canada Anti-tuberculosis Therapeutics Industry Revenue (Million) Forecast, by Application 2019 & 2032
- Table 28: Canada Anti-tuberculosis Therapeutics Industry Volume (K Unit) Forecast, by Application 2019 & 2032
- Table 29: Mexico Anti-tuberculosis Therapeutics Industry Revenue (Million) Forecast, by Application 2019 & 2032
- Table 30: Mexico Anti-tuberculosis Therapeutics Industry Volume (K Unit) Forecast, by Application 2019 & 2032
- Table 31: Global Anti-tuberculosis Therapeutics Industry Revenue Million Forecast, by Drug Class 2019 & 2032
- Table 32: Global Anti-tuberculosis Therapeutics Industry Volume K Unit Forecast, by Drug Class 2019 & 2032
- Table 33: Global Anti-tuberculosis Therapeutics Industry Revenue Million Forecast, by End User 2019 & 2032
- Table 34: Global Anti-tuberculosis Therapeutics Industry Volume K Unit Forecast, by End User 2019 & 2032
- Table 35: Global Anti-tuberculosis Therapeutics Industry Revenue Million Forecast, by Country 2019 & 2032
- Table 36: Global Anti-tuberculosis Therapeutics Industry Volume K Unit Forecast, by Country 2019 & 2032
- Table 37: Germany Anti-tuberculosis Therapeutics Industry Revenue (Million) Forecast, by Application 2019 & 2032
- Table 38: Germany Anti-tuberculosis Therapeutics Industry Volume (K Unit) Forecast, by Application 2019 & 2032
- Table 39: United Kingdom Anti-tuberculosis Therapeutics Industry Revenue (Million) Forecast, by Application 2019 & 2032
- Table 40: United Kingdom Anti-tuberculosis Therapeutics Industry Volume (K Unit) Forecast, by Application 2019 & 2032
- Table 41: France Anti-tuberculosis Therapeutics Industry Revenue (Million) Forecast, by Application 2019 & 2032
- Table 42: France Anti-tuberculosis Therapeutics Industry Volume (K Unit) Forecast, by Application 2019 & 2032
- Table 43: Italy Anti-tuberculosis Therapeutics Industry Revenue (Million) Forecast, by Application 2019 & 2032
- Table 44: Italy Anti-tuberculosis Therapeutics Industry Volume (K Unit) Forecast, by Application 2019 & 2032
- Table 45: Spain Anti-tuberculosis Therapeutics Industry Revenue (Million) Forecast, by Application 2019 & 2032
- Table 46: Spain Anti-tuberculosis Therapeutics Industry Volume (K Unit) Forecast, by Application 2019 & 2032
- Table 47: Rest of Europe Anti-tuberculosis Therapeutics Industry Revenue (Million) Forecast, by Application 2019 & 2032
- Table 48: Rest of Europe Anti-tuberculosis Therapeutics Industry Volume (K Unit) Forecast, by Application 2019 & 2032
- Table 49: Global Anti-tuberculosis Therapeutics Industry Revenue Million Forecast, by Drug Class 2019 & 2032
- Table 50: Global Anti-tuberculosis Therapeutics Industry Volume K Unit Forecast, by Drug Class 2019 & 2032
- Table 51: Global Anti-tuberculosis Therapeutics Industry Revenue Million Forecast, by End User 2019 & 2032
- Table 52: Global Anti-tuberculosis Therapeutics Industry Volume K Unit Forecast, by End User 2019 & 2032
- Table 53: Global Anti-tuberculosis Therapeutics Industry Revenue Million Forecast, by Country 2019 & 2032
- Table 54: Global Anti-tuberculosis Therapeutics Industry Volume K Unit Forecast, by Country 2019 & 2032
- Table 55: China Anti-tuberculosis Therapeutics Industry Revenue (Million) Forecast, by Application 2019 & 2032
- Table 56: China Anti-tuberculosis Therapeutics Industry Volume (K Unit) Forecast, by Application 2019 & 2032
- Table 57: Japan Anti-tuberculosis Therapeutics Industry Revenue (Million) Forecast, by Application 2019 & 2032
- Table 58: Japan Anti-tuberculosis Therapeutics Industry Volume (K Unit) Forecast, by Application 2019 & 2032
- Table 59: India Anti-tuberculosis Therapeutics Industry Revenue (Million) Forecast, by Application 2019 & 2032
- Table 60: India Anti-tuberculosis Therapeutics Industry Volume (K Unit) Forecast, by Application 2019 & 2032
- Table 61: Australia Anti-tuberculosis Therapeutics Industry Revenue (Million) Forecast, by Application 2019 & 2032
- Table 62: Australia Anti-tuberculosis Therapeutics Industry Volume (K Unit) Forecast, by Application 2019 & 2032
- Table 63: South Korea Anti-tuberculosis Therapeutics Industry Revenue (Million) Forecast, by Application 2019 & 2032
- Table 64: South Korea Anti-tuberculosis Therapeutics Industry Volume (K Unit) Forecast, by Application 2019 & 2032
- Table 65: Rest of Asia Pacific Anti-tuberculosis Therapeutics Industry Revenue (Million) Forecast, by Application 2019 & 2032
- Table 66: Rest of Asia Pacific Anti-tuberculosis Therapeutics Industry Volume (K Unit) Forecast, by Application 2019 & 2032
- Table 67: Global Anti-tuberculosis Therapeutics Industry Revenue Million Forecast, by Drug Class 2019 & 2032
- Table 68: Global Anti-tuberculosis Therapeutics Industry Volume K Unit Forecast, by Drug Class 2019 & 2032
- Table 69: Global Anti-tuberculosis Therapeutics Industry Revenue Million Forecast, by End User 2019 & 2032
- Table 70: Global Anti-tuberculosis Therapeutics Industry Volume K Unit Forecast, by End User 2019 & 2032
- Table 71: Global Anti-tuberculosis Therapeutics Industry Revenue Million Forecast, by Country 2019 & 2032
- Table 72: Global Anti-tuberculosis Therapeutics Industry Volume K Unit Forecast, by Country 2019 & 2032
- Table 73: GCC Anti-tuberculosis Therapeutics Industry Revenue (Million) Forecast, by Application 2019 & 2032
- Table 74: GCC Anti-tuberculosis Therapeutics Industry Volume (K Unit) Forecast, by Application 2019 & 2032
- Table 75: South Africa Anti-tuberculosis Therapeutics Industry Revenue (Million) Forecast, by Application 2019 & 2032
- Table 76: South Africa Anti-tuberculosis Therapeutics Industry Volume (K Unit) Forecast, by Application 2019 & 2032
- Table 77: Rest of Middle East and Africa Anti-tuberculosis Therapeutics Industry Revenue (Million) Forecast, by Application 2019 & 2032
- Table 78: Rest of Middle East and Africa Anti-tuberculosis Therapeutics Industry Volume (K Unit) Forecast, by Application 2019 & 2032
- Table 79: Global Anti-tuberculosis Therapeutics Industry Revenue Million Forecast, by Drug Class 2019 & 2032
- Table 80: Global Anti-tuberculosis Therapeutics Industry Volume K Unit Forecast, by Drug Class 2019 & 2032
- Table 81: Global Anti-tuberculosis Therapeutics Industry Revenue Million Forecast, by End User 2019 & 2032
- Table 82: Global Anti-tuberculosis Therapeutics Industry Volume K Unit Forecast, by End User 2019 & 2032
- Table 83: Global Anti-tuberculosis Therapeutics Industry Revenue Million Forecast, by Country 2019 & 2032
- Table 84: Global Anti-tuberculosis Therapeutics Industry Volume K Unit Forecast, by Country 2019 & 2032
- Table 85: Brazil Anti-tuberculosis Therapeutics Industry Revenue (Million) Forecast, by Application 2019 & 2032
- Table 86: Brazil Anti-tuberculosis Therapeutics Industry Volume (K Unit) Forecast, by Application 2019 & 2032
- Table 87: Argentina Anti-tuberculosis Therapeutics Industry Revenue (Million) Forecast, by Application 2019 & 2032
- Table 88: Argentina Anti-tuberculosis Therapeutics Industry Volume (K Unit) Forecast, by Application 2019 & 2032
- Table 89: Rest of South America Anti-tuberculosis Therapeutics Industry Revenue (Million) Forecast, by Application 2019 & 2032
- Table 90: Rest of South America Anti-tuberculosis Therapeutics Industry Volume (K Unit) Forecast, by Application 2019 & 2032
Frequently Asked Questions
1. What is the projected Compound Annual Growth Rate (CAGR) of the Anti-tuberculosis Therapeutics Industry?
The projected CAGR is approximately 6.20%.
2. Which companies are prominent players in the Anti-tuberculosis Therapeutics Industry?
Key companies in the market include Sequella Inc, Novartis AG, Akorn Operating Company LLC, Johnson and Johnson, Fresenius SE & Co KGaA, Viatris Inc, Lupin Limited, Otsuka Pharmaceutical Co Ltd, Macleods Pharmaceuticals Ltd.
3. What are the main segments of the Anti-tuberculosis Therapeutics Industry?
The market segments include Drug Class, End User.
4. Can you provide details about the market size?
The market size is estimated to be USD XX Million as of 2022.
5. What are some drivers contributing to market growth?
Rising Prevalence of Tuberculosis; Growing Initiative from Government Organization for Tuberculosis Awareness; Rising Incidence of MDR and XDR Cases in Developing Countries.
6. What are the notable trends driving market growth?
Isoniazid Segment Expects to Register a High CAGR in the Anti-tuberculosis Therapeutics Market Over the Forecast Period.
7. Are there any restraints impacting market growth?
Adverse Side Effects of Anti-tuberculosis Drugs; High Cost of MDR and XDR TB Drugs.
8. Can you provide examples of recent developments in the market?
In March 2022, Johnson & Johnson India launched a youth-focused, digital initiative, Be The Change For TB, a joint initiative with the Union Ministry of Health's Central TB Division and the United States Agency for International Development, as part of its corporate pledge against tuberculosis.
9. What pricing options are available for accessing the report?
Pricing options include single-user, multi-user, and enterprise licenses priced at USD 4750, USD 5250, and USD 8750 respectively.
10. Is the market size provided in terms of value or volume?
The market size is provided in terms of value, measured in Million and volume, measured in K Unit.
11. Are there any specific market keywords associated with the report?
Yes, the market keyword associated with the report is "Anti-tuberculosis Therapeutics Industry," which aids in identifying and referencing the specific market segment covered.
12. How do I determine which pricing option suits my needs best?
The pricing options vary based on user requirements and access needs. Individual users may opt for single-user licenses, while businesses requiring broader access may choose multi-user or enterprise licenses for cost-effective access to the report.
13. Are there any additional resources or data provided in the Anti-tuberculosis Therapeutics Industry report?
While the report offers comprehensive insights, it's advisable to review the specific contents or supplementary materials provided to ascertain if additional resources or data are available.
14. How can I stay updated on further developments or reports in the Anti-tuberculosis Therapeutics Industry?
To stay informed about further developments, trends, and reports in the Anti-tuberculosis Therapeutics Industry, consider subscribing to industry newsletters, following relevant companies and organizations, or regularly checking reputable industry news sources and publications.
Methodology
Step 1 - Identification of Relevant Samples Size from Population Database


Step 2 - Approaches for Defining Global Market Size (Value, Volume* & Price*)

Note*: In applicable scenarios
Step 3 - Data Sources
Primary Research
- Web Analytics
- Survey Reports
- Research Institute
- Latest Research Reports
- Opinion Leaders
Secondary Research
- Annual Reports
- White Paper
- Latest Press Release
- Industry Association
- Paid Database
- Investor Presentations

Step 4 - Data Triangulation
Involves using different sources of information in order to increase the validity of a study
These sources are likely to be stakeholders in a program - participants, other researchers, program staff, other community members, and so on.
Then we put all data in single framework & apply various statistical tools to find out the dynamic on the market.
During the analysis stage, feedback from the stakeholder groups would be compared to determine areas of agreement as well as areas of divergence
