

Key Insights
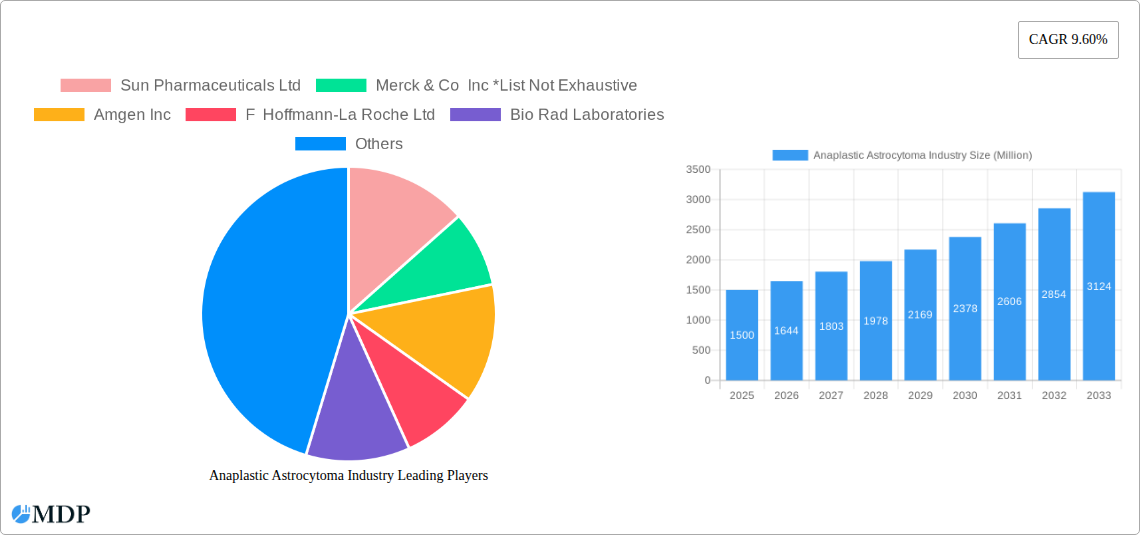
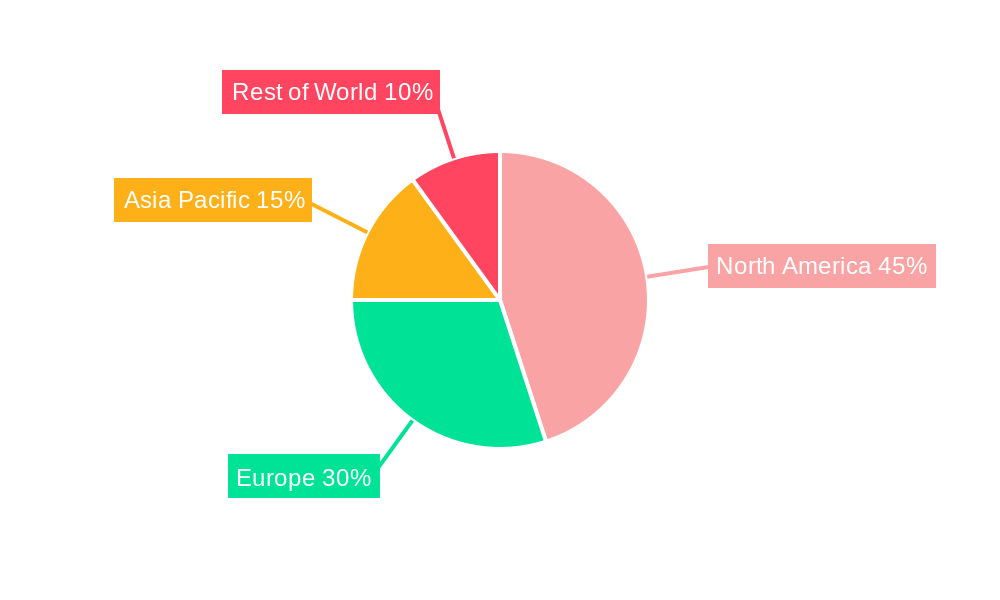
The anaplastic astrocytoma market, a segment within the broader brain tumor therapeutic landscape, is experiencing robust growth, driven by a confluence of factors. The increasing prevalence of this aggressive brain cancer, coupled with advancements in targeted therapies and immunotherapies, fuels market expansion. While precise market sizing for anaplastic astrocytoma alone is not explicitly provided, we can reasonably estimate its value based on the overall market size and the prevalence of this specific cancer type relative to other brain tumors. Considering the aggressive nature and limited treatment options historically available, anaplastic astrocytoma likely commands a significant portion of the overall market. The 9.60% CAGR suggests a consistently expanding market, indicative of ongoing R&D efforts yielding improved treatment modalities and a growing awareness among healthcare professionals. Key players, such as Merck & Co, Roche, and Amgen, are heavily invested in this area, further contributing to market growth through the development and commercialization of novel therapies. Geographical variations in healthcare infrastructure and access to advanced treatments contribute to differing regional market shares, with North America and Europe likely dominating due to higher per capita healthcare spending and established research ecosystems.
However, significant challenges remain. The inherent difficulties in treating brain tumors, including the blood-brain barrier and the risk of significant side effects from aggressive therapies, present obstacles to faster market expansion. Furthermore, high treatment costs associated with advanced therapies can create access barriers for a large segment of patients. The development of resistance to existing therapies is another key restraint, highlighting the continuous need for innovative treatment approaches. Future growth will largely hinge on the successful development and market launch of new therapies that overcome these limitations, offering improved efficacy and safety profiles. The continued investment in research and development of personalized medicine tailored to specific genetic profiles of anaplastic astrocytoma will be crucial for unlocking further market growth.
This comprehensive report provides a detailed analysis of the Anaplastic Astrocytoma industry, offering invaluable insights for stakeholders seeking to navigate this dynamic market. With a study period spanning 2019-2033, a base year of 2025, and a forecast period of 2025-2033, this report leverages historical data (2019-2024) and expert projections to deliver a robust understanding of market trends, competitive landscapes, and future growth potential. The market size is predicted to reach xx Million by 2033.
Anaplastic Astrocytoma Industry Market Dynamics & Concentration
The Anaplastic Astrocytoma market is characterized by a moderately concentrated landscape with several key players holding significant market share. The market's dynamics are shaped by continuous innovation in treatment modalities, stringent regulatory frameworks governing drug approvals, and the emergence of substitute therapies. End-user trends, primarily driven by increasing awareness of the disease and advancements in diagnostic techniques, significantly influence market growth. Mergers and acquisitions (M&A) activity within the industry is substantial, with an estimated xx M&A deals in the historical period (2019-2024).
- Market Concentration: The top 5 players account for approximately xx% of the market share in 2025.
- Innovation Drivers: Ongoing research into targeted therapies, immunotherapy, and advanced radiation techniques drives market innovation.
- Regulatory Frameworks: Stringent regulatory approvals and clinical trial requirements impact market entry and product lifecycle.
- Product Substitutes: The availability of alternative treatments, albeit with varying efficacies, influences market competition.
- End-User Trends: Increasing patient advocacy and improved diagnostic capabilities contribute to market growth.
- M&A Activities: Consolidation within the industry through M&A activities results in significant market share shifts and technological advancements.
Anaplastic Astrocytoma Industry Industry Trends & Analysis
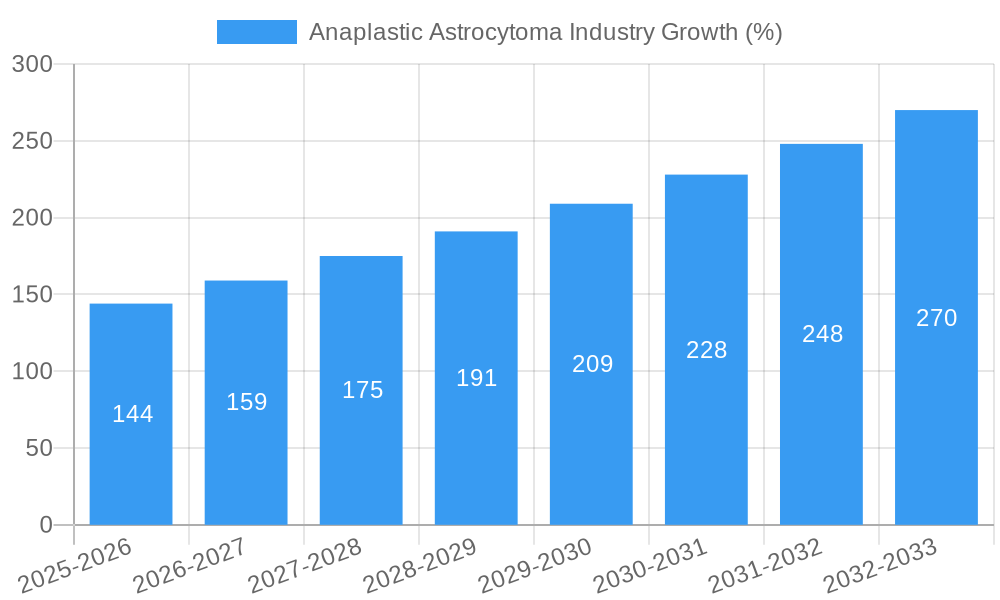
The Anaplastic Astrocytoma industry exhibits a strong growth trajectory, driven by several key factors. The rising prevalence of the disease globally fuels market expansion. Technological advancements in targeted therapies, such as monoclonal antibodies and improved radiation techniques, are transforming treatment approaches, leading to improved patient outcomes and driving market growth. A significant CAGR of xx% is projected during the forecast period (2025-2033), with market penetration steadily increasing across various regions. Consumer preferences are shifting towards personalized medicine approaches and minimally invasive treatment options. Competitive dynamics are intense, with leading players focusing on R&D investments, strategic collaborations, and market expansion initiatives.
Leading Markets & Segments in Anaplastic Astrocytoma Industry
The North American region dominates the global Anaplastic Astrocytoma market, driven by strong healthcare infrastructure, high healthcare expenditure, and a substantial patient population. Within the segments, Targeted Drug Therapy demonstrates significant growth potential, followed by Radiation Therapy.
By Therapy:
- Chemotherapy: Market share of xx% in 2025, driven by its established role in treatment protocols.
- Targeted Drug Therapy: Fastest-growing segment with a projected CAGR of xx% (2025-2033), fueled by ongoing R&D efforts.
- Radiation Therapy: Significant market share, with steady growth driven by technological advancements.
- Other Monoclonal Antibodies: Emerging segment with high growth potential, driven by innovation in immunotherapy.
By Type of Disease:
- Glioblastoma Multiforme: Largest segment due to its high prevalence and severity.
- Anaplastic Astrocytoma: Significant segment, accounting for xx% of the market in 2025.
- Anaplastic Oligodendroglioma and Anaplastic Oligoastrocytoma: Smaller but growing segments due to increasing awareness and improved diagnostic capabilities.
Key Drivers:
- Advanced healthcare infrastructure in North America.
- High healthcare expenditure and insurance coverage.
- Robust clinical research ecosystem.
- Growing public and private investments in research and development.
Anaplastic Astrocytoma Industry Product Developments
Recent advancements in Anaplastic Astrocytoma treatment include the development of novel targeted therapies exhibiting higher efficacy and reduced side effects compared to traditional chemotherapy regimens. These advancements cater to the growing demand for personalized medicine approaches and are driving market growth. Several companies are investing heavily in developing innovative treatment modalities that incorporate advanced imaging techniques for precise drug delivery and personalized treatment plans. This enhances the market fit of newer therapies, providing competitive advantages to early adopters.
Key Drivers of Anaplastic Astrocytoma Industry Growth
Technological advancements in drug delivery systems, targeted therapies, and immunotherapy are key drivers of growth. Rising awareness about the disease, improved diagnostic capabilities, and growing investments in research and development are further contributing factors. Favorable regulatory environments in certain regions also play a significant role. Furthermore, increasing government funding for cancer research and growing collaborations between research institutions and pharmaceutical companies are accelerating market growth.
Challenges in the Anaplastic Astrocytoma Industry Market
High drug development costs, stringent regulatory pathways for approval, and the inherent complexities of treating brain tumors pose significant challenges. Competition among established players and the emergence of new entrants further intensify market pressures. Supply chain disruptions and fluctuating raw material prices can also impact the market. The high cost of treatment and limited access to advanced therapies in developing countries restrict market penetration.
Emerging Opportunities in Anaplastic Astrocytoma Industry
The development of novel targeted therapies, personalized medicine approaches, and advanced radiation techniques offer significant opportunities for growth. Strategic partnerships between pharmaceutical companies and research institutions are accelerating innovation. Expansion into emerging markets with rising healthcare expenditure and growing awareness of the disease presents substantial market expansion opportunities.
Leading Players in the Anaplastic Astrocytoma Industry Sector
- Sun Pharmaceuticals Ltd
- Merck & Co Inc
- Amgen Inc
- F Hoffmann-La Roche Ltd
- Bio Rad Laboratories
- AbbVie Inc
- Arbor Pharmaceuticals
- Bristol-Myers Squibb Company
- Pfizer Inc
Key Milestones in Anaplastic Astrocytoma Industry Industry
- March 2022: The Ivy Brain Tumor Center launched a Phase 0/Ib clinical trial of AstraZeneca's AZD1390 in recurrent grade IV glioma patients. This trial highlights the ongoing efforts to develop effective treatments for aggressive brain cancers.
- January 2023: The collaboration between Stanford University and The Invus Group to develop glioblastoma treatments signals a significant investment in research and development within the field, potentially leading to new therapies.
Strategic Outlook for Anaplastic Astrocytoma Industry Market
The Anaplastic Astrocytoma market is poised for substantial growth driven by continuous innovation in treatment modalities, increasing investments in R&D, and strategic collaborations. The focus on personalized medicine, targeted therapies, and advanced radiation techniques offers significant opportunities for market expansion. Companies with robust R&D pipelines and strategic partnerships are well-positioned to capitalize on this growth potential.
Anaplastic Astrocytoma Industry Segmentation
-
1. Type of Disease
- 1.1. Glioblastoma Multiforme
- 1.2. Anaplastic Astrocytoma
- 1.3. Anaplastic Oligodendroglioma
- 1.4. Anaplastic Oligoastrocytoma
- 1.5. Other Types of Disease
-
2. Therapy
-
2.1. Chemotherapy
- 2.1.1. Temozolomide
- 2.1.2. Bevacizumab
- 2.1.3. Carmustine
- 2.1.4. Other Types of Chemotherapy
-
2.2. Targeted Drug Therapy
- 2.2.1. Epidermal Growth Factor Receptor (EGFR) Inhibitors
- 2.2.2. Other Monoclonal Antibodies
- 2.3. Radiation Therapy
-
2.1. Chemotherapy
Anaplastic Astrocytoma Industry Segmentation By Geography
-
1. North America
- 1.1. United States
- 1.2. Canada
- 1.3. Mexico
-
2. Europe
- 2.1. Germany
- 2.2. United Kingdom
- 2.3. France
- 2.4. Italy
- 2.5. Spain
- 2.6. Rest of Europe
-
3. Asia Pacific
- 3.1. China
- 3.2. Japan
- 3.3. India
- 3.4. Australia
- 3.5. South Korea
- 3.6. Rest of Asia Pacific
-
4. Middle East and Africa
- 4.1. GCC
- 4.2. South Africa
- 4.3. Rest of Middle East and Africa
-
5. South America
- 5.1. Brazil
- 5.2. Argentina
- 5.3. Rest of South America
Anaplastic Astrocytoma Industry REPORT HIGHLIGHTS
| Aspects | Details |
|---|---|
| Study Period | 2019-2033 |
| Base Year | 2024 |
| Estimated Year | 2025 |
| Forecast Period | 2025-2033 |
| Historical Period | 2019-2024 |
| Growth Rate | CAGR of 9.60% from 2019-2033 |
| Segmentation |
|
Table of Contents
- 1. Introduction
- 1.1. Research Scope
- 1.2. Market Segmentation
- 1.3. Research Methodology
- 1.4. Definitions and Assumptions
- 2. Executive Summary
- 2.1. Introduction
- 3. Market Dynamics
- 3.1. Introduction
- 3.2. Market Drivers
- 3.2.1. High Burden of Brain Cancer and Malignant Gliomas; Rising Funding for Research and Development
- 3.3. Market Restrains
- 3.3.1. Diminishing Preference for Chemotherapy; Low Approval Rates for Novel Therapeutics for Glioma
- 3.4. Market Trends
- 3.4.1. The Glioblastoma Multiforme Segment is Expected to Hold a Significant Growth Over The Forecast Period
- 4. Market Factor Analysis
- 4.1. Porters Five Forces
- 4.2. Supply/Value Chain
- 4.3. PESTEL analysis
- 4.4. Market Entropy
- 4.5. Patent/Trademark Analysis
- 5. Global Anaplastic Astrocytoma Industry Analysis, Insights and Forecast, 2019-2031
- 5.1. Market Analysis, Insights and Forecast - by Type of Disease
- 5.1.1. Glioblastoma Multiforme
- 5.1.2. Anaplastic Astrocytoma
- 5.1.3. Anaplastic Oligodendroglioma
- 5.1.4. Anaplastic Oligoastrocytoma
- 5.1.5. Other Types of Disease
- 5.2. Market Analysis, Insights and Forecast - by Therapy
- 5.2.1. Chemotherapy
- 5.2.1.1. Temozolomide
- 5.2.1.2. Bevacizumab
- 5.2.1.3. Carmustine
- 5.2.1.4. Other Types of Chemotherapy
- 5.2.2. Targeted Drug Therapy
- 5.2.2.1. Epidermal Growth Factor Receptor (EGFR) Inhibitors
- 5.2.2.2. Other Monoclonal Antibodies
- 5.2.3. Radiation Therapy
- 5.2.1. Chemotherapy
- 5.3. Market Analysis, Insights and Forecast - by Region
- 5.3.1. North America
- 5.3.2. Europe
- 5.3.3. Asia Pacific
- 5.3.4. Middle East and Africa
- 5.3.5. South America
- 5.1. Market Analysis, Insights and Forecast - by Type of Disease
- 6. North America Anaplastic Astrocytoma Industry Analysis, Insights and Forecast, 2019-2031
- 6.1. Market Analysis, Insights and Forecast - by Type of Disease
- 6.1.1. Glioblastoma Multiforme
- 6.1.2. Anaplastic Astrocytoma
- 6.1.3. Anaplastic Oligodendroglioma
- 6.1.4. Anaplastic Oligoastrocytoma
- 6.1.5. Other Types of Disease
- 6.2. Market Analysis, Insights and Forecast - by Therapy
- 6.2.1. Chemotherapy
- 6.2.1.1. Temozolomide
- 6.2.1.2. Bevacizumab
- 6.2.1.3. Carmustine
- 6.2.1.4. Other Types of Chemotherapy
- 6.2.2. Targeted Drug Therapy
- 6.2.2.1. Epidermal Growth Factor Receptor (EGFR) Inhibitors
- 6.2.2.2. Other Monoclonal Antibodies
- 6.2.3. Radiation Therapy
- 6.2.1. Chemotherapy
- 6.1. Market Analysis, Insights and Forecast - by Type of Disease
- 7. Europe Anaplastic Astrocytoma Industry Analysis, Insights and Forecast, 2019-2031
- 7.1. Market Analysis, Insights and Forecast - by Type of Disease
- 7.1.1. Glioblastoma Multiforme
- 7.1.2. Anaplastic Astrocytoma
- 7.1.3. Anaplastic Oligodendroglioma
- 7.1.4. Anaplastic Oligoastrocytoma
- 7.1.5. Other Types of Disease
- 7.2. Market Analysis, Insights and Forecast - by Therapy
- 7.2.1. Chemotherapy
- 7.2.1.1. Temozolomide
- 7.2.1.2. Bevacizumab
- 7.2.1.3. Carmustine
- 7.2.1.4. Other Types of Chemotherapy
- 7.2.2. Targeted Drug Therapy
- 7.2.2.1. Epidermal Growth Factor Receptor (EGFR) Inhibitors
- 7.2.2.2. Other Monoclonal Antibodies
- 7.2.3. Radiation Therapy
- 7.2.1. Chemotherapy
- 7.1. Market Analysis, Insights and Forecast - by Type of Disease
- 8. Asia Pacific Anaplastic Astrocytoma Industry Analysis, Insights and Forecast, 2019-2031
- 8.1. Market Analysis, Insights and Forecast - by Type of Disease
- 8.1.1. Glioblastoma Multiforme
- 8.1.2. Anaplastic Astrocytoma
- 8.1.3. Anaplastic Oligodendroglioma
- 8.1.4. Anaplastic Oligoastrocytoma
- 8.1.5. Other Types of Disease
- 8.2. Market Analysis, Insights and Forecast - by Therapy
- 8.2.1. Chemotherapy
- 8.2.1.1. Temozolomide
- 8.2.1.2. Bevacizumab
- 8.2.1.3. Carmustine
- 8.2.1.4. Other Types of Chemotherapy
- 8.2.2. Targeted Drug Therapy
- 8.2.2.1. Epidermal Growth Factor Receptor (EGFR) Inhibitors
- 8.2.2.2. Other Monoclonal Antibodies
- 8.2.3. Radiation Therapy
- 8.2.1. Chemotherapy
- 8.1. Market Analysis, Insights and Forecast - by Type of Disease
- 9. Middle East and Africa Anaplastic Astrocytoma Industry Analysis, Insights and Forecast, 2019-2031
- 9.1. Market Analysis, Insights and Forecast - by Type of Disease
- 9.1.1. Glioblastoma Multiforme
- 9.1.2. Anaplastic Astrocytoma
- 9.1.3. Anaplastic Oligodendroglioma
- 9.1.4. Anaplastic Oligoastrocytoma
- 9.1.5. Other Types of Disease
- 9.2. Market Analysis, Insights and Forecast - by Therapy
- 9.2.1. Chemotherapy
- 9.2.1.1. Temozolomide
- 9.2.1.2. Bevacizumab
- 9.2.1.3. Carmustine
- 9.2.1.4. Other Types of Chemotherapy
- 9.2.2. Targeted Drug Therapy
- 9.2.2.1. Epidermal Growth Factor Receptor (EGFR) Inhibitors
- 9.2.2.2. Other Monoclonal Antibodies
- 9.2.3. Radiation Therapy
- 9.2.1. Chemotherapy
- 9.1. Market Analysis, Insights and Forecast - by Type of Disease
- 10. South America Anaplastic Astrocytoma Industry Analysis, Insights and Forecast, 2019-2031
- 10.1. Market Analysis, Insights and Forecast - by Type of Disease
- 10.1.1. Glioblastoma Multiforme
- 10.1.2. Anaplastic Astrocytoma
- 10.1.3. Anaplastic Oligodendroglioma
- 10.1.4. Anaplastic Oligoastrocytoma
- 10.1.5. Other Types of Disease
- 10.2. Market Analysis, Insights and Forecast - by Therapy
- 10.2.1. Chemotherapy
- 10.2.1.1. Temozolomide
- 10.2.1.2. Bevacizumab
- 10.2.1.3. Carmustine
- 10.2.1.4. Other Types of Chemotherapy
- 10.2.2. Targeted Drug Therapy
- 10.2.2.1. Epidermal Growth Factor Receptor (EGFR) Inhibitors
- 10.2.2.2. Other Monoclonal Antibodies
- 10.2.3. Radiation Therapy
- 10.2.1. Chemotherapy
- 10.1. Market Analysis, Insights and Forecast - by Type of Disease
- 11. North America Anaplastic Astrocytoma Industry Analysis, Insights and Forecast, 2019-2031
- 11.1. Market Analysis, Insights and Forecast - By Country/Sub-region
- 11.1.1 United States
- 11.1.2 Canada
- 11.1.3 Mexico
- 12. Europe Anaplastic Astrocytoma Industry Analysis, Insights and Forecast, 2019-2031
- 12.1. Market Analysis, Insights and Forecast - By Country/Sub-region
- 12.1.1 Germany
- 12.1.2 United Kingdom
- 12.1.3 France
- 12.1.4 Italy
- 12.1.5 Spain
- 12.1.6 Rest of Europe
- 13. Asia Pacific Anaplastic Astrocytoma Industry Analysis, Insights and Forecast, 2019-2031
- 13.1. Market Analysis, Insights and Forecast - By Country/Sub-region
- 13.1.1 China
- 13.1.2 Japan
- 13.1.3 India
- 13.1.4 Australia
- 13.1.5 South Korea
- 13.1.6 Rest of Asia Pacific
- 14. Middle East and Africa Anaplastic Astrocytoma Industry Analysis, Insights and Forecast, 2019-2031
- 14.1. Market Analysis, Insights and Forecast - By Country/Sub-region
- 14.1.1 GCC
- 14.1.2 South Africa
- 14.1.3 Rest of Middle East and Africa
- 15. South America Anaplastic Astrocytoma Industry Analysis, Insights and Forecast, 2019-2031
- 15.1. Market Analysis, Insights and Forecast - By Country/Sub-region
- 15.1.1 Brazil
- 15.1.2 Argentina
- 15.1.3 Rest of South America
- 16. Competitive Analysis
- 16.1. Global Market Share Analysis 2024
- 16.2. Company Profiles
- 16.2.1 Sun Pharmaceuticals Ltd
- 16.2.1.1. Overview
- 16.2.1.2. Products
- 16.2.1.3. SWOT Analysis
- 16.2.1.4. Recent Developments
- 16.2.1.5. Financials (Based on Availability)
- 16.2.2 Merck & Co Inc *List Not Exhaustive
- 16.2.2.1. Overview
- 16.2.2.2. Products
- 16.2.2.3. SWOT Analysis
- 16.2.2.4. Recent Developments
- 16.2.2.5. Financials (Based on Availability)
- 16.2.3 Amgen Inc
- 16.2.3.1. Overview
- 16.2.3.2. Products
- 16.2.3.3. SWOT Analysis
- 16.2.3.4. Recent Developments
- 16.2.3.5. Financials (Based on Availability)
- 16.2.4 F Hoffmann-La Roche Ltd
- 16.2.4.1. Overview
- 16.2.4.2. Products
- 16.2.4.3. SWOT Analysis
- 16.2.4.4. Recent Developments
- 16.2.4.5. Financials (Based on Availability)
- 16.2.5 Bio Rad Laboratories
- 16.2.5.1. Overview
- 16.2.5.2. Products
- 16.2.5.3. SWOT Analysis
- 16.2.5.4. Recent Developments
- 16.2.5.5. Financials (Based on Availability)
- 16.2.6 AbbVie Inc
- 16.2.6.1. Overview
- 16.2.6.2. Products
- 16.2.6.3. SWOT Analysis
- 16.2.6.4. Recent Developments
- 16.2.6.5. Financials (Based on Availability)
- 16.2.7 Arbor Pharmaceuticals
- 16.2.7.1. Overview
- 16.2.7.2. Products
- 16.2.7.3. SWOT Analysis
- 16.2.7.4. Recent Developments
- 16.2.7.5. Financials (Based on Availability)
- 16.2.8 Bristol-Myers Squibb Company
- 16.2.8.1. Overview
- 16.2.8.2. Products
- 16.2.8.3. SWOT Analysis
- 16.2.8.4. Recent Developments
- 16.2.8.5. Financials (Based on Availability)
- 16.2.9 Pfizer Inc
- 16.2.9.1. Overview
- 16.2.9.2. Products
- 16.2.9.3. SWOT Analysis
- 16.2.9.4. Recent Developments
- 16.2.9.5. Financials (Based on Availability)
- 16.2.1 Sun Pharmaceuticals Ltd
List of Figures
- Figure 1: Global Anaplastic Astrocytoma Industry Revenue Breakdown (Million, %) by Region 2024 & 2032
- Figure 2: North America Anaplastic Astrocytoma Industry Revenue (Million), by Country 2024 & 2032
- Figure 3: North America Anaplastic Astrocytoma Industry Revenue Share (%), by Country 2024 & 2032
- Figure 4: Europe Anaplastic Astrocytoma Industry Revenue (Million), by Country 2024 & 2032
- Figure 5: Europe Anaplastic Astrocytoma Industry Revenue Share (%), by Country 2024 & 2032
- Figure 6: Asia Pacific Anaplastic Astrocytoma Industry Revenue (Million), by Country 2024 & 2032
- Figure 7: Asia Pacific Anaplastic Astrocytoma Industry Revenue Share (%), by Country 2024 & 2032
- Figure 8: Middle East and Africa Anaplastic Astrocytoma Industry Revenue (Million), by Country 2024 & 2032
- Figure 9: Middle East and Africa Anaplastic Astrocytoma Industry Revenue Share (%), by Country 2024 & 2032
- Figure 10: South America Anaplastic Astrocytoma Industry Revenue (Million), by Country 2024 & 2032
- Figure 11: South America Anaplastic Astrocytoma Industry Revenue Share (%), by Country 2024 & 2032
- Figure 12: North America Anaplastic Astrocytoma Industry Revenue (Million), by Type of Disease 2024 & 2032
- Figure 13: North America Anaplastic Astrocytoma Industry Revenue Share (%), by Type of Disease 2024 & 2032
- Figure 14: North America Anaplastic Astrocytoma Industry Revenue (Million), by Therapy 2024 & 2032
- Figure 15: North America Anaplastic Astrocytoma Industry Revenue Share (%), by Therapy 2024 & 2032
- Figure 16: North America Anaplastic Astrocytoma Industry Revenue (Million), by Country 2024 & 2032
- Figure 17: North America Anaplastic Astrocytoma Industry Revenue Share (%), by Country 2024 & 2032
- Figure 18: Europe Anaplastic Astrocytoma Industry Revenue (Million), by Type of Disease 2024 & 2032
- Figure 19: Europe Anaplastic Astrocytoma Industry Revenue Share (%), by Type of Disease 2024 & 2032
- Figure 20: Europe Anaplastic Astrocytoma Industry Revenue (Million), by Therapy 2024 & 2032
- Figure 21: Europe Anaplastic Astrocytoma Industry Revenue Share (%), by Therapy 2024 & 2032
- Figure 22: Europe Anaplastic Astrocytoma Industry Revenue (Million), by Country 2024 & 2032
- Figure 23: Europe Anaplastic Astrocytoma Industry Revenue Share (%), by Country 2024 & 2032
- Figure 24: Asia Pacific Anaplastic Astrocytoma Industry Revenue (Million), by Type of Disease 2024 & 2032
- Figure 25: Asia Pacific Anaplastic Astrocytoma Industry Revenue Share (%), by Type of Disease 2024 & 2032
- Figure 26: Asia Pacific Anaplastic Astrocytoma Industry Revenue (Million), by Therapy 2024 & 2032
- Figure 27: Asia Pacific Anaplastic Astrocytoma Industry Revenue Share (%), by Therapy 2024 & 2032
- Figure 28: Asia Pacific Anaplastic Astrocytoma Industry Revenue (Million), by Country 2024 & 2032
- Figure 29: Asia Pacific Anaplastic Astrocytoma Industry Revenue Share (%), by Country 2024 & 2032
- Figure 30: Middle East and Africa Anaplastic Astrocytoma Industry Revenue (Million), by Type of Disease 2024 & 2032
- Figure 31: Middle East and Africa Anaplastic Astrocytoma Industry Revenue Share (%), by Type of Disease 2024 & 2032
- Figure 32: Middle East and Africa Anaplastic Astrocytoma Industry Revenue (Million), by Therapy 2024 & 2032
- Figure 33: Middle East and Africa Anaplastic Astrocytoma Industry Revenue Share (%), by Therapy 2024 & 2032
- Figure 34: Middle East and Africa Anaplastic Astrocytoma Industry Revenue (Million), by Country 2024 & 2032
- Figure 35: Middle East and Africa Anaplastic Astrocytoma Industry Revenue Share (%), by Country 2024 & 2032
- Figure 36: South America Anaplastic Astrocytoma Industry Revenue (Million), by Type of Disease 2024 & 2032
- Figure 37: South America Anaplastic Astrocytoma Industry Revenue Share (%), by Type of Disease 2024 & 2032
- Figure 38: South America Anaplastic Astrocytoma Industry Revenue (Million), by Therapy 2024 & 2032
- Figure 39: South America Anaplastic Astrocytoma Industry Revenue Share (%), by Therapy 2024 & 2032
- Figure 40: South America Anaplastic Astrocytoma Industry Revenue (Million), by Country 2024 & 2032
- Figure 41: South America Anaplastic Astrocytoma Industry Revenue Share (%), by Country 2024 & 2032
List of Tables
- Table 1: Global Anaplastic Astrocytoma Industry Revenue Million Forecast, by Region 2019 & 2032
- Table 2: Global Anaplastic Astrocytoma Industry Revenue Million Forecast, by Type of Disease 2019 & 2032
- Table 3: Global Anaplastic Astrocytoma Industry Revenue Million Forecast, by Therapy 2019 & 2032
- Table 4: Global Anaplastic Astrocytoma Industry Revenue Million Forecast, by Region 2019 & 2032
- Table 5: Global Anaplastic Astrocytoma Industry Revenue Million Forecast, by Country 2019 & 2032
- Table 6: United States Anaplastic Astrocytoma Industry Revenue (Million) Forecast, by Application 2019 & 2032
- Table 7: Canada Anaplastic Astrocytoma Industry Revenue (Million) Forecast, by Application 2019 & 2032
- Table 8: Mexico Anaplastic Astrocytoma Industry Revenue (Million) Forecast, by Application 2019 & 2032
- Table 9: Global Anaplastic Astrocytoma Industry Revenue Million Forecast, by Country 2019 & 2032
- Table 10: Germany Anaplastic Astrocytoma Industry Revenue (Million) Forecast, by Application 2019 & 2032
- Table 11: United Kingdom Anaplastic Astrocytoma Industry Revenue (Million) Forecast, by Application 2019 & 2032
- Table 12: France Anaplastic Astrocytoma Industry Revenue (Million) Forecast, by Application 2019 & 2032
- Table 13: Italy Anaplastic Astrocytoma Industry Revenue (Million) Forecast, by Application 2019 & 2032
- Table 14: Spain Anaplastic Astrocytoma Industry Revenue (Million) Forecast, by Application 2019 & 2032
- Table 15: Rest of Europe Anaplastic Astrocytoma Industry Revenue (Million) Forecast, by Application 2019 & 2032
- Table 16: Global Anaplastic Astrocytoma Industry Revenue Million Forecast, by Country 2019 & 2032
- Table 17: China Anaplastic Astrocytoma Industry Revenue (Million) Forecast, by Application 2019 & 2032
- Table 18: Japan Anaplastic Astrocytoma Industry Revenue (Million) Forecast, by Application 2019 & 2032
- Table 19: India Anaplastic Astrocytoma Industry Revenue (Million) Forecast, by Application 2019 & 2032
- Table 20: Australia Anaplastic Astrocytoma Industry Revenue (Million) Forecast, by Application 2019 & 2032
- Table 21: South Korea Anaplastic Astrocytoma Industry Revenue (Million) Forecast, by Application 2019 & 2032
- Table 22: Rest of Asia Pacific Anaplastic Astrocytoma Industry Revenue (Million) Forecast, by Application 2019 & 2032
- Table 23: Global Anaplastic Astrocytoma Industry Revenue Million Forecast, by Country 2019 & 2032
- Table 24: GCC Anaplastic Astrocytoma Industry Revenue (Million) Forecast, by Application 2019 & 2032
- Table 25: South Africa Anaplastic Astrocytoma Industry Revenue (Million) Forecast, by Application 2019 & 2032
- Table 26: Rest of Middle East and Africa Anaplastic Astrocytoma Industry Revenue (Million) Forecast, by Application 2019 & 2032
- Table 27: Global Anaplastic Astrocytoma Industry Revenue Million Forecast, by Country 2019 & 2032
- Table 28: Brazil Anaplastic Astrocytoma Industry Revenue (Million) Forecast, by Application 2019 & 2032
- Table 29: Argentina Anaplastic Astrocytoma Industry Revenue (Million) Forecast, by Application 2019 & 2032
- Table 30: Rest of South America Anaplastic Astrocytoma Industry Revenue (Million) Forecast, by Application 2019 & 2032
- Table 31: Global Anaplastic Astrocytoma Industry Revenue Million Forecast, by Type of Disease 2019 & 2032
- Table 32: Global Anaplastic Astrocytoma Industry Revenue Million Forecast, by Therapy 2019 & 2032
- Table 33: Global Anaplastic Astrocytoma Industry Revenue Million Forecast, by Country 2019 & 2032
- Table 34: United States Anaplastic Astrocytoma Industry Revenue (Million) Forecast, by Application 2019 & 2032
- Table 35: Canada Anaplastic Astrocytoma Industry Revenue (Million) Forecast, by Application 2019 & 2032
- Table 36: Mexico Anaplastic Astrocytoma Industry Revenue (Million) Forecast, by Application 2019 & 2032
- Table 37: Global Anaplastic Astrocytoma Industry Revenue Million Forecast, by Type of Disease 2019 & 2032
- Table 38: Global Anaplastic Astrocytoma Industry Revenue Million Forecast, by Therapy 2019 & 2032
- Table 39: Global Anaplastic Astrocytoma Industry Revenue Million Forecast, by Country 2019 & 2032
- Table 40: Germany Anaplastic Astrocytoma Industry Revenue (Million) Forecast, by Application 2019 & 2032
- Table 41: United Kingdom Anaplastic Astrocytoma Industry Revenue (Million) Forecast, by Application 2019 & 2032
- Table 42: France Anaplastic Astrocytoma Industry Revenue (Million) Forecast, by Application 2019 & 2032
- Table 43: Italy Anaplastic Astrocytoma Industry Revenue (Million) Forecast, by Application 2019 & 2032
- Table 44: Spain Anaplastic Astrocytoma Industry Revenue (Million) Forecast, by Application 2019 & 2032
- Table 45: Rest of Europe Anaplastic Astrocytoma Industry Revenue (Million) Forecast, by Application 2019 & 2032
- Table 46: Global Anaplastic Astrocytoma Industry Revenue Million Forecast, by Type of Disease 2019 & 2032
- Table 47: Global Anaplastic Astrocytoma Industry Revenue Million Forecast, by Therapy 2019 & 2032
- Table 48: Global Anaplastic Astrocytoma Industry Revenue Million Forecast, by Country 2019 & 2032
- Table 49: China Anaplastic Astrocytoma Industry Revenue (Million) Forecast, by Application 2019 & 2032
- Table 50: Japan Anaplastic Astrocytoma Industry Revenue (Million) Forecast, by Application 2019 & 2032
- Table 51: India Anaplastic Astrocytoma Industry Revenue (Million) Forecast, by Application 2019 & 2032
- Table 52: Australia Anaplastic Astrocytoma Industry Revenue (Million) Forecast, by Application 2019 & 2032
- Table 53: South Korea Anaplastic Astrocytoma Industry Revenue (Million) Forecast, by Application 2019 & 2032
- Table 54: Rest of Asia Pacific Anaplastic Astrocytoma Industry Revenue (Million) Forecast, by Application 2019 & 2032
- Table 55: Global Anaplastic Astrocytoma Industry Revenue Million Forecast, by Type of Disease 2019 & 2032
- Table 56: Global Anaplastic Astrocytoma Industry Revenue Million Forecast, by Therapy 2019 & 2032
- Table 57: Global Anaplastic Astrocytoma Industry Revenue Million Forecast, by Country 2019 & 2032
- Table 58: GCC Anaplastic Astrocytoma Industry Revenue (Million) Forecast, by Application 2019 & 2032
- Table 59: South Africa Anaplastic Astrocytoma Industry Revenue (Million) Forecast, by Application 2019 & 2032
- Table 60: Rest of Middle East and Africa Anaplastic Astrocytoma Industry Revenue (Million) Forecast, by Application 2019 & 2032
- Table 61: Global Anaplastic Astrocytoma Industry Revenue Million Forecast, by Type of Disease 2019 & 2032
- Table 62: Global Anaplastic Astrocytoma Industry Revenue Million Forecast, by Therapy 2019 & 2032
- Table 63: Global Anaplastic Astrocytoma Industry Revenue Million Forecast, by Country 2019 & 2032
- Table 64: Brazil Anaplastic Astrocytoma Industry Revenue (Million) Forecast, by Application 2019 & 2032
- Table 65: Argentina Anaplastic Astrocytoma Industry Revenue (Million) Forecast, by Application 2019 & 2032
- Table 66: Rest of South America Anaplastic Astrocytoma Industry Revenue (Million) Forecast, by Application 2019 & 2032
Frequently Asked Questions
1. What is the projected Compound Annual Growth Rate (CAGR) of the Anaplastic Astrocytoma Industry?
The projected CAGR is approximately 9.60%.
2. Which companies are prominent players in the Anaplastic Astrocytoma Industry?
Key companies in the market include Sun Pharmaceuticals Ltd, Merck & Co Inc *List Not Exhaustive, Amgen Inc, F Hoffmann-La Roche Ltd, Bio Rad Laboratories, AbbVie Inc, Arbor Pharmaceuticals, Bristol-Myers Squibb Company, Pfizer Inc.
3. What are the main segments of the Anaplastic Astrocytoma Industry?
The market segments include Type of Disease, Therapy.
4. Can you provide details about the market size?
The market size is estimated to be USD XX Million as of 2022.
5. What are some drivers contributing to market growth?
High Burden of Brain Cancer and Malignant Gliomas; Rising Funding for Research and Development.
6. What are the notable trends driving market growth?
The Glioblastoma Multiforme Segment is Expected to Hold a Significant Growth Over The Forecast Period.
7. Are there any restraints impacting market growth?
Diminishing Preference for Chemotherapy; Low Approval Rates for Novel Therapeutics for Glioma.
8. Can you provide examples of recent developments in the market?
January 2023: Stanford University and The Invus Group, an investment firm, formed a collaboration to develop treatments for glioblastoma, a type of brain cancer. The collaboration between Stanford University and the Invus Group will enable the development of medication to treat glioblastoma.
9. What pricing options are available for accessing the report?
Pricing options include single-user, multi-user, and enterprise licenses priced at USD 4750, USD 5250, and USD 8750 respectively.
10. Is the market size provided in terms of value or volume?
The market size is provided in terms of value, measured in Million.
11. Are there any specific market keywords associated with the report?
Yes, the market keyword associated with the report is "Anaplastic Astrocytoma Industry," which aids in identifying and referencing the specific market segment covered.
12. How do I determine which pricing option suits my needs best?
The pricing options vary based on user requirements and access needs. Individual users may opt for single-user licenses, while businesses requiring broader access may choose multi-user or enterprise licenses for cost-effective access to the report.
13. Are there any additional resources or data provided in the Anaplastic Astrocytoma Industry report?
While the report offers comprehensive insights, it's advisable to review the specific contents or supplementary materials provided to ascertain if additional resources or data are available.
14. How can I stay updated on further developments or reports in the Anaplastic Astrocytoma Industry?
To stay informed about further developments, trends, and reports in the Anaplastic Astrocytoma Industry, consider subscribing to industry newsletters, following relevant companies and organizations, or regularly checking reputable industry news sources and publications.
Methodology
Step 1 - Identification of Relevant Samples Size from Population Database


Step 2 - Approaches for Defining Global Market Size (Value, Volume* & Price*)

Note*: In applicable scenarios
Step 3 - Data Sources
Primary Research
- Web Analytics
- Survey Reports
- Research Institute
- Latest Research Reports
- Opinion Leaders
Secondary Research
- Annual Reports
- White Paper
- Latest Press Release
- Industry Association
- Paid Database
- Investor Presentations

Step 4 - Data Triangulation
Involves using different sources of information in order to increase the validity of a study
These sources are likely to be stakeholders in a program - participants, other researchers, program staff, other community members, and so on.
Then we put all data in single framework & apply various statistical tools to find out the dynamic on the market.
During the analysis stage, feedback from the stakeholder groups would be compared to determine areas of agreement as well as areas of divergence
