

Key Insights
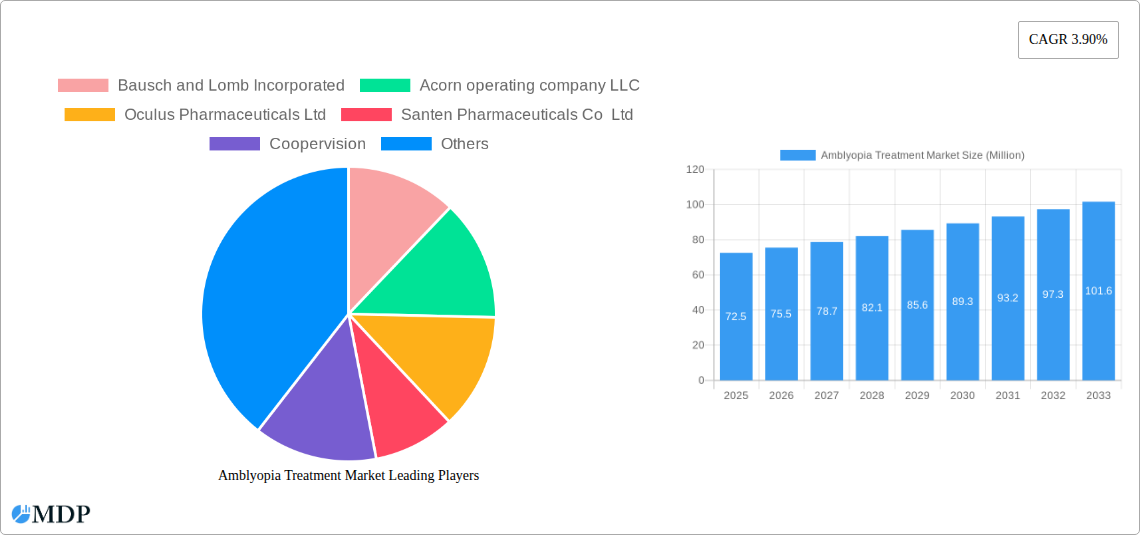
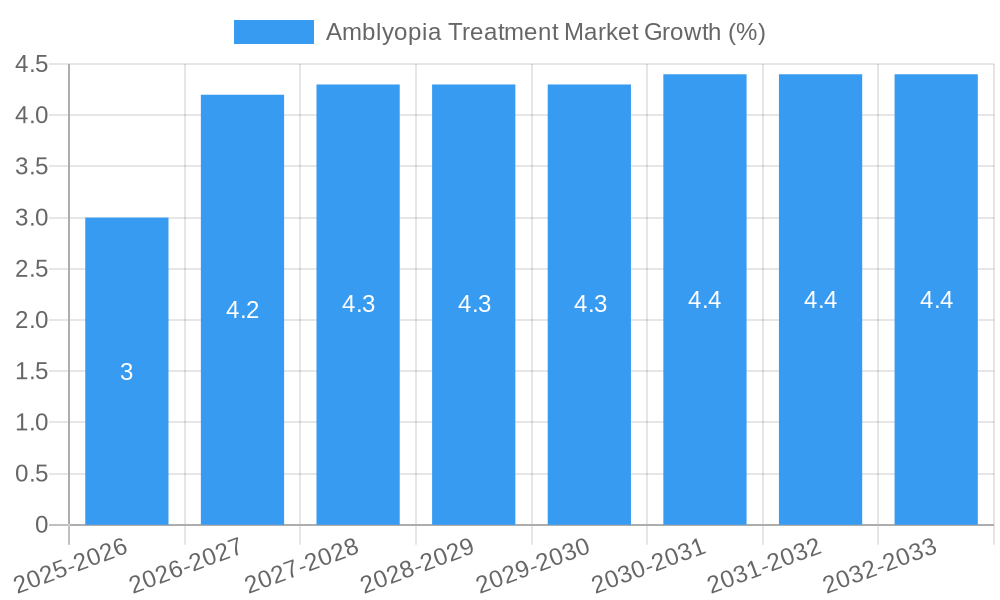
The amblyopia treatment market, valued at $72.5 million in 2025, is projected to experience steady growth, driven by increasing awareness of the condition and advancements in treatment technologies. A compound annual growth rate (CAGR) of 3.90% from 2025 to 2033 indicates a substantial market expansion over the forecast period. Key drivers include rising prevalence of amblyopia, particularly in pediatric populations, coupled with the development of more effective and less invasive treatment options. Technological advancements, such as improved patching techniques, sophisticated vision therapy programs, and the exploration of pharmacological interventions, are significantly contributing to market growth. While the market faces certain restraints, such as the high cost of advanced therapies and potential patient non-compliance with treatment regimens, the overall positive trajectory is driven by the significant unmet medical need and continuous innovation within the field. Competitive landscape analysis reveals a mix of established players like Bausch + Lomb and CooperVision alongside smaller, specialized companies focusing on niche therapies. The market is expected to see further consolidation and potential entry of new players with innovative solutions. Geographic expansion, particularly in emerging markets with limited access to eye care, presents substantial opportunities for market growth in the coming years.
The forecast for the amblyopia treatment market suggests continued expansion, with increased adoption of minimally invasive procedures and the potential for novel therapeutic approaches. This positive growth outlook stems from the rising prevalence of amblyopia globally and the continued research and development efforts focused on improving treatment efficacy and patient outcomes. Furthermore, increased government initiatives and public health awareness campaigns promoting early detection and intervention are likely to bolster market growth. The market's segmentation, which would likely include treatments based on technology (e.g., patching, vision therapy, pharmacological interventions), age group, and geographic location, will provide valuable insights into specific market dynamics and inform strategic decision-making. The success of companies within the amblyopia treatment market will hinge on their ability to adapt to evolving technologies, meet the diverse needs of patients, and ensure accessibility of effective therapies across different regions and healthcare settings.
Amblyopia Treatment Market Report: A Comprehensive Analysis (2019-2033)
This comprehensive report offers a detailed analysis of the Amblyopia Treatment Market, providing invaluable insights for industry stakeholders, investors, and researchers. With a focus on market dynamics, leading players, and emerging trends, this report covers the period from 2019 to 2033, using 2025 as the base year and projecting growth until 2033. The market is expected to reach xx Million by 2033, exhibiting a CAGR of xx% during the forecast period.
Amblyopia Treatment Market Market Dynamics & Concentration
The Amblyopia Treatment Market is characterized by a moderately concentrated landscape with several key players holding significant market share. Bausch and Lomb Incorporated, Acorn operating company LLC, Oculus Pharmaceuticals Ltd, and Santen Pharmaceuticals Co Ltd are among the prominent companies shaping market dynamics. The market is witnessing increased innovation, driven by advancements in vision therapy software, virtual reality (VR) applications, and improved patching techniques. Stringent regulatory frameworks, especially concerning medical device approvals, significantly impact market entry and expansion. Several substitute therapies exist, including patching and atropine, creating competition for newer technologies. End-user trends favor minimally invasive and technologically advanced treatments, influencing product development strategies. The number of M&A activities in the market has been relatively low in the last five years, with approximately xx deals recorded, suggesting a stable but consolidating market. Market share for the top 5 players is estimated at xx% in 2025, indicating a moderate level of market concentration.
- Innovation Drivers: VR/AR technologies, improved vision therapy software, and advancements in patching materials.
- Regulatory Frameworks: Stringent approvals for medical devices and software applications.
- Product Substitutes: Traditional patching methods, atropine eye drops.
- End-User Trends: Demand for non-invasive, effective, and technologically advanced treatments.
- M&A Activities: xx deals in the last five years (2020-2024), indicating a stable, but consolidating market.
Amblyopia Treatment Market Industry Trends & Analysis
The Amblyopia Treatment Market is experiencing robust growth, driven primarily by increasing awareness about amblyopia and the availability of innovative treatment options. Technological advancements, particularly the integration of VR and AR technologies, are revolutionizing treatment approaches. Consumer preferences are shifting towards non-invasive, comfortable, and engaging therapies, particularly for children. This trend fuels the adoption of gamified vision therapy software and VR-based applications. The market is experiencing significant competitive pressure, with companies vying for market share through product innovation, strategic partnerships, and targeted marketing. The market’s CAGR during the forecast period (2025-2033) is projected to be xx%, driven by increasing awareness and technological advancements. Market penetration of VR-based therapies is currently at xx%, but is expected to increase to xx% by 2033.
Leading Markets & Segments in Amblyopia Treatment Market
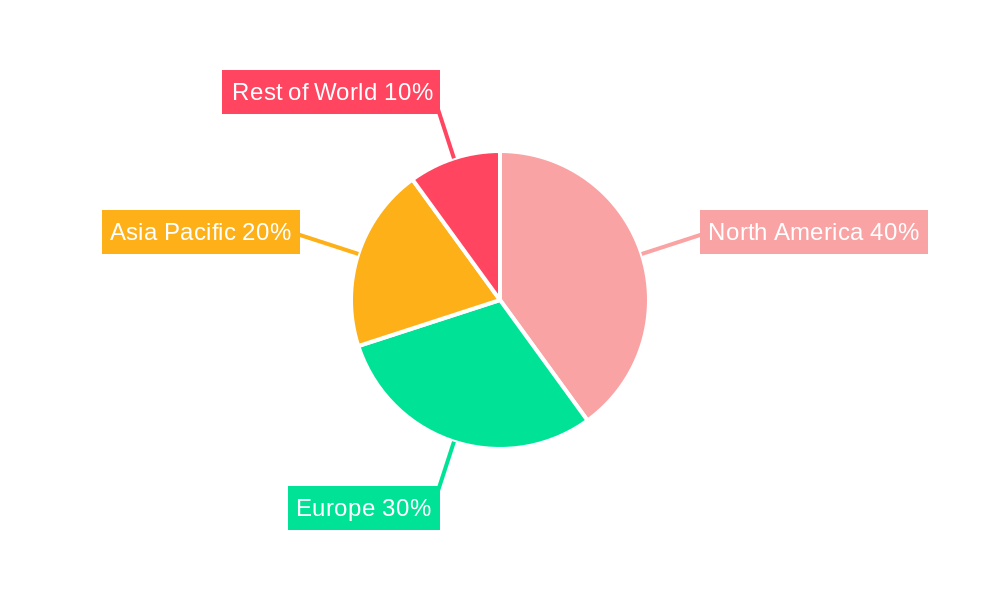
The North American region currently dominates the Amblyopia Treatment Market, primarily due to high healthcare expenditure, robust technological infrastructure, and increased awareness of amblyopia. Europe holds the second largest market share, with similar drivers contributing to its growth. Within these regions, the pediatric segment represents a significant market share due to the higher prevalence of amblyopia in children.
- Key Drivers in North America: High healthcare expenditure, advanced medical infrastructure, strong regulatory support for innovation.
- Key Drivers in Europe: Growing awareness of amblyopia, increasing adoption of advanced treatment technologies, supportive government policies.
- Dominance Analysis: North America’s dominance stems from a combination of factors, including higher disposable incomes, robust healthcare systems, and the presence of major market players and research institutions. The high prevalence of amblyopia in the pediatric population also contributes to strong market growth in this region.
Amblyopia Treatment Market Product Developments
Recent product innovations have focused on enhancing the user experience and therapeutic efficacy. The introduction of gamified vision therapy software and VR applications addresses the challenges of compliance and engagement, particularly among children. These advancements leverage technology to create immersive and engaging treatment experiences, improving treatment outcomes. Competitive advantages stem from superior user interface design, advanced algorithms for personalized treatment, and integration with remote monitoring systems. The trend towards personalized medicine and remote patient monitoring is driving significant product development efforts.
Key Drivers of Amblyopia Treatment Market Growth
Several factors contribute to the growth of the Amblyopia Treatment Market. Technological advancements, such as the integration of VR and AR technologies, significantly improve treatment efficacy and patient compliance. Increasing awareness of amblyopia among healthcare professionals and the general public is driving greater demand for treatment. Favorable regulatory environments in several regions support innovation and market entry for new therapies. Furthermore, rising healthcare expenditure and improved access to healthcare services are key factors boosting market growth.
Challenges in the Amblyopia Treatment Market Market
The Amblyopia Treatment Market faces several challenges. Stringent regulatory hurdles for medical device and software approvals can slow down market entry for new products. Supply chain disruptions can affect the availability of treatment devices and materials. Intense competition among established players and new entrants puts pressure on pricing and profit margins. The high cost of advanced therapies can limit access for some patients, creating a barrier to market penetration. These challenges, if not effectively addressed, could hinder market growth.
Emerging Opportunities in Amblyopia Treatment Market
Several emerging opportunities are poised to drive long-term growth in the Amblyopia Treatment Market. Technological breakthroughs, particularly in AI-powered vision therapy and advanced imaging techniques, offer the potential for more personalized and effective treatments. Strategic partnerships between technology companies and healthcare providers can accelerate product development and market penetration. Expanding access to treatment in underserved regions through telemedicine and remote monitoring can significantly increase the market reach and positive social impact.
Leading Players in the Amblyopia Treatment Market Sector
- Bausch and Lomb Incorporated
- Acorn operating company LLC
- Oculus Pharmaceuticals Ltd
- Santen Pharmaceuticals Co Ltd
- CooperVision
- Frensel prism and lens Co
- Hilco Vision
- Good-Lite
- Vivid Vision Inc
- Krafty Eye patches
- Hoya Vision Care
- Orthopad USA
Key Milestones in Amblyopia Treatment Market Industry
- October 2023: Bynocs launched AmblyGo, a vision therapy software program using 3D anaglyph glasses for amblyopia treatment. This launch signifies the growing trend of gamified vision therapy.
- January 2023: InnoJin Inc., Sumitomo Corporation, and ImaCreate Co. Ltd. partnered to develop a VR-based amblyopia treatment app. This collaboration highlights the increasing role of VR technology in the treatment of amblyopia.
Strategic Outlook for Amblyopia Treatment Market Market
The Amblyopia Treatment Market presents significant growth potential driven by technological innovations and increasing awareness. Future market success will hinge on developing personalized, accessible, and engaging therapies. Strategic partnerships, focusing on integrating advanced technologies like AI and VR, will be crucial. Companies that proactively address regulatory hurdles and prioritize patient accessibility will be best positioned for long-term success in this dynamic market. Expansion into emerging markets and development of cost-effective solutions will also be key growth accelerators.
Amblyopia Treatment Market Segmentation
-
1. Type
- 1.1. Strabismic Amblyopia
- 1.2. Refractive Ambylopia
- 1.3. Deprivation Amblyopia
-
2. Treatment Products
- 2.1. Eye Patches
- 2.2. Atropine Drops
- 2.3. Glasses
- 2.4. Video Games
Amblyopia Treatment Market Segmentation By Geography
-
1. North America
- 1.1. United States
- 1.2. Canada
- 1.3. Mexico
-
2. Europe
- 2.1. Germany
- 2.2. United Kingdom
- 2.3. France
- 2.4. Italy
- 2.5. Spain
- 2.6. Rest of Europe
-
3. Asia Pacific
- 3.1. China
- 3.2. Japan
- 3.3. India
- 3.4. Australia
- 3.5. South Korea
- 3.6. Rest of Asia Pacific
-
4. Middle East and Africa
- 4.1. GCC
- 4.2. South Africa
- 4.3. Rest of Middle East and Africa
-
5. South America
- 5.1. Brazil
- 5.2. Argentina
- 5.3. Rest of South America
Amblyopia Treatment Market REPORT HIGHLIGHTS
| Aspects | Details |
|---|---|
| Study Period | 2019-2033 |
| Base Year | 2024 |
| Estimated Year | 2025 |
| Forecast Period | 2025-2033 |
| Historical Period | 2019-2024 |
| Growth Rate | CAGR of 3.90% from 2019-2033 |
| Segmentation |
|
Table of Contents
- 1. Introduction
- 1.1. Research Scope
- 1.2. Market Segmentation
- 1.3. Research Methodology
- 1.4. Definitions and Assumptions
- 2. Executive Summary
- 2.1. Introduction
- 3. Market Dynamics
- 3.1. Introduction
- 3.2. Market Drivers
- 3.2.1. Rising Prevalence of Amblyopia; Increasing Technological Advancements for the Treatment of Amblyopia
- 3.3. Market Restrains
- 3.3.1. Rising Prevalence of Amblyopia; Increasing Technological Advancements for the Treatment of Amblyopia
- 3.4. Market Trends
- 3.4.1. The Strabismic Amblyopia Segment is Expected to Hold a Significant Market Share in the Amblyopia Treatment Market
- 4. Market Factor Analysis
- 4.1. Porters Five Forces
- 4.2. Supply/Value Chain
- 4.3. PESTEL analysis
- 4.4. Market Entropy
- 4.5. Patent/Trademark Analysis
- 5. Global Amblyopia Treatment Market Analysis, Insights and Forecast, 2019-2031
- 5.1. Market Analysis, Insights and Forecast - by Type
- 5.1.1. Strabismic Amblyopia
- 5.1.2. Refractive Ambylopia
- 5.1.3. Deprivation Amblyopia
- 5.2. Market Analysis, Insights and Forecast - by Treatment Products
- 5.2.1. Eye Patches
- 5.2.2. Atropine Drops
- 5.2.3. Glasses
- 5.2.4. Video Games
- 5.3. Market Analysis, Insights and Forecast - by Region
- 5.3.1. North America
- 5.3.2. Europe
- 5.3.3. Asia Pacific
- 5.3.4. Middle East and Africa
- 5.3.5. South America
- 5.1. Market Analysis, Insights and Forecast - by Type
- 6. North America Amblyopia Treatment Market Analysis, Insights and Forecast, 2019-2031
- 6.1. Market Analysis, Insights and Forecast - by Type
- 6.1.1. Strabismic Amblyopia
- 6.1.2. Refractive Ambylopia
- 6.1.3. Deprivation Amblyopia
- 6.2. Market Analysis, Insights and Forecast - by Treatment Products
- 6.2.1. Eye Patches
- 6.2.2. Atropine Drops
- 6.2.3. Glasses
- 6.2.4. Video Games
- 6.1. Market Analysis, Insights and Forecast - by Type
- 7. Europe Amblyopia Treatment Market Analysis, Insights and Forecast, 2019-2031
- 7.1. Market Analysis, Insights and Forecast - by Type
- 7.1.1. Strabismic Amblyopia
- 7.1.2. Refractive Ambylopia
- 7.1.3. Deprivation Amblyopia
- 7.2. Market Analysis, Insights and Forecast - by Treatment Products
- 7.2.1. Eye Patches
- 7.2.2. Atropine Drops
- 7.2.3. Glasses
- 7.2.4. Video Games
- 7.1. Market Analysis, Insights and Forecast - by Type
- 8. Asia Pacific Amblyopia Treatment Market Analysis, Insights and Forecast, 2019-2031
- 8.1. Market Analysis, Insights and Forecast - by Type
- 8.1.1. Strabismic Amblyopia
- 8.1.2. Refractive Ambylopia
- 8.1.3. Deprivation Amblyopia
- 8.2. Market Analysis, Insights and Forecast - by Treatment Products
- 8.2.1. Eye Patches
- 8.2.2. Atropine Drops
- 8.2.3. Glasses
- 8.2.4. Video Games
- 8.1. Market Analysis, Insights and Forecast - by Type
- 9. Middle East and Africa Amblyopia Treatment Market Analysis, Insights and Forecast, 2019-2031
- 9.1. Market Analysis, Insights and Forecast - by Type
- 9.1.1. Strabismic Amblyopia
- 9.1.2. Refractive Ambylopia
- 9.1.3. Deprivation Amblyopia
- 9.2. Market Analysis, Insights and Forecast - by Treatment Products
- 9.2.1. Eye Patches
- 9.2.2. Atropine Drops
- 9.2.3. Glasses
- 9.2.4. Video Games
- 9.1. Market Analysis, Insights and Forecast - by Type
- 10. South America Amblyopia Treatment Market Analysis, Insights and Forecast, 2019-2031
- 10.1. Market Analysis, Insights and Forecast - by Type
- 10.1.1. Strabismic Amblyopia
- 10.1.2. Refractive Ambylopia
- 10.1.3. Deprivation Amblyopia
- 10.2. Market Analysis, Insights and Forecast - by Treatment Products
- 10.2.1. Eye Patches
- 10.2.2. Atropine Drops
- 10.2.3. Glasses
- 10.2.4. Video Games
- 10.1. Market Analysis, Insights and Forecast - by Type
- 11. Competitive Analysis
- 11.1. Global Market Share Analysis 2024
- 11.2. Company Profiles
- 11.2.1 Bausch and Lomb Incorporated
- 11.2.1.1. Overview
- 11.2.1.2. Products
- 11.2.1.3. SWOT Analysis
- 11.2.1.4. Recent Developments
- 11.2.1.5. Financials (Based on Availability)
- 11.2.2 Acorn operating company LLC
- 11.2.2.1. Overview
- 11.2.2.2. Products
- 11.2.2.3. SWOT Analysis
- 11.2.2.4. Recent Developments
- 11.2.2.5. Financials (Based on Availability)
- 11.2.3 Oculus Pharmaceuticals Ltd
- 11.2.3.1. Overview
- 11.2.3.2. Products
- 11.2.3.3. SWOT Analysis
- 11.2.3.4. Recent Developments
- 11.2.3.5. Financials (Based on Availability)
- 11.2.4 Santen Pharmaceuticals Co Ltd
- 11.2.4.1. Overview
- 11.2.4.2. Products
- 11.2.4.3. SWOT Analysis
- 11.2.4.4. Recent Developments
- 11.2.4.5. Financials (Based on Availability)
- 11.2.5 Coopervision
- 11.2.5.1. Overview
- 11.2.5.2. Products
- 11.2.5.3. SWOT Analysis
- 11.2.5.4. Recent Developments
- 11.2.5.5. Financials (Based on Availability)
- 11.2.6 Frensel prism and lens Co
- 11.2.6.1. Overview
- 11.2.6.2. Products
- 11.2.6.3. SWOT Analysis
- 11.2.6.4. Recent Developments
- 11.2.6.5. Financials (Based on Availability)
- 11.2.7 Hilco Vision
- 11.2.7.1. Overview
- 11.2.7.2. Products
- 11.2.7.3. SWOT Analysis
- 11.2.7.4. Recent Developments
- 11.2.7.5. Financials (Based on Availability)
- 11.2.8 Good-Lite
- 11.2.8.1. Overview
- 11.2.8.2. Products
- 11.2.8.3. SWOT Analysis
- 11.2.8.4. Recent Developments
- 11.2.8.5. Financials (Based on Availability)
- 11.2.9 Vivid Vision Inc
- 11.2.9.1. Overview
- 11.2.9.2. Products
- 11.2.9.3. SWOT Analysis
- 11.2.9.4. Recent Developments
- 11.2.9.5. Financials (Based on Availability)
- 11.2.10 Krafty Eye patches
- 11.2.10.1. Overview
- 11.2.10.2. Products
- 11.2.10.3. SWOT Analysis
- 11.2.10.4. Recent Developments
- 11.2.10.5. Financials (Based on Availability)
- 11.2.11 Hoya Vision Care
- 11.2.11.1. Overview
- 11.2.11.2. Products
- 11.2.11.3. SWOT Analysis
- 11.2.11.4. Recent Developments
- 11.2.11.5. Financials (Based on Availability)
- 11.2.12 Orthopad USA*List Not Exhaustive
- 11.2.12.1. Overview
- 11.2.12.2. Products
- 11.2.12.3. SWOT Analysis
- 11.2.12.4. Recent Developments
- 11.2.12.5. Financials (Based on Availability)
- 11.2.1 Bausch and Lomb Incorporated
List of Figures
- Figure 1: Global Amblyopia Treatment Market Revenue Breakdown (Million, %) by Region 2024 & 2032
- Figure 2: Global Amblyopia Treatment Market Volume Breakdown (Million, %) by Region 2024 & 2032
- Figure 3: North America Amblyopia Treatment Market Revenue (Million), by Type 2024 & 2032
- Figure 4: North America Amblyopia Treatment Market Volume (Million), by Type 2024 & 2032
- Figure 5: North America Amblyopia Treatment Market Revenue Share (%), by Type 2024 & 2032
- Figure 6: North America Amblyopia Treatment Market Volume Share (%), by Type 2024 & 2032
- Figure 7: North America Amblyopia Treatment Market Revenue (Million), by Treatment Products 2024 & 2032
- Figure 8: North America Amblyopia Treatment Market Volume (Million), by Treatment Products 2024 & 2032
- Figure 9: North America Amblyopia Treatment Market Revenue Share (%), by Treatment Products 2024 & 2032
- Figure 10: North America Amblyopia Treatment Market Volume Share (%), by Treatment Products 2024 & 2032
- Figure 11: North America Amblyopia Treatment Market Revenue (Million), by Country 2024 & 2032
- Figure 12: North America Amblyopia Treatment Market Volume (Million), by Country 2024 & 2032
- Figure 13: North America Amblyopia Treatment Market Revenue Share (%), by Country 2024 & 2032
- Figure 14: North America Amblyopia Treatment Market Volume Share (%), by Country 2024 & 2032
- Figure 15: Europe Amblyopia Treatment Market Revenue (Million), by Type 2024 & 2032
- Figure 16: Europe Amblyopia Treatment Market Volume (Million), by Type 2024 & 2032
- Figure 17: Europe Amblyopia Treatment Market Revenue Share (%), by Type 2024 & 2032
- Figure 18: Europe Amblyopia Treatment Market Volume Share (%), by Type 2024 & 2032
- Figure 19: Europe Amblyopia Treatment Market Revenue (Million), by Treatment Products 2024 & 2032
- Figure 20: Europe Amblyopia Treatment Market Volume (Million), by Treatment Products 2024 & 2032
- Figure 21: Europe Amblyopia Treatment Market Revenue Share (%), by Treatment Products 2024 & 2032
- Figure 22: Europe Amblyopia Treatment Market Volume Share (%), by Treatment Products 2024 & 2032
- Figure 23: Europe Amblyopia Treatment Market Revenue (Million), by Country 2024 & 2032
- Figure 24: Europe Amblyopia Treatment Market Volume (Million), by Country 2024 & 2032
- Figure 25: Europe Amblyopia Treatment Market Revenue Share (%), by Country 2024 & 2032
- Figure 26: Europe Amblyopia Treatment Market Volume Share (%), by Country 2024 & 2032
- Figure 27: Asia Pacific Amblyopia Treatment Market Revenue (Million), by Type 2024 & 2032
- Figure 28: Asia Pacific Amblyopia Treatment Market Volume (Million), by Type 2024 & 2032
- Figure 29: Asia Pacific Amblyopia Treatment Market Revenue Share (%), by Type 2024 & 2032
- Figure 30: Asia Pacific Amblyopia Treatment Market Volume Share (%), by Type 2024 & 2032
- Figure 31: Asia Pacific Amblyopia Treatment Market Revenue (Million), by Treatment Products 2024 & 2032
- Figure 32: Asia Pacific Amblyopia Treatment Market Volume (Million), by Treatment Products 2024 & 2032
- Figure 33: Asia Pacific Amblyopia Treatment Market Revenue Share (%), by Treatment Products 2024 & 2032
- Figure 34: Asia Pacific Amblyopia Treatment Market Volume Share (%), by Treatment Products 2024 & 2032
- Figure 35: Asia Pacific Amblyopia Treatment Market Revenue (Million), by Country 2024 & 2032
- Figure 36: Asia Pacific Amblyopia Treatment Market Volume (Million), by Country 2024 & 2032
- Figure 37: Asia Pacific Amblyopia Treatment Market Revenue Share (%), by Country 2024 & 2032
- Figure 38: Asia Pacific Amblyopia Treatment Market Volume Share (%), by Country 2024 & 2032
- Figure 39: Middle East and Africa Amblyopia Treatment Market Revenue (Million), by Type 2024 & 2032
- Figure 40: Middle East and Africa Amblyopia Treatment Market Volume (Million), by Type 2024 & 2032
- Figure 41: Middle East and Africa Amblyopia Treatment Market Revenue Share (%), by Type 2024 & 2032
- Figure 42: Middle East and Africa Amblyopia Treatment Market Volume Share (%), by Type 2024 & 2032
- Figure 43: Middle East and Africa Amblyopia Treatment Market Revenue (Million), by Treatment Products 2024 & 2032
- Figure 44: Middle East and Africa Amblyopia Treatment Market Volume (Million), by Treatment Products 2024 & 2032
- Figure 45: Middle East and Africa Amblyopia Treatment Market Revenue Share (%), by Treatment Products 2024 & 2032
- Figure 46: Middle East and Africa Amblyopia Treatment Market Volume Share (%), by Treatment Products 2024 & 2032
- Figure 47: Middle East and Africa Amblyopia Treatment Market Revenue (Million), by Country 2024 & 2032
- Figure 48: Middle East and Africa Amblyopia Treatment Market Volume (Million), by Country 2024 & 2032
- Figure 49: Middle East and Africa Amblyopia Treatment Market Revenue Share (%), by Country 2024 & 2032
- Figure 50: Middle East and Africa Amblyopia Treatment Market Volume Share (%), by Country 2024 & 2032
- Figure 51: South America Amblyopia Treatment Market Revenue (Million), by Type 2024 & 2032
- Figure 52: South America Amblyopia Treatment Market Volume (Million), by Type 2024 & 2032
- Figure 53: South America Amblyopia Treatment Market Revenue Share (%), by Type 2024 & 2032
- Figure 54: South America Amblyopia Treatment Market Volume Share (%), by Type 2024 & 2032
- Figure 55: South America Amblyopia Treatment Market Revenue (Million), by Treatment Products 2024 & 2032
- Figure 56: South America Amblyopia Treatment Market Volume (Million), by Treatment Products 2024 & 2032
- Figure 57: South America Amblyopia Treatment Market Revenue Share (%), by Treatment Products 2024 & 2032
- Figure 58: South America Amblyopia Treatment Market Volume Share (%), by Treatment Products 2024 & 2032
- Figure 59: South America Amblyopia Treatment Market Revenue (Million), by Country 2024 & 2032
- Figure 60: South America Amblyopia Treatment Market Volume (Million), by Country 2024 & 2032
- Figure 61: South America Amblyopia Treatment Market Revenue Share (%), by Country 2024 & 2032
- Figure 62: South America Amblyopia Treatment Market Volume Share (%), by Country 2024 & 2032
List of Tables
- Table 1: Global Amblyopia Treatment Market Revenue Million Forecast, by Region 2019 & 2032
- Table 2: Global Amblyopia Treatment Market Volume Million Forecast, by Region 2019 & 2032
- Table 3: Global Amblyopia Treatment Market Revenue Million Forecast, by Type 2019 & 2032
- Table 4: Global Amblyopia Treatment Market Volume Million Forecast, by Type 2019 & 2032
- Table 5: Global Amblyopia Treatment Market Revenue Million Forecast, by Treatment Products 2019 & 2032
- Table 6: Global Amblyopia Treatment Market Volume Million Forecast, by Treatment Products 2019 & 2032
- Table 7: Global Amblyopia Treatment Market Revenue Million Forecast, by Region 2019 & 2032
- Table 8: Global Amblyopia Treatment Market Volume Million Forecast, by Region 2019 & 2032
- Table 9: Global Amblyopia Treatment Market Revenue Million Forecast, by Type 2019 & 2032
- Table 10: Global Amblyopia Treatment Market Volume Million Forecast, by Type 2019 & 2032
- Table 11: Global Amblyopia Treatment Market Revenue Million Forecast, by Treatment Products 2019 & 2032
- Table 12: Global Amblyopia Treatment Market Volume Million Forecast, by Treatment Products 2019 & 2032
- Table 13: Global Amblyopia Treatment Market Revenue Million Forecast, by Country 2019 & 2032
- Table 14: Global Amblyopia Treatment Market Volume Million Forecast, by Country 2019 & 2032
- Table 15: United States Amblyopia Treatment Market Revenue (Million) Forecast, by Application 2019 & 2032
- Table 16: United States Amblyopia Treatment Market Volume (Million) Forecast, by Application 2019 & 2032
- Table 17: Canada Amblyopia Treatment Market Revenue (Million) Forecast, by Application 2019 & 2032
- Table 18: Canada Amblyopia Treatment Market Volume (Million) Forecast, by Application 2019 & 2032
- Table 19: Mexico Amblyopia Treatment Market Revenue (Million) Forecast, by Application 2019 & 2032
- Table 20: Mexico Amblyopia Treatment Market Volume (Million) Forecast, by Application 2019 & 2032
- Table 21: Global Amblyopia Treatment Market Revenue Million Forecast, by Type 2019 & 2032
- Table 22: Global Amblyopia Treatment Market Volume Million Forecast, by Type 2019 & 2032
- Table 23: Global Amblyopia Treatment Market Revenue Million Forecast, by Treatment Products 2019 & 2032
- Table 24: Global Amblyopia Treatment Market Volume Million Forecast, by Treatment Products 2019 & 2032
- Table 25: Global Amblyopia Treatment Market Revenue Million Forecast, by Country 2019 & 2032
- Table 26: Global Amblyopia Treatment Market Volume Million Forecast, by Country 2019 & 2032
- Table 27: Germany Amblyopia Treatment Market Revenue (Million) Forecast, by Application 2019 & 2032
- Table 28: Germany Amblyopia Treatment Market Volume (Million) Forecast, by Application 2019 & 2032
- Table 29: United Kingdom Amblyopia Treatment Market Revenue (Million) Forecast, by Application 2019 & 2032
- Table 30: United Kingdom Amblyopia Treatment Market Volume (Million) Forecast, by Application 2019 & 2032
- Table 31: France Amblyopia Treatment Market Revenue (Million) Forecast, by Application 2019 & 2032
- Table 32: France Amblyopia Treatment Market Volume (Million) Forecast, by Application 2019 & 2032
- Table 33: Italy Amblyopia Treatment Market Revenue (Million) Forecast, by Application 2019 & 2032
- Table 34: Italy Amblyopia Treatment Market Volume (Million) Forecast, by Application 2019 & 2032
- Table 35: Spain Amblyopia Treatment Market Revenue (Million) Forecast, by Application 2019 & 2032
- Table 36: Spain Amblyopia Treatment Market Volume (Million) Forecast, by Application 2019 & 2032
- Table 37: Rest of Europe Amblyopia Treatment Market Revenue (Million) Forecast, by Application 2019 & 2032
- Table 38: Rest of Europe Amblyopia Treatment Market Volume (Million) Forecast, by Application 2019 & 2032
- Table 39: Global Amblyopia Treatment Market Revenue Million Forecast, by Type 2019 & 2032
- Table 40: Global Amblyopia Treatment Market Volume Million Forecast, by Type 2019 & 2032
- Table 41: Global Amblyopia Treatment Market Revenue Million Forecast, by Treatment Products 2019 & 2032
- Table 42: Global Amblyopia Treatment Market Volume Million Forecast, by Treatment Products 2019 & 2032
- Table 43: Global Amblyopia Treatment Market Revenue Million Forecast, by Country 2019 & 2032
- Table 44: Global Amblyopia Treatment Market Volume Million Forecast, by Country 2019 & 2032
- Table 45: China Amblyopia Treatment Market Revenue (Million) Forecast, by Application 2019 & 2032
- Table 46: China Amblyopia Treatment Market Volume (Million) Forecast, by Application 2019 & 2032
- Table 47: Japan Amblyopia Treatment Market Revenue (Million) Forecast, by Application 2019 & 2032
- Table 48: Japan Amblyopia Treatment Market Volume (Million) Forecast, by Application 2019 & 2032
- Table 49: India Amblyopia Treatment Market Revenue (Million) Forecast, by Application 2019 & 2032
- Table 50: India Amblyopia Treatment Market Volume (Million) Forecast, by Application 2019 & 2032
- Table 51: Australia Amblyopia Treatment Market Revenue (Million) Forecast, by Application 2019 & 2032
- Table 52: Australia Amblyopia Treatment Market Volume (Million) Forecast, by Application 2019 & 2032
- Table 53: South Korea Amblyopia Treatment Market Revenue (Million) Forecast, by Application 2019 & 2032
- Table 54: South Korea Amblyopia Treatment Market Volume (Million) Forecast, by Application 2019 & 2032
- Table 55: Rest of Asia Pacific Amblyopia Treatment Market Revenue (Million) Forecast, by Application 2019 & 2032
- Table 56: Rest of Asia Pacific Amblyopia Treatment Market Volume (Million) Forecast, by Application 2019 & 2032
- Table 57: Global Amblyopia Treatment Market Revenue Million Forecast, by Type 2019 & 2032
- Table 58: Global Amblyopia Treatment Market Volume Million Forecast, by Type 2019 & 2032
- Table 59: Global Amblyopia Treatment Market Revenue Million Forecast, by Treatment Products 2019 & 2032
- Table 60: Global Amblyopia Treatment Market Volume Million Forecast, by Treatment Products 2019 & 2032
- Table 61: Global Amblyopia Treatment Market Revenue Million Forecast, by Country 2019 & 2032
- Table 62: Global Amblyopia Treatment Market Volume Million Forecast, by Country 2019 & 2032
- Table 63: GCC Amblyopia Treatment Market Revenue (Million) Forecast, by Application 2019 & 2032
- Table 64: GCC Amblyopia Treatment Market Volume (Million) Forecast, by Application 2019 & 2032
- Table 65: South Africa Amblyopia Treatment Market Revenue (Million) Forecast, by Application 2019 & 2032
- Table 66: South Africa Amblyopia Treatment Market Volume (Million) Forecast, by Application 2019 & 2032
- Table 67: Rest of Middle East and Africa Amblyopia Treatment Market Revenue (Million) Forecast, by Application 2019 & 2032
- Table 68: Rest of Middle East and Africa Amblyopia Treatment Market Volume (Million) Forecast, by Application 2019 & 2032
- Table 69: Global Amblyopia Treatment Market Revenue Million Forecast, by Type 2019 & 2032
- Table 70: Global Amblyopia Treatment Market Volume Million Forecast, by Type 2019 & 2032
- Table 71: Global Amblyopia Treatment Market Revenue Million Forecast, by Treatment Products 2019 & 2032
- Table 72: Global Amblyopia Treatment Market Volume Million Forecast, by Treatment Products 2019 & 2032
- Table 73: Global Amblyopia Treatment Market Revenue Million Forecast, by Country 2019 & 2032
- Table 74: Global Amblyopia Treatment Market Volume Million Forecast, by Country 2019 & 2032
- Table 75: Brazil Amblyopia Treatment Market Revenue (Million) Forecast, by Application 2019 & 2032
- Table 76: Brazil Amblyopia Treatment Market Volume (Million) Forecast, by Application 2019 & 2032
- Table 77: Argentina Amblyopia Treatment Market Revenue (Million) Forecast, by Application 2019 & 2032
- Table 78: Argentina Amblyopia Treatment Market Volume (Million) Forecast, by Application 2019 & 2032
- Table 79: Rest of South America Amblyopia Treatment Market Revenue (Million) Forecast, by Application 2019 & 2032
- Table 80: Rest of South America Amblyopia Treatment Market Volume (Million) Forecast, by Application 2019 & 2032
Frequently Asked Questions
1. What is the projected Compound Annual Growth Rate (CAGR) of the Amblyopia Treatment Market?
The projected CAGR is approximately 3.90%.
2. Which companies are prominent players in the Amblyopia Treatment Market?
Key companies in the market include Bausch and Lomb Incorporated, Acorn operating company LLC, Oculus Pharmaceuticals Ltd, Santen Pharmaceuticals Co Ltd, Coopervision, Frensel prism and lens Co, Hilco Vision, Good-Lite, Vivid Vision Inc, Krafty Eye patches, Hoya Vision Care, Orthopad USA*List Not Exhaustive.
3. What are the main segments of the Amblyopia Treatment Market?
The market segments include Type, Treatment Products.
4. Can you provide details about the market size?
The market size is estimated to be USD 72.5 Million as of 2022.
5. What are some drivers contributing to market growth?
Rising Prevalence of Amblyopia; Increasing Technological Advancements for the Treatment of Amblyopia.
6. What are the notable trends driving market growth?
The Strabismic Amblyopia Segment is Expected to Hold a Significant Market Share in the Amblyopia Treatment Market.
7. Are there any restraints impacting market growth?
Rising Prevalence of Amblyopia; Increasing Technological Advancements for the Treatment of Amblyopia.
8. Can you provide examples of recent developments in the market?
October 2023: Bynocs, a company that offers lazy eye treatment therapies, launched a vision therapy software program (AmblyGo) to treat amblyopia in the form of tailored computer games. The patient plays the games with both eyes open while wearing special 3D anaglyph glasses (with different color lenses) for 30 minutes over 30 sessions.
9. What pricing options are available for accessing the report?
Pricing options include single-user, multi-user, and enterprise licenses priced at USD 4750, USD 5250, and USD 8750 respectively.
10. Is the market size provided in terms of value or volume?
The market size is provided in terms of value, measured in Million and volume, measured in Million.
11. Are there any specific market keywords associated with the report?
Yes, the market keyword associated with the report is "Amblyopia Treatment Market," which aids in identifying and referencing the specific market segment covered.
12. How do I determine which pricing option suits my needs best?
The pricing options vary based on user requirements and access needs. Individual users may opt for single-user licenses, while businesses requiring broader access may choose multi-user or enterprise licenses for cost-effective access to the report.
13. Are there any additional resources or data provided in the Amblyopia Treatment Market report?
While the report offers comprehensive insights, it's advisable to review the specific contents or supplementary materials provided to ascertain if additional resources or data are available.
14. How can I stay updated on further developments or reports in the Amblyopia Treatment Market?
To stay informed about further developments, trends, and reports in the Amblyopia Treatment Market, consider subscribing to industry newsletters, following relevant companies and organizations, or regularly checking reputable industry news sources and publications.
Methodology
Step 1 - Identification of Relevant Samples Size from Population Database


Step 2 - Approaches for Defining Global Market Size (Value, Volume* & Price*)

Note*: In applicable scenarios
Step 3 - Data Sources
Primary Research
- Web Analytics
- Survey Reports
- Research Institute
- Latest Research Reports
- Opinion Leaders
Secondary Research
- Annual Reports
- White Paper
- Latest Press Release
- Industry Association
- Paid Database
- Investor Presentations

Step 4 - Data Triangulation
Involves using different sources of information in order to increase the validity of a study
These sources are likely to be stakeholders in a program - participants, other researchers, program staff, other community members, and so on.
Then we put all data in single framework & apply various statistical tools to find out the dynamic on the market.
During the analysis stage, feedback from the stakeholder groups would be compared to determine areas of agreement as well as areas of divergence
