

Key Insights
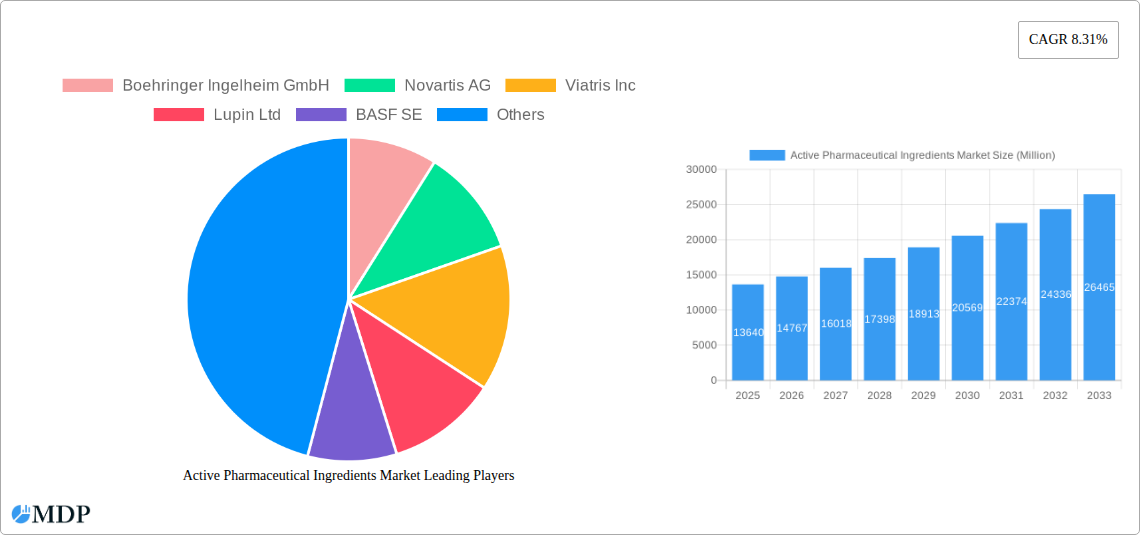
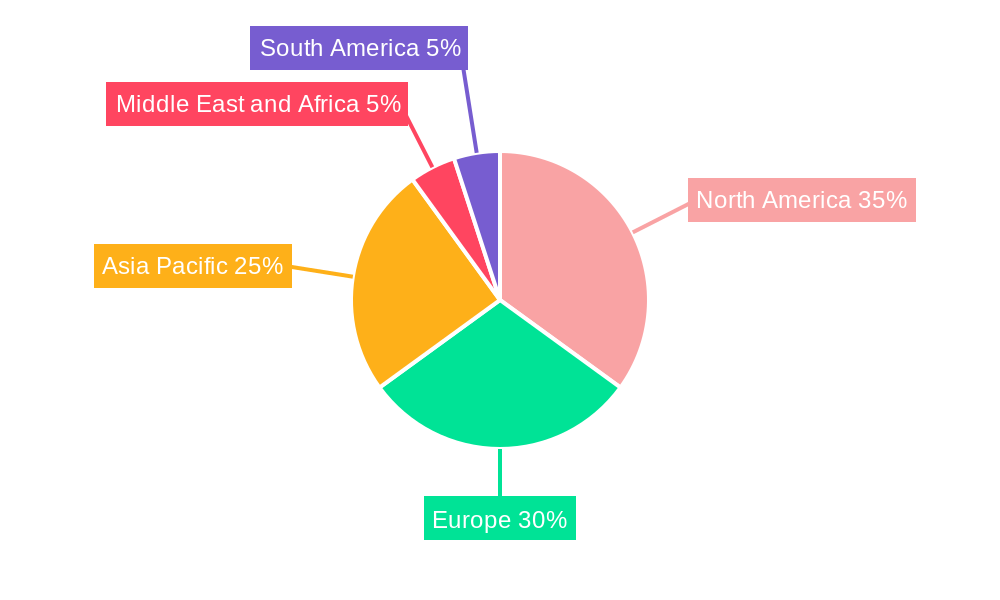
The Active Pharmaceutical Ingredients (API) market, valued at $13.64 billion in 2025, is projected to experience robust growth, driven by several key factors. The increasing prevalence of chronic diseases globally, coupled with a rising geriatric population, fuels demand for pharmaceuticals, consequently boosting the API market. Advancements in drug discovery and development, particularly in areas like oncology and immunology, are leading to the introduction of novel therapies requiring specialized APIs. Furthermore, the growing outsourcing of API manufacturing to contract research organizations (CROs) and contract manufacturing organizations (CMOs) is contributing to market expansion. The market is segmented by synthesis type (synthetic and biotech), drug type (generic and branded), application (cardiology, oncology, pulmonology, neurology, orthopedic, ophthalmology, and other applications), and business mode (captive and merchant API). Leading players such as Boehringer Ingelheim, Novartis, Viatris, Lupin, BASF, Sun Pharmaceutical Industries, Aurobindo Pharma, Sanofi, Dr. Reddy's Laboratories, GlaxoSmithKline, and Pfizer are shaping market competition through strategic partnerships, R&D investments, and capacity expansions. Regional variations exist, with North America and Europe currently holding significant market share, but the Asia-Pacific region is anticipated to witness faster growth due to increasing healthcare expenditure and a burgeoning pharmaceutical industry.
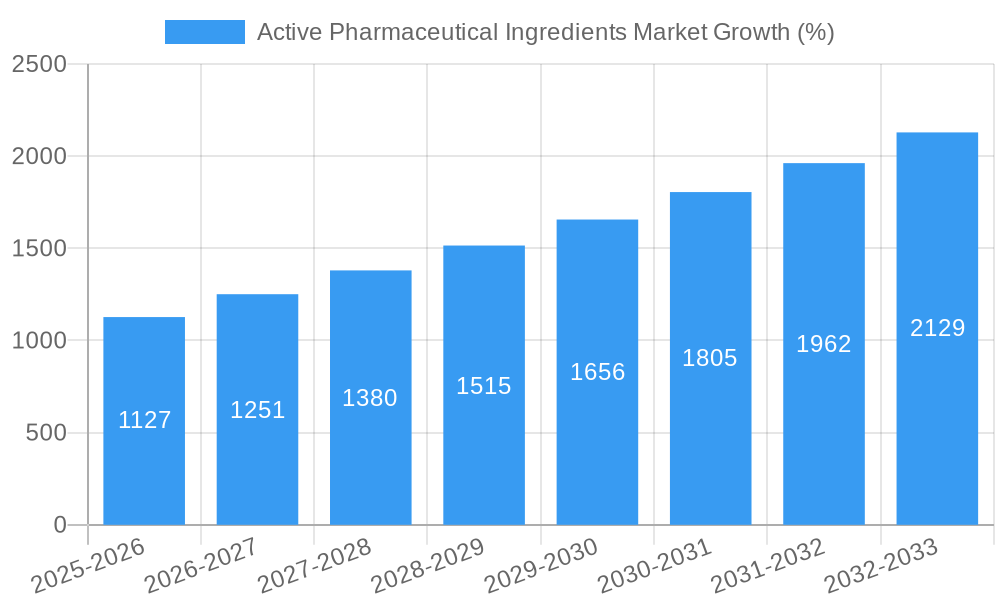
The market's growth is projected to continue at a Compound Annual Growth Rate (CAGR) of 8.31% from 2025 to 2033. This sustained growth reflects the ongoing demand for effective and affordable medicines. However, challenges remain, including stringent regulatory approvals, intellectual property protection concerns, and potential supply chain disruptions. The increasing emphasis on biosimilars and generic drugs, while presenting opportunities for cost-effective therapies, also introduces competitive pressures. Navigating these dynamics will require API manufacturers to prioritize innovation, operational efficiency, and robust regulatory compliance to maintain market share and profitability in this dynamic sector.
Active Pharmaceutical Ingredients (API) Market Report: 2019-2033
This comprehensive report provides an in-depth analysis of the Active Pharmaceutical Ingredients (API) market from 2019 to 2033, offering invaluable insights for industry stakeholders. With a focus on market dynamics, trends, leading players, and future opportunities, this report is essential for strategic decision-making. The market is projected to reach xx Million by 2033, exhibiting a CAGR of xx% during the forecast period (2025-2033). The base year for this analysis is 2025, with historical data covering 2019-2024.
Active Pharmaceutical Ingredients Market Market Dynamics & Concentration
The Active Pharmaceutical Ingredients (API) market is characterized by a moderately concentrated landscape, with a few large players holding significant market share. However, the presence of numerous smaller companies, particularly in emerging economies, adds to the market's complexity. Innovation drives market growth, with continuous advancements in drug discovery and development leading to new API requirements. Stringent regulatory frameworks, including those from the FDA and EMA, significantly impact market dynamics. The market also faces pressures from the emergence of biosimilars and generic drugs, acting as viable substitutes for branded APIs. End-user trends, such as the increasing prevalence of chronic diseases and the rising demand for personalized medicine, significantly impact the API demand. Mergers and acquisitions (M&A) are common, with an average of xx M&A deals per year in the historical period (2019-2024). The market share of the top five players is estimated to be around xx%.
- Market Concentration: Moderately concentrated, with a few major players dominating.
- Innovation Drivers: Advancements in drug discovery and development.
- Regulatory Frameworks: Stringent regulations by FDA, EMA, and other global bodies.
- Product Substitutes: Biosimilars and generic drugs pose competition.
- End-User Trends: Growing prevalence of chronic diseases and increasing demand for personalized medicine.
- M&A Activities: Average of xx M&A deals annually during 2019-2024.
Active Pharmaceutical Ingredients Market Industry Trends & Analysis
The API market exhibits robust growth, driven by factors such as the increasing global geriatric population, rising healthcare expenditure, and technological advancements in drug delivery systems. Technological disruptions, such as the development of advanced manufacturing techniques like continuous manufacturing and process analytical technology (PAT), are reshaping the API production landscape, enhancing efficiency and reducing costs. Consumer preferences are shifting towards more targeted and personalized therapies, creating demand for specialized APIs. Competitive dynamics are intense, with companies focusing on innovation, cost optimization, and strategic partnerships to maintain a competitive edge. Market penetration of novel APIs in emerging markets shows significant potential for future growth. The market is expected to grow at a CAGR of xx% from 2025 to 2033.
Leading Markets & Segments in Active Pharmaceutical Ingredients Market
The dominant regions in the API market include North America and Europe, driven by strong pharmaceutical industries and high healthcare expenditure. Within these regions, the United States and Germany are leading countries. In terms of segments, the Synthetic Synthesis Type holds the largest market share, owing to its established infrastructure and cost-effectiveness. Generic drugs dominate the Drug Type segment due to their affordability and availability. The Oncology application segment exhibits the highest growth rate due to the rising incidence of cancer globally. The Merchant API business mode currently holds a larger share, but Captive API is expected to grow faster due to an increase in vertical integration within pharmaceutical companies.
- Key Drivers for Dominant Regions/Segments:
- North America & Europe: Strong pharmaceutical industry, high healthcare expenditure.
- Synthetic Synthesis Type: Cost-effectiveness, established infrastructure.
- Generic Drug Type: Affordability, increased availability.
- Oncology Application: High incidence of cancer, continuous development of new therapies.
- Merchant API: Established market presence and flexibility.
Active Pharmaceutical Ingredients Market Product Developments
Recent product innovations focus on improving API quality, enhancing manufacturing efficiency, and developing novel drug delivery systems. Advancements in continuous manufacturing, process analytical technology, and green chemistry are improving the sustainability and efficiency of API production. New APIs are being developed to target unmet medical needs, particularly in areas such as oncology and immunology. These innovations are enabling improved patient outcomes and enhancing the competitive landscape.
Key Drivers of Active Pharmaceutical Ingredients Market Growth
Several key factors are driving the growth of the API market. Technological advancements in drug discovery and manufacturing are leading to the development of novel APIs. Economic factors, such as increasing healthcare expenditure and rising disposable incomes, fuel market growth. Furthermore, supportive government regulations, including incentives for API production in certain regions, encourage market expansion. The development of new drug therapies for emerging diseases is a significant growth driver.
Challenges in the Active Pharmaceutical Ingredients Market Market
The API market faces several challenges, including stringent regulatory requirements that increase the time and cost associated with drug approvals. Supply chain disruptions and price fluctuations of raw materials pose significant risks. Intense competition among manufacturers can also impact pricing and profitability. The complexities of intellectual property protection further complicate the market dynamics. These issues collectively represent a significant challenge for market stability and growth.
Emerging Opportunities in Active Pharmaceutical Ingredients Market
Significant long-term growth opportunities exist in the API market. Advancements in biotechnology and nanotechnology are paving the way for next-generation APIs. Strategic partnerships and collaborations between API manufacturers and pharmaceutical companies are opening up new avenues for innovation and market expansion. Focus on sustainable and environmentally friendly API manufacturing processes offers substantial opportunities for growth in an increasingly conscious market. The expansion into emerging markets with high unmet medical needs presents a significant growth potential.
Leading Players in the Active Pharmaceutical Ingredients Market Sector
- Boehringer Ingelheim GmbH
- Novartis AG
- Viatris Inc
- Lupin Ltd
- BASF SE
- Sun Pharmaceutical Industries Ltd
- Aurobindo Pharma
- Sanofi Inc
- Dr Reddy's Laboratories Ltd
- GlaxoSmithKline PLC
- Pfizer Inc
Key Milestones in Active Pharmaceutical Ingredients Market Industry
- July 2022: Piramal Pharma Limited launched a new API plant in Aurora, Ontario, expanding its CDMO capabilities and increasing API production capacity.
- March 2022: India launched a production-linked incentive (PLI) scheme to boost domestic API manufacturing, reducing reliance on imports from China. This impacted the market by increasing domestic API supply and potentially reducing prices.
Strategic Outlook for Active Pharmaceutical Ingredients Market Market
The API market is poised for sustained growth driven by technological advancements, increasing healthcare spending, and favorable regulatory environments. Strategic opportunities for market players include investing in R&D to develop novel APIs, expanding into emerging markets, and adopting sustainable manufacturing practices. Companies focusing on innovation, partnerships, and operational efficiency are best positioned for long-term success. The market's future potential is strong, particularly in specialized APIs targeting unmet medical needs.
Active Pharmaceutical Ingredients Market Segmentation
-
1. Business Mode
- 1.1. Captive API
- 1.2. Merchant API
-
2. Synthesis Type
- 2.1. Synthetic
- 2.2. Biotech
-
3. Drug Type
- 3.1. Generic
- 3.2. Branded
-
4. Application
- 4.1. Cardiology
- 4.2. Oncology
- 4.3. Pulmonology
- 4.4. Neurology
- 4.5. Orthopedic
- 4.6. Ophthalmology
- 4.7. Other Applications
Active Pharmaceutical Ingredients Market Segmentation By Geography
-
1. North America
- 1.1. United States
- 1.2. Canada
- 1.3. Mexico
-
2. South America
- 2.1. Brazil
- 2.2. Argentina
- 2.3. Rest of South America
-
3. Europe
- 3.1. United Kingdom
- 3.2. Germany
- 3.3. France
- 3.4. Italy
- 3.5. Spain
- 3.6. Russia
- 3.7. Benelux
- 3.8. Nordics
- 3.9. Rest of Europe
-
4. Middle East & Africa
- 4.1. Turkey
- 4.2. Israel
- 4.3. GCC
- 4.4. North Africa
- 4.5. South Africa
- 4.6. Rest of Middle East & Africa
-
5. Asia Pacific
- 5.1. China
- 5.2. India
- 5.3. Japan
- 5.4. South Korea
- 5.5. ASEAN
- 5.6. Oceania
- 5.7. Rest of Asia Pacific
Active Pharmaceutical Ingredients Market REPORT HIGHLIGHTS
| Aspects | Details |
|---|---|
| Study Period | 2019-2033 |
| Base Year | 2024 |
| Estimated Year | 2025 |
| Forecast Period | 2025-2033 |
| Historical Period | 2019-2024 |
| Growth Rate | CAGR of 8.31% from 2019-2033 |
| Segmentation |
|
Table of Contents
- 1. Introduction
- 1.1. Research Scope
- 1.2. Market Segmentation
- 1.3. Research Methodology
- 1.4. Definitions and Assumptions
- 2. Executive Summary
- 2.1. Introduction
- 3. Market Dynamics
- 3.1. Introduction
- 3.2. Market Drivers
- 3.2.1 Increasing Prevalence of Infectious
- 3.2.2 Genetic
- 3.2.3 Cardiovascular
- 3.2.4 and Other Chronic Disorders; Rising Research & Development Activities of Generic Drugs; Increasing Adoption of Biologicals and Biosimilars
- 3.3. Market Restrains
- 3.3.1. Drug Price Control Policies; Stringent Regulations and Drug Price Policies in the Country
- 3.4. Market Trends
- 3.4.1. Oncology Segment Expects to Register a High CAGR
- 4. Market Factor Analysis
- 4.1. Porters Five Forces
- 4.2. Supply/Value Chain
- 4.3. PESTEL analysis
- 4.4. Market Entropy
- 4.5. Patent/Trademark Analysis
- 5. Global Active Pharmaceutical Ingredients Market Analysis, Insights and Forecast, 2019-2031
- 5.1. Market Analysis, Insights and Forecast - by Business Mode
- 5.1.1. Captive API
- 5.1.2. Merchant API
- 5.2. Market Analysis, Insights and Forecast - by Synthesis Type
- 5.2.1. Synthetic
- 5.2.2. Biotech
- 5.3. Market Analysis, Insights and Forecast - by Drug Type
- 5.3.1. Generic
- 5.3.2. Branded
- 5.4. Market Analysis, Insights and Forecast - by Application
- 5.4.1. Cardiology
- 5.4.2. Oncology
- 5.4.3. Pulmonology
- 5.4.4. Neurology
- 5.4.5. Orthopedic
- 5.4.6. Ophthalmology
- 5.4.7. Other Applications
- 5.5. Market Analysis, Insights and Forecast - by Region
- 5.5.1. North America
- 5.5.2. South America
- 5.5.3. Europe
- 5.5.4. Middle East & Africa
- 5.5.5. Asia Pacific
- 5.1. Market Analysis, Insights and Forecast - by Business Mode
- 6. North America Active Pharmaceutical Ingredients Market Analysis, Insights and Forecast, 2019-2031
- 6.1. Market Analysis, Insights and Forecast - by Business Mode
- 6.1.1. Captive API
- 6.1.2. Merchant API
- 6.2. Market Analysis, Insights and Forecast - by Synthesis Type
- 6.2.1. Synthetic
- 6.2.2. Biotech
- 6.3. Market Analysis, Insights and Forecast - by Drug Type
- 6.3.1. Generic
- 6.3.2. Branded
- 6.4. Market Analysis, Insights and Forecast - by Application
- 6.4.1. Cardiology
- 6.4.2. Oncology
- 6.4.3. Pulmonology
- 6.4.4. Neurology
- 6.4.5. Orthopedic
- 6.4.6. Ophthalmology
- 6.4.7. Other Applications
- 6.1. Market Analysis, Insights and Forecast - by Business Mode
- 7. South America Active Pharmaceutical Ingredients Market Analysis, Insights and Forecast, 2019-2031
- 7.1. Market Analysis, Insights and Forecast - by Business Mode
- 7.1.1. Captive API
- 7.1.2. Merchant API
- 7.2. Market Analysis, Insights and Forecast - by Synthesis Type
- 7.2.1. Synthetic
- 7.2.2. Biotech
- 7.3. Market Analysis, Insights and Forecast - by Drug Type
- 7.3.1. Generic
- 7.3.2. Branded
- 7.4. Market Analysis, Insights and Forecast - by Application
- 7.4.1. Cardiology
- 7.4.2. Oncology
- 7.4.3. Pulmonology
- 7.4.4. Neurology
- 7.4.5. Orthopedic
- 7.4.6. Ophthalmology
- 7.4.7. Other Applications
- 7.1. Market Analysis, Insights and Forecast - by Business Mode
- 8. Europe Active Pharmaceutical Ingredients Market Analysis, Insights and Forecast, 2019-2031
- 8.1. Market Analysis, Insights and Forecast - by Business Mode
- 8.1.1. Captive API
- 8.1.2. Merchant API
- 8.2. Market Analysis, Insights and Forecast - by Synthesis Type
- 8.2.1. Synthetic
- 8.2.2. Biotech
- 8.3. Market Analysis, Insights and Forecast - by Drug Type
- 8.3.1. Generic
- 8.3.2. Branded
- 8.4. Market Analysis, Insights and Forecast - by Application
- 8.4.1. Cardiology
- 8.4.2. Oncology
- 8.4.3. Pulmonology
- 8.4.4. Neurology
- 8.4.5. Orthopedic
- 8.4.6. Ophthalmology
- 8.4.7. Other Applications
- 8.1. Market Analysis, Insights and Forecast - by Business Mode
- 9. Middle East & Africa Active Pharmaceutical Ingredients Market Analysis, Insights and Forecast, 2019-2031
- 9.1. Market Analysis, Insights and Forecast - by Business Mode
- 9.1.1. Captive API
- 9.1.2. Merchant API
- 9.2. Market Analysis, Insights and Forecast - by Synthesis Type
- 9.2.1. Synthetic
- 9.2.2. Biotech
- 9.3. Market Analysis, Insights and Forecast - by Drug Type
- 9.3.1. Generic
- 9.3.2. Branded
- 9.4. Market Analysis, Insights and Forecast - by Application
- 9.4.1. Cardiology
- 9.4.2. Oncology
- 9.4.3. Pulmonology
- 9.4.4. Neurology
- 9.4.5. Orthopedic
- 9.4.6. Ophthalmology
- 9.4.7. Other Applications
- 9.1. Market Analysis, Insights and Forecast - by Business Mode
- 10. Asia Pacific Active Pharmaceutical Ingredients Market Analysis, Insights and Forecast, 2019-2031
- 10.1. Market Analysis, Insights and Forecast - by Business Mode
- 10.1.1. Captive API
- 10.1.2. Merchant API
- 10.2. Market Analysis, Insights and Forecast - by Synthesis Type
- 10.2.1. Synthetic
- 10.2.2. Biotech
- 10.3. Market Analysis, Insights and Forecast - by Drug Type
- 10.3.1. Generic
- 10.3.2. Branded
- 10.4. Market Analysis, Insights and Forecast - by Application
- 10.4.1. Cardiology
- 10.4.2. Oncology
- 10.4.3. Pulmonology
- 10.4.4. Neurology
- 10.4.5. Orthopedic
- 10.4.6. Ophthalmology
- 10.4.7. Other Applications
- 10.1. Market Analysis, Insights and Forecast - by Business Mode
- 11. North America Active Pharmaceutical Ingredients Market Analysis, Insights and Forecast, 2019-2031
- 11.1. Market Analysis, Insights and Forecast - By Country/Sub-region
- 11.1.1. undefined
- 12. Europe Active Pharmaceutical Ingredients Market Analysis, Insights and Forecast, 2019-2031
- 12.1. Market Analysis, Insights and Forecast - By Country/Sub-region
- 12.1.1. undefined
- 13. Asia Pacific Active Pharmaceutical Ingredients Market Analysis, Insights and Forecast, 2019-2031
- 13.1. Market Analysis, Insights and Forecast - By Country/Sub-region
- 13.1.1. undefined
- 14. Middle East and Africa Active Pharmaceutical Ingredients Market Analysis, Insights and Forecast, 2019-2031
- 14.1. Market Analysis, Insights and Forecast - By Country/Sub-region
- 14.1.1. undefined
- 15. South America Active Pharmaceutical Ingredients Market Analysis, Insights and Forecast, 2019-2031
- 15.1. Market Analysis, Insights and Forecast - By Country/Sub-region
- 15.1.1. undefined
- 16. Competitive Analysis
- 16.1. Global Market Share Analysis 2024
- 16.2. Company Profiles
- 16.2.1 Boehringer Ingelheim GmbH
- 16.2.1.1. Overview
- 16.2.1.2. Products
- 16.2.1.3. SWOT Analysis
- 16.2.1.4. Recent Developments
- 16.2.1.5. Financials (Based on Availability)
- 16.2.2 Novartis AG
- 16.2.2.1. Overview
- 16.2.2.2. Products
- 16.2.2.3. SWOT Analysis
- 16.2.2.4. Recent Developments
- 16.2.2.5. Financials (Based on Availability)
- 16.2.3 Viatris Inc
- 16.2.3.1. Overview
- 16.2.3.2. Products
- 16.2.3.3. SWOT Analysis
- 16.2.3.4. Recent Developments
- 16.2.3.5. Financials (Based on Availability)
- 16.2.4 Lupin Ltd
- 16.2.4.1. Overview
- 16.2.4.2. Products
- 16.2.4.3. SWOT Analysis
- 16.2.4.4. Recent Developments
- 16.2.4.5. Financials (Based on Availability)
- 16.2.5 BASF SE
- 16.2.5.1. Overview
- 16.2.5.2. Products
- 16.2.5.3. SWOT Analysis
- 16.2.5.4. Recent Developments
- 16.2.5.5. Financials (Based on Availability)
- 16.2.6 Sun Pharmaceutical Industries Ltd
- 16.2.6.1. Overview
- 16.2.6.2. Products
- 16.2.6.3. SWOT Analysis
- 16.2.6.4. Recent Developments
- 16.2.6.5. Financials (Based on Availability)
- 16.2.7 Aurobindo Pharma
- 16.2.7.1. Overview
- 16.2.7.2. Products
- 16.2.7.3. SWOT Analysis
- 16.2.7.4. Recent Developments
- 16.2.7.5. Financials (Based on Availability)
- 16.2.8 Sanofi Inc
- 16.2.8.1. Overview
- 16.2.8.2. Products
- 16.2.8.3. SWOT Analysis
- 16.2.8.4. Recent Developments
- 16.2.8.5. Financials (Based on Availability)
- 16.2.9 Dr Reddy's Laboratories Ltd
- 16.2.9.1. Overview
- 16.2.9.2. Products
- 16.2.9.3. SWOT Analysis
- 16.2.9.4. Recent Developments
- 16.2.9.5. Financials (Based on Availability)
- 16.2.10 GlaxoSmithKline PLC
- 16.2.10.1. Overview
- 16.2.10.2. Products
- 16.2.10.3. SWOT Analysis
- 16.2.10.4. Recent Developments
- 16.2.10.5. Financials (Based on Availability)
- 16.2.11 Pfizer Inc
- 16.2.11.1. Overview
- 16.2.11.2. Products
- 16.2.11.3. SWOT Analysis
- 16.2.11.4. Recent Developments
- 16.2.11.5. Financials (Based on Availability)
- 16.2.1 Boehringer Ingelheim GmbH
List of Figures
- Figure 1: Global Active Pharmaceutical Ingredients Market Revenue Breakdown (Million, %) by Region 2024 & 2032
- Figure 2: Global Active Pharmaceutical Ingredients Market Volume Breakdown (k unit , %) by Region 2024 & 2032
- Figure 3: North America Active Pharmaceutical Ingredients Market Revenue (Million), by Country 2024 & 2032
- Figure 4: North America Active Pharmaceutical Ingredients Market Volume (k unit ), by Country 2024 & 2032
- Figure 5: North America Active Pharmaceutical Ingredients Market Revenue Share (%), by Country 2024 & 2032
- Figure 6: North America Active Pharmaceutical Ingredients Market Volume Share (%), by Country 2024 & 2032
- Figure 7: Europe Active Pharmaceutical Ingredients Market Revenue (Million), by Country 2024 & 2032
- Figure 8: Europe Active Pharmaceutical Ingredients Market Volume (k unit ), by Country 2024 & 2032
- Figure 9: Europe Active Pharmaceutical Ingredients Market Revenue Share (%), by Country 2024 & 2032
- Figure 10: Europe Active Pharmaceutical Ingredients Market Volume Share (%), by Country 2024 & 2032
- Figure 11: Asia Pacific Active Pharmaceutical Ingredients Market Revenue (Million), by Country 2024 & 2032
- Figure 12: Asia Pacific Active Pharmaceutical Ingredients Market Volume (k unit ), by Country 2024 & 2032
- Figure 13: Asia Pacific Active Pharmaceutical Ingredients Market Revenue Share (%), by Country 2024 & 2032
- Figure 14: Asia Pacific Active Pharmaceutical Ingredients Market Volume Share (%), by Country 2024 & 2032
- Figure 15: Middle East and Africa Active Pharmaceutical Ingredients Market Revenue (Million), by Country 2024 & 2032
- Figure 16: Middle East and Africa Active Pharmaceutical Ingredients Market Volume (k unit ), by Country 2024 & 2032
- Figure 17: Middle East and Africa Active Pharmaceutical Ingredients Market Revenue Share (%), by Country 2024 & 2032
- Figure 18: Middle East and Africa Active Pharmaceutical Ingredients Market Volume Share (%), by Country 2024 & 2032
- Figure 19: South America Active Pharmaceutical Ingredients Market Revenue (Million), by Country 2024 & 2032
- Figure 20: South America Active Pharmaceutical Ingredients Market Volume (k unit ), by Country 2024 & 2032
- Figure 21: South America Active Pharmaceutical Ingredients Market Revenue Share (%), by Country 2024 & 2032
- Figure 22: South America Active Pharmaceutical Ingredients Market Volume Share (%), by Country 2024 & 2032
- Figure 23: North America Active Pharmaceutical Ingredients Market Revenue (Million), by Business Mode 2024 & 2032
- Figure 24: North America Active Pharmaceutical Ingredients Market Volume (k unit ), by Business Mode 2024 & 2032
- Figure 25: North America Active Pharmaceutical Ingredients Market Revenue Share (%), by Business Mode 2024 & 2032
- Figure 26: North America Active Pharmaceutical Ingredients Market Volume Share (%), by Business Mode 2024 & 2032
- Figure 27: North America Active Pharmaceutical Ingredients Market Revenue (Million), by Synthesis Type 2024 & 2032
- Figure 28: North America Active Pharmaceutical Ingredients Market Volume (k unit ), by Synthesis Type 2024 & 2032
- Figure 29: North America Active Pharmaceutical Ingredients Market Revenue Share (%), by Synthesis Type 2024 & 2032
- Figure 30: North America Active Pharmaceutical Ingredients Market Volume Share (%), by Synthesis Type 2024 & 2032
- Figure 31: North America Active Pharmaceutical Ingredients Market Revenue (Million), by Drug Type 2024 & 2032
- Figure 32: North America Active Pharmaceutical Ingredients Market Volume (k unit ), by Drug Type 2024 & 2032
- Figure 33: North America Active Pharmaceutical Ingredients Market Revenue Share (%), by Drug Type 2024 & 2032
- Figure 34: North America Active Pharmaceutical Ingredients Market Volume Share (%), by Drug Type 2024 & 2032
- Figure 35: North America Active Pharmaceutical Ingredients Market Revenue (Million), by Application 2024 & 2032
- Figure 36: North America Active Pharmaceutical Ingredients Market Volume (k unit ), by Application 2024 & 2032
- Figure 37: North America Active Pharmaceutical Ingredients Market Revenue Share (%), by Application 2024 & 2032
- Figure 38: North America Active Pharmaceutical Ingredients Market Volume Share (%), by Application 2024 & 2032
- Figure 39: North America Active Pharmaceutical Ingredients Market Revenue (Million), by Country 2024 & 2032
- Figure 40: North America Active Pharmaceutical Ingredients Market Volume (k unit ), by Country 2024 & 2032
- Figure 41: North America Active Pharmaceutical Ingredients Market Revenue Share (%), by Country 2024 & 2032
- Figure 42: North America Active Pharmaceutical Ingredients Market Volume Share (%), by Country 2024 & 2032
- Figure 43: South America Active Pharmaceutical Ingredients Market Revenue (Million), by Business Mode 2024 & 2032
- Figure 44: South America Active Pharmaceutical Ingredients Market Volume (k unit ), by Business Mode 2024 & 2032
- Figure 45: South America Active Pharmaceutical Ingredients Market Revenue Share (%), by Business Mode 2024 & 2032
- Figure 46: South America Active Pharmaceutical Ingredients Market Volume Share (%), by Business Mode 2024 & 2032
- Figure 47: South America Active Pharmaceutical Ingredients Market Revenue (Million), by Synthesis Type 2024 & 2032
- Figure 48: South America Active Pharmaceutical Ingredients Market Volume (k unit ), by Synthesis Type 2024 & 2032
- Figure 49: South America Active Pharmaceutical Ingredients Market Revenue Share (%), by Synthesis Type 2024 & 2032
- Figure 50: South America Active Pharmaceutical Ingredients Market Volume Share (%), by Synthesis Type 2024 & 2032
- Figure 51: South America Active Pharmaceutical Ingredients Market Revenue (Million), by Drug Type 2024 & 2032
- Figure 52: South America Active Pharmaceutical Ingredients Market Volume (k unit ), by Drug Type 2024 & 2032
- Figure 53: South America Active Pharmaceutical Ingredients Market Revenue Share (%), by Drug Type 2024 & 2032
- Figure 54: South America Active Pharmaceutical Ingredients Market Volume Share (%), by Drug Type 2024 & 2032
- Figure 55: South America Active Pharmaceutical Ingredients Market Revenue (Million), by Application 2024 & 2032
- Figure 56: South America Active Pharmaceutical Ingredients Market Volume (k unit ), by Application 2024 & 2032
- Figure 57: South America Active Pharmaceutical Ingredients Market Revenue Share (%), by Application 2024 & 2032
- Figure 58: South America Active Pharmaceutical Ingredients Market Volume Share (%), by Application 2024 & 2032
- Figure 59: South America Active Pharmaceutical Ingredients Market Revenue (Million), by Country 2024 & 2032
- Figure 60: South America Active Pharmaceutical Ingredients Market Volume (k unit ), by Country 2024 & 2032
- Figure 61: South America Active Pharmaceutical Ingredients Market Revenue Share (%), by Country 2024 & 2032
- Figure 62: South America Active Pharmaceutical Ingredients Market Volume Share (%), by Country 2024 & 2032
- Figure 63: Europe Active Pharmaceutical Ingredients Market Revenue (Million), by Business Mode 2024 & 2032
- Figure 64: Europe Active Pharmaceutical Ingredients Market Volume (k unit ), by Business Mode 2024 & 2032
- Figure 65: Europe Active Pharmaceutical Ingredients Market Revenue Share (%), by Business Mode 2024 & 2032
- Figure 66: Europe Active Pharmaceutical Ingredients Market Volume Share (%), by Business Mode 2024 & 2032
- Figure 67: Europe Active Pharmaceutical Ingredients Market Revenue (Million), by Synthesis Type 2024 & 2032
- Figure 68: Europe Active Pharmaceutical Ingredients Market Volume (k unit ), by Synthesis Type 2024 & 2032
- Figure 69: Europe Active Pharmaceutical Ingredients Market Revenue Share (%), by Synthesis Type 2024 & 2032
- Figure 70: Europe Active Pharmaceutical Ingredients Market Volume Share (%), by Synthesis Type 2024 & 2032
- Figure 71: Europe Active Pharmaceutical Ingredients Market Revenue (Million), by Drug Type 2024 & 2032
- Figure 72: Europe Active Pharmaceutical Ingredients Market Volume (k unit ), by Drug Type 2024 & 2032
- Figure 73: Europe Active Pharmaceutical Ingredients Market Revenue Share (%), by Drug Type 2024 & 2032
- Figure 74: Europe Active Pharmaceutical Ingredients Market Volume Share (%), by Drug Type 2024 & 2032
- Figure 75: Europe Active Pharmaceutical Ingredients Market Revenue (Million), by Application 2024 & 2032
- Figure 76: Europe Active Pharmaceutical Ingredients Market Volume (k unit ), by Application 2024 & 2032
- Figure 77: Europe Active Pharmaceutical Ingredients Market Revenue Share (%), by Application 2024 & 2032
- Figure 78: Europe Active Pharmaceutical Ingredients Market Volume Share (%), by Application 2024 & 2032
- Figure 79: Europe Active Pharmaceutical Ingredients Market Revenue (Million), by Country 2024 & 2032
- Figure 80: Europe Active Pharmaceutical Ingredients Market Volume (k unit ), by Country 2024 & 2032
- Figure 81: Europe Active Pharmaceutical Ingredients Market Revenue Share (%), by Country 2024 & 2032
- Figure 82: Europe Active Pharmaceutical Ingredients Market Volume Share (%), by Country 2024 & 2032
- Figure 83: Middle East & Africa Active Pharmaceutical Ingredients Market Revenue (Million), by Business Mode 2024 & 2032
- Figure 84: Middle East & Africa Active Pharmaceutical Ingredients Market Volume (k unit ), by Business Mode 2024 & 2032
- Figure 85: Middle East & Africa Active Pharmaceutical Ingredients Market Revenue Share (%), by Business Mode 2024 & 2032
- Figure 86: Middle East & Africa Active Pharmaceutical Ingredients Market Volume Share (%), by Business Mode 2024 & 2032
- Figure 87: Middle East & Africa Active Pharmaceutical Ingredients Market Revenue (Million), by Synthesis Type 2024 & 2032
- Figure 88: Middle East & Africa Active Pharmaceutical Ingredients Market Volume (k unit ), by Synthesis Type 2024 & 2032
- Figure 89: Middle East & Africa Active Pharmaceutical Ingredients Market Revenue Share (%), by Synthesis Type 2024 & 2032
- Figure 90: Middle East & Africa Active Pharmaceutical Ingredients Market Volume Share (%), by Synthesis Type 2024 & 2032
- Figure 91: Middle East & Africa Active Pharmaceutical Ingredients Market Revenue (Million), by Drug Type 2024 & 2032
- Figure 92: Middle East & Africa Active Pharmaceutical Ingredients Market Volume (k unit ), by Drug Type 2024 & 2032
- Figure 93: Middle East & Africa Active Pharmaceutical Ingredients Market Revenue Share (%), by Drug Type 2024 & 2032
- Figure 94: Middle East & Africa Active Pharmaceutical Ingredients Market Volume Share (%), by Drug Type 2024 & 2032
- Figure 95: Middle East & Africa Active Pharmaceutical Ingredients Market Revenue (Million), by Application 2024 & 2032
- Figure 96: Middle East & Africa Active Pharmaceutical Ingredients Market Volume (k unit ), by Application 2024 & 2032
- Figure 97: Middle East & Africa Active Pharmaceutical Ingredients Market Revenue Share (%), by Application 2024 & 2032
- Figure 98: Middle East & Africa Active Pharmaceutical Ingredients Market Volume Share (%), by Application 2024 & 2032
- Figure 99: Middle East & Africa Active Pharmaceutical Ingredients Market Revenue (Million), by Country 2024 & 2032
- Figure 100: Middle East & Africa Active Pharmaceutical Ingredients Market Volume (k unit ), by Country 2024 & 2032
- Figure 101: Middle East & Africa Active Pharmaceutical Ingredients Market Revenue Share (%), by Country 2024 & 2032
- Figure 102: Middle East & Africa Active Pharmaceutical Ingredients Market Volume Share (%), by Country 2024 & 2032
- Figure 103: Asia Pacific Active Pharmaceutical Ingredients Market Revenue (Million), by Business Mode 2024 & 2032
- Figure 104: Asia Pacific Active Pharmaceutical Ingredients Market Volume (k unit ), by Business Mode 2024 & 2032
- Figure 105: Asia Pacific Active Pharmaceutical Ingredients Market Revenue Share (%), by Business Mode 2024 & 2032
- Figure 106: Asia Pacific Active Pharmaceutical Ingredients Market Volume Share (%), by Business Mode 2024 & 2032
- Figure 107: Asia Pacific Active Pharmaceutical Ingredients Market Revenue (Million), by Synthesis Type 2024 & 2032
- Figure 108: Asia Pacific Active Pharmaceutical Ingredients Market Volume (k unit ), by Synthesis Type 2024 & 2032
- Figure 109: Asia Pacific Active Pharmaceutical Ingredients Market Revenue Share (%), by Synthesis Type 2024 & 2032
- Figure 110: Asia Pacific Active Pharmaceutical Ingredients Market Volume Share (%), by Synthesis Type 2024 & 2032
- Figure 111: Asia Pacific Active Pharmaceutical Ingredients Market Revenue (Million), by Drug Type 2024 & 2032
- Figure 112: Asia Pacific Active Pharmaceutical Ingredients Market Volume (k unit ), by Drug Type 2024 & 2032
- Figure 113: Asia Pacific Active Pharmaceutical Ingredients Market Revenue Share (%), by Drug Type 2024 & 2032
- Figure 114: Asia Pacific Active Pharmaceutical Ingredients Market Volume Share (%), by Drug Type 2024 & 2032
- Figure 115: Asia Pacific Active Pharmaceutical Ingredients Market Revenue (Million), by Application 2024 & 2032
- Figure 116: Asia Pacific Active Pharmaceutical Ingredients Market Volume (k unit ), by Application 2024 & 2032
- Figure 117: Asia Pacific Active Pharmaceutical Ingredients Market Revenue Share (%), by Application 2024 & 2032
- Figure 118: Asia Pacific Active Pharmaceutical Ingredients Market Volume Share (%), by Application 2024 & 2032
- Figure 119: Asia Pacific Active Pharmaceutical Ingredients Market Revenue (Million), by Country 2024 & 2032
- Figure 120: Asia Pacific Active Pharmaceutical Ingredients Market Volume (k unit ), by Country 2024 & 2032
- Figure 121: Asia Pacific Active Pharmaceutical Ingredients Market Revenue Share (%), by Country 2024 & 2032
- Figure 122: Asia Pacific Active Pharmaceutical Ingredients Market Volume Share (%), by Country 2024 & 2032
List of Tables
- Table 1: Global Active Pharmaceutical Ingredients Market Revenue Million Forecast, by Region 2019 & 2032
- Table 2: Global Active Pharmaceutical Ingredients Market Volume k unit Forecast, by Region 2019 & 2032
- Table 3: Global Active Pharmaceutical Ingredients Market Revenue Million Forecast, by Business Mode 2019 & 2032
- Table 4: Global Active Pharmaceutical Ingredients Market Volume k unit Forecast, by Business Mode 2019 & 2032
- Table 5: Global Active Pharmaceutical Ingredients Market Revenue Million Forecast, by Synthesis Type 2019 & 2032
- Table 6: Global Active Pharmaceutical Ingredients Market Volume k unit Forecast, by Synthesis Type 2019 & 2032
- Table 7: Global Active Pharmaceutical Ingredients Market Revenue Million Forecast, by Drug Type 2019 & 2032
- Table 8: Global Active Pharmaceutical Ingredients Market Volume k unit Forecast, by Drug Type 2019 & 2032
- Table 9: Global Active Pharmaceutical Ingredients Market Revenue Million Forecast, by Application 2019 & 2032
- Table 10: Global Active Pharmaceutical Ingredients Market Volume k unit Forecast, by Application 2019 & 2032
- Table 11: Global Active Pharmaceutical Ingredients Market Revenue Million Forecast, by Region 2019 & 2032
- Table 12: Global Active Pharmaceutical Ingredients Market Volume k unit Forecast, by Region 2019 & 2032
- Table 13: Global Active Pharmaceutical Ingredients Market Revenue Million Forecast, by Country 2019 & 2032
- Table 14: Global Active Pharmaceutical Ingredients Market Volume k unit Forecast, by Country 2019 & 2032
- Table 15: Global Active Pharmaceutical Ingredients Market Revenue Million Forecast, by Country 2019 & 2032
- Table 16: Global Active Pharmaceutical Ingredients Market Volume k unit Forecast, by Country 2019 & 2032
- Table 17: Global Active Pharmaceutical Ingredients Market Revenue Million Forecast, by Country 2019 & 2032
- Table 18: Global Active Pharmaceutical Ingredients Market Volume k unit Forecast, by Country 2019 & 2032
- Table 19: Global Active Pharmaceutical Ingredients Market Revenue Million Forecast, by Country 2019 & 2032
- Table 20: Global Active Pharmaceutical Ingredients Market Volume k unit Forecast, by Country 2019 & 2032
- Table 21: Global Active Pharmaceutical Ingredients Market Revenue Million Forecast, by Country 2019 & 2032
- Table 22: Global Active Pharmaceutical Ingredients Market Volume k unit Forecast, by Country 2019 & 2032
- Table 23: Global Active Pharmaceutical Ingredients Market Revenue Million Forecast, by Business Mode 2019 & 2032
- Table 24: Global Active Pharmaceutical Ingredients Market Volume k unit Forecast, by Business Mode 2019 & 2032
- Table 25: Global Active Pharmaceutical Ingredients Market Revenue Million Forecast, by Synthesis Type 2019 & 2032
- Table 26: Global Active Pharmaceutical Ingredients Market Volume k unit Forecast, by Synthesis Type 2019 & 2032
- Table 27: Global Active Pharmaceutical Ingredients Market Revenue Million Forecast, by Drug Type 2019 & 2032
- Table 28: Global Active Pharmaceutical Ingredients Market Volume k unit Forecast, by Drug Type 2019 & 2032
- Table 29: Global Active Pharmaceutical Ingredients Market Revenue Million Forecast, by Application 2019 & 2032
- Table 30: Global Active Pharmaceutical Ingredients Market Volume k unit Forecast, by Application 2019 & 2032
- Table 31: Global Active Pharmaceutical Ingredients Market Revenue Million Forecast, by Country 2019 & 2032
- Table 32: Global Active Pharmaceutical Ingredients Market Volume k unit Forecast, by Country 2019 & 2032
- Table 33: United States Active Pharmaceutical Ingredients Market Revenue (Million) Forecast, by Application 2019 & 2032
- Table 34: United States Active Pharmaceutical Ingredients Market Volume (k unit ) Forecast, by Application 2019 & 2032
- Table 35: Canada Active Pharmaceutical Ingredients Market Revenue (Million) Forecast, by Application 2019 & 2032
- Table 36: Canada Active Pharmaceutical Ingredients Market Volume (k unit ) Forecast, by Application 2019 & 2032
- Table 37: Mexico Active Pharmaceutical Ingredients Market Revenue (Million) Forecast, by Application 2019 & 2032
- Table 38: Mexico Active Pharmaceutical Ingredients Market Volume (k unit ) Forecast, by Application 2019 & 2032
- Table 39: Global Active Pharmaceutical Ingredients Market Revenue Million Forecast, by Business Mode 2019 & 2032
- Table 40: Global Active Pharmaceutical Ingredients Market Volume k unit Forecast, by Business Mode 2019 & 2032
- Table 41: Global Active Pharmaceutical Ingredients Market Revenue Million Forecast, by Synthesis Type 2019 & 2032
- Table 42: Global Active Pharmaceutical Ingredients Market Volume k unit Forecast, by Synthesis Type 2019 & 2032
- Table 43: Global Active Pharmaceutical Ingredients Market Revenue Million Forecast, by Drug Type 2019 & 2032
- Table 44: Global Active Pharmaceutical Ingredients Market Volume k unit Forecast, by Drug Type 2019 & 2032
- Table 45: Global Active Pharmaceutical Ingredients Market Revenue Million Forecast, by Application 2019 & 2032
- Table 46: Global Active Pharmaceutical Ingredients Market Volume k unit Forecast, by Application 2019 & 2032
- Table 47: Global Active Pharmaceutical Ingredients Market Revenue Million Forecast, by Country 2019 & 2032
- Table 48: Global Active Pharmaceutical Ingredients Market Volume k unit Forecast, by Country 2019 & 2032
- Table 49: Brazil Active Pharmaceutical Ingredients Market Revenue (Million) Forecast, by Application 2019 & 2032
- Table 50: Brazil Active Pharmaceutical Ingredients Market Volume (k unit ) Forecast, by Application 2019 & 2032
- Table 51: Argentina Active Pharmaceutical Ingredients Market Revenue (Million) Forecast, by Application 2019 & 2032
- Table 52: Argentina Active Pharmaceutical Ingredients Market Volume (k unit ) Forecast, by Application 2019 & 2032
- Table 53: Rest of South America Active Pharmaceutical Ingredients Market Revenue (Million) Forecast, by Application 2019 & 2032
- Table 54: Rest of South America Active Pharmaceutical Ingredients Market Volume (k unit ) Forecast, by Application 2019 & 2032
- Table 55: Global Active Pharmaceutical Ingredients Market Revenue Million Forecast, by Business Mode 2019 & 2032
- Table 56: Global Active Pharmaceutical Ingredients Market Volume k unit Forecast, by Business Mode 2019 & 2032
- Table 57: Global Active Pharmaceutical Ingredients Market Revenue Million Forecast, by Synthesis Type 2019 & 2032
- Table 58: Global Active Pharmaceutical Ingredients Market Volume k unit Forecast, by Synthesis Type 2019 & 2032
- Table 59: Global Active Pharmaceutical Ingredients Market Revenue Million Forecast, by Drug Type 2019 & 2032
- Table 60: Global Active Pharmaceutical Ingredients Market Volume k unit Forecast, by Drug Type 2019 & 2032
- Table 61: Global Active Pharmaceutical Ingredients Market Revenue Million Forecast, by Application 2019 & 2032
- Table 62: Global Active Pharmaceutical Ingredients Market Volume k unit Forecast, by Application 2019 & 2032
- Table 63: Global Active Pharmaceutical Ingredients Market Revenue Million Forecast, by Country 2019 & 2032
- Table 64: Global Active Pharmaceutical Ingredients Market Volume k unit Forecast, by Country 2019 & 2032
- Table 65: United Kingdom Active Pharmaceutical Ingredients Market Revenue (Million) Forecast, by Application 2019 & 2032
- Table 66: United Kingdom Active Pharmaceutical Ingredients Market Volume (k unit ) Forecast, by Application 2019 & 2032
- Table 67: Germany Active Pharmaceutical Ingredients Market Revenue (Million) Forecast, by Application 2019 & 2032
- Table 68: Germany Active Pharmaceutical Ingredients Market Volume (k unit ) Forecast, by Application 2019 & 2032
- Table 69: France Active Pharmaceutical Ingredients Market Revenue (Million) Forecast, by Application 2019 & 2032
- Table 70: France Active Pharmaceutical Ingredients Market Volume (k unit ) Forecast, by Application 2019 & 2032
- Table 71: Italy Active Pharmaceutical Ingredients Market Revenue (Million) Forecast, by Application 2019 & 2032
- Table 72: Italy Active Pharmaceutical Ingredients Market Volume (k unit ) Forecast, by Application 2019 & 2032
- Table 73: Spain Active Pharmaceutical Ingredients Market Revenue (Million) Forecast, by Application 2019 & 2032
- Table 74: Spain Active Pharmaceutical Ingredients Market Volume (k unit ) Forecast, by Application 2019 & 2032
- Table 75: Russia Active Pharmaceutical Ingredients Market Revenue (Million) Forecast, by Application 2019 & 2032
- Table 76: Russia Active Pharmaceutical Ingredients Market Volume (k unit ) Forecast, by Application 2019 & 2032
- Table 77: Benelux Active Pharmaceutical Ingredients Market Revenue (Million) Forecast, by Application 2019 & 2032
- Table 78: Benelux Active Pharmaceutical Ingredients Market Volume (k unit ) Forecast, by Application 2019 & 2032
- Table 79: Nordics Active Pharmaceutical Ingredients Market Revenue (Million) Forecast, by Application 2019 & 2032
- Table 80: Nordics Active Pharmaceutical Ingredients Market Volume (k unit ) Forecast, by Application 2019 & 2032
- Table 81: Rest of Europe Active Pharmaceutical Ingredients Market Revenue (Million) Forecast, by Application 2019 & 2032
- Table 82: Rest of Europe Active Pharmaceutical Ingredients Market Volume (k unit ) Forecast, by Application 2019 & 2032
- Table 83: Global Active Pharmaceutical Ingredients Market Revenue Million Forecast, by Business Mode 2019 & 2032
- Table 84: Global Active Pharmaceutical Ingredients Market Volume k unit Forecast, by Business Mode 2019 & 2032
- Table 85: Global Active Pharmaceutical Ingredients Market Revenue Million Forecast, by Synthesis Type 2019 & 2032
- Table 86: Global Active Pharmaceutical Ingredients Market Volume k unit Forecast, by Synthesis Type 2019 & 2032
- Table 87: Global Active Pharmaceutical Ingredients Market Revenue Million Forecast, by Drug Type 2019 & 2032
- Table 88: Global Active Pharmaceutical Ingredients Market Volume k unit Forecast, by Drug Type 2019 & 2032
- Table 89: Global Active Pharmaceutical Ingredients Market Revenue Million Forecast, by Application 2019 & 2032
- Table 90: Global Active Pharmaceutical Ingredients Market Volume k unit Forecast, by Application 2019 & 2032
- Table 91: Global Active Pharmaceutical Ingredients Market Revenue Million Forecast, by Country 2019 & 2032
- Table 92: Global Active Pharmaceutical Ingredients Market Volume k unit Forecast, by Country 2019 & 2032
- Table 93: Turkey Active Pharmaceutical Ingredients Market Revenue (Million) Forecast, by Application 2019 & 2032
- Table 94: Turkey Active Pharmaceutical Ingredients Market Volume (k unit ) Forecast, by Application 2019 & 2032
- Table 95: Israel Active Pharmaceutical Ingredients Market Revenue (Million) Forecast, by Application 2019 & 2032
- Table 96: Israel Active Pharmaceutical Ingredients Market Volume (k unit ) Forecast, by Application 2019 & 2032
- Table 97: GCC Active Pharmaceutical Ingredients Market Revenue (Million) Forecast, by Application 2019 & 2032
- Table 98: GCC Active Pharmaceutical Ingredients Market Volume (k unit ) Forecast, by Application 2019 & 2032
- Table 99: North Africa Active Pharmaceutical Ingredients Market Revenue (Million) Forecast, by Application 2019 & 2032
- Table 100: North Africa Active Pharmaceutical Ingredients Market Volume (k unit ) Forecast, by Application 2019 & 2032
- Table 101: South Africa Active Pharmaceutical Ingredients Market Revenue (Million) Forecast, by Application 2019 & 2032
- Table 102: South Africa Active Pharmaceutical Ingredients Market Volume (k unit ) Forecast, by Application 2019 & 2032
- Table 103: Rest of Middle East & Africa Active Pharmaceutical Ingredients Market Revenue (Million) Forecast, by Application 2019 & 2032
- Table 104: Rest of Middle East & Africa Active Pharmaceutical Ingredients Market Volume (k unit ) Forecast, by Application 2019 & 2032
- Table 105: Global Active Pharmaceutical Ingredients Market Revenue Million Forecast, by Business Mode 2019 & 2032
- Table 106: Global Active Pharmaceutical Ingredients Market Volume k unit Forecast, by Business Mode 2019 & 2032
- Table 107: Global Active Pharmaceutical Ingredients Market Revenue Million Forecast, by Synthesis Type 2019 & 2032
- Table 108: Global Active Pharmaceutical Ingredients Market Volume k unit Forecast, by Synthesis Type 2019 & 2032
- Table 109: Global Active Pharmaceutical Ingredients Market Revenue Million Forecast, by Drug Type 2019 & 2032
- Table 110: Global Active Pharmaceutical Ingredients Market Volume k unit Forecast, by Drug Type 2019 & 2032
- Table 111: Global Active Pharmaceutical Ingredients Market Revenue Million Forecast, by Application 2019 & 2032
- Table 112: Global Active Pharmaceutical Ingredients Market Volume k unit Forecast, by Application 2019 & 2032
- Table 113: Global Active Pharmaceutical Ingredients Market Revenue Million Forecast, by Country 2019 & 2032
- Table 114: Global Active Pharmaceutical Ingredients Market Volume k unit Forecast, by Country 2019 & 2032
- Table 115: China Active Pharmaceutical Ingredients Market Revenue (Million) Forecast, by Application 2019 & 2032
- Table 116: China Active Pharmaceutical Ingredients Market Volume (k unit ) Forecast, by Application 2019 & 2032
- Table 117: India Active Pharmaceutical Ingredients Market Revenue (Million) Forecast, by Application 2019 & 2032
- Table 118: India Active Pharmaceutical Ingredients Market Volume (k unit ) Forecast, by Application 2019 & 2032
- Table 119: Japan Active Pharmaceutical Ingredients Market Revenue (Million) Forecast, by Application 2019 & 2032
- Table 120: Japan Active Pharmaceutical Ingredients Market Volume (k unit ) Forecast, by Application 2019 & 2032
- Table 121: South Korea Active Pharmaceutical Ingredients Market Revenue (Million) Forecast, by Application 2019 & 2032
- Table 122: South Korea Active Pharmaceutical Ingredients Market Volume (k unit ) Forecast, by Application 2019 & 2032
- Table 123: ASEAN Active Pharmaceutical Ingredients Market Revenue (Million) Forecast, by Application 2019 & 2032
- Table 124: ASEAN Active Pharmaceutical Ingredients Market Volume (k unit ) Forecast, by Application 2019 & 2032
- Table 125: Oceania Active Pharmaceutical Ingredients Market Revenue (Million) Forecast, by Application 2019 & 2032
- Table 126: Oceania Active Pharmaceutical Ingredients Market Volume (k unit ) Forecast, by Application 2019 & 2032
- Table 127: Rest of Asia Pacific Active Pharmaceutical Ingredients Market Revenue (Million) Forecast, by Application 2019 & 2032
- Table 128: Rest of Asia Pacific Active Pharmaceutical Ingredients Market Volume (k unit ) Forecast, by Application 2019 & 2032
Frequently Asked Questions
1. What is the projected Compound Annual Growth Rate (CAGR) of the Active Pharmaceutical Ingredients Market?
The projected CAGR is approximately 8.31%.
2. Which companies are prominent players in the Active Pharmaceutical Ingredients Market?
Key companies in the market include Boehringer Ingelheim GmbH, Novartis AG, Viatris Inc, Lupin Ltd, BASF SE, Sun Pharmaceutical Industries Ltd, Aurobindo Pharma, Sanofi Inc, Dr Reddy's Laboratories Ltd, GlaxoSmithKline PLC, Pfizer Inc.
3. What are the main segments of the Active Pharmaceutical Ingredients Market?
The market segments include Business Mode, Synthesis Type, Drug Type, Application.
4. Can you provide details about the market size?
The market size is estimated to be USD 13.64 Million as of 2022.
5. What are some drivers contributing to market growth?
Increasing Prevalence of Infectious. Genetic. Cardiovascular. and Other Chronic Disorders; Rising Research & Development Activities of Generic Drugs; Increasing Adoption of Biologicals and Biosimilars.
6. What are the notable trends driving market growth?
Oncology Segment Expects to Register a High CAGR.
7. Are there any restraints impacting market growth?
Drug Price Control Policies; Stringent Regulations and Drug Price Policies in the Country.
8. Can you provide examples of recent developments in the market?
July 2022: Piramal Pharma Limited's Pharma Solutions business, a leading Contract Development and Manufacturing Organization (CDMO), launched a new active pharmaceutical ingredient (API) plant at the company's site in Aurora, Ontario.
9. What pricing options are available for accessing the report?
Pricing options include single-user, multi-user, and enterprise licenses priced at USD 3800, USD 4500, and USD 5800 respectively.
10. Is the market size provided in terms of value or volume?
The market size is provided in terms of value, measured in Million and volume, measured in k unit .
11. Are there any specific market keywords associated with the report?
Yes, the market keyword associated with the report is "Active Pharmaceutical Ingredients Market," which aids in identifying and referencing the specific market segment covered.
12. How do I determine which pricing option suits my needs best?
The pricing options vary based on user requirements and access needs. Individual users may opt for single-user licenses, while businesses requiring broader access may choose multi-user or enterprise licenses for cost-effective access to the report.
13. Are there any additional resources or data provided in the Active Pharmaceutical Ingredients Market report?
While the report offers comprehensive insights, it's advisable to review the specific contents or supplementary materials provided to ascertain if additional resources or data are available.
14. How can I stay updated on further developments or reports in the Active Pharmaceutical Ingredients Market?
To stay informed about further developments, trends, and reports in the Active Pharmaceutical Ingredients Market, consider subscribing to industry newsletters, following relevant companies and organizations, or regularly checking reputable industry news sources and publications.
Methodology
Step 1 - Identification of Relevant Samples Size from Population Database


Step 2 - Approaches for Defining Global Market Size (Value, Volume* & Price*)

Note*: In applicable scenarios
Step 3 - Data Sources
Primary Research
- Web Analytics
- Survey Reports
- Research Institute
- Latest Research Reports
- Opinion Leaders
Secondary Research
- Annual Reports
- White Paper
- Latest Press Release
- Industry Association
- Paid Database
- Investor Presentations

Step 4 - Data Triangulation
Involves using different sources of information in order to increase the validity of a study
These sources are likely to be stakeholders in a program - participants, other researchers, program staff, other community members, and so on.
Then we put all data in single framework & apply various statistical tools to find out the dynamic on the market.
During the analysis stage, feedback from the stakeholder groups would be compared to determine areas of agreement as well as areas of divergence
