

Key Insights
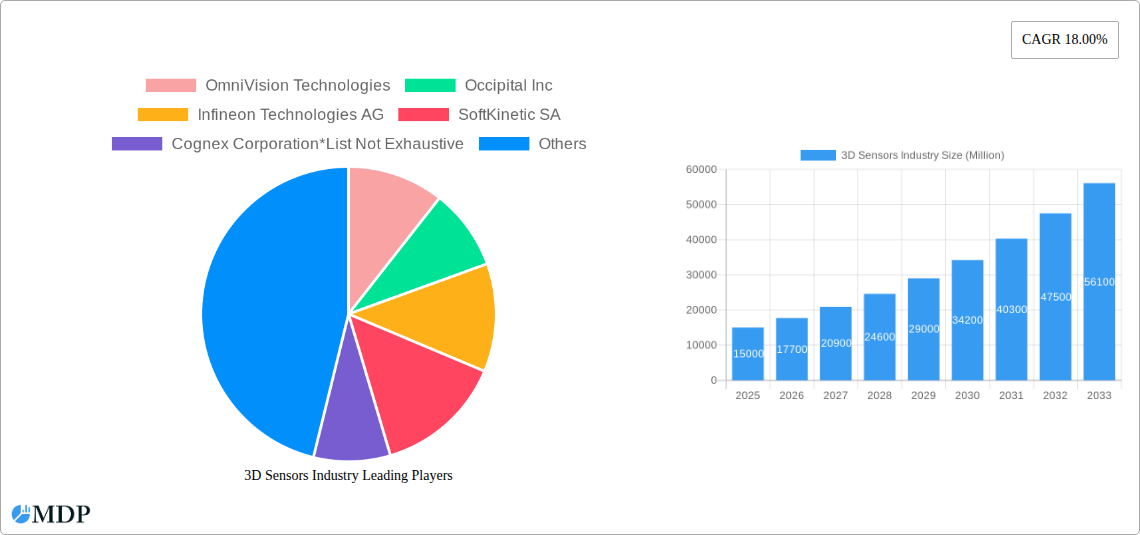
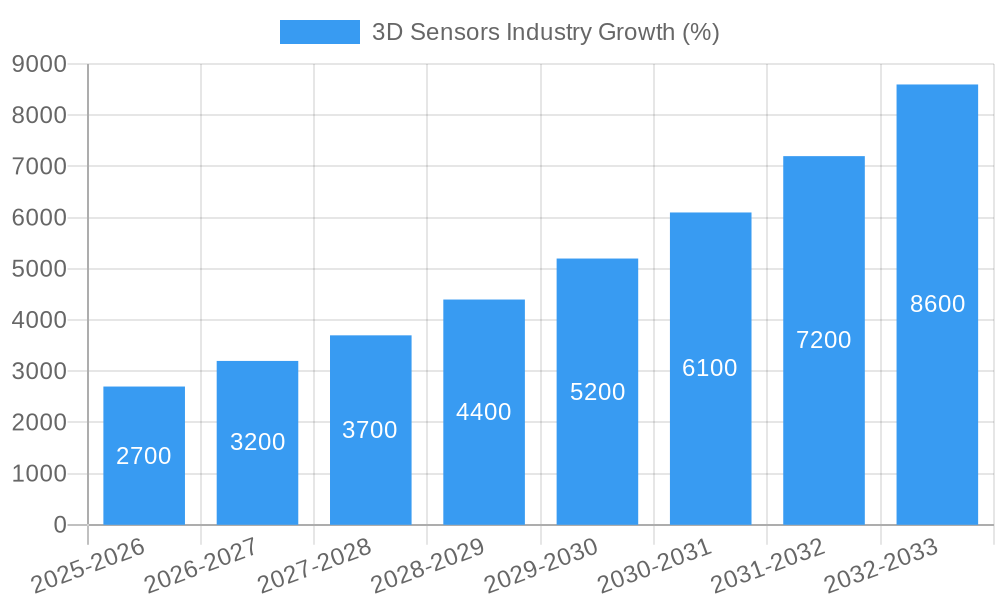
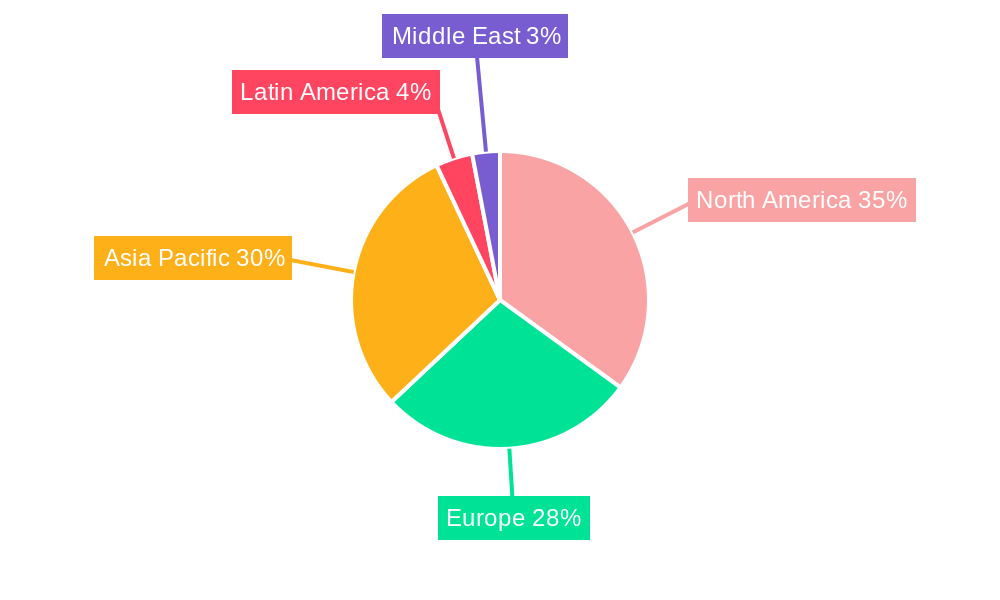
The 3D sensor market is experiencing robust growth, projected to reach a substantial size with a Compound Annual Growth Rate (CAGR) of 18% from 2025 to 2033. This expansion is fueled by several key drivers. The increasing integration of 3D sensing technologies across diverse sectors, notably consumer electronics (driven by the demand for advanced features in smartphones and gaming consoles), automotive (for advanced driver-assistance systems (ADAS) and autonomous vehicles), and healthcare (for medical imaging and minimally invasive surgeries), is a primary catalyst. Furthermore, ongoing advancements in sensor technologies, such as improvements in accuracy, resolution, and miniaturization, are enhancing the capabilities and applications of 3D sensors, driving market penetration. The growing demand for enhanced user experiences, coupled with the rising need for automation and precise measurements in various industries, further propels market growth. While challenges exist, such as the relatively high cost of certain 3D sensor technologies and potential concerns about data privacy related to depth image capture, the overall market trajectory remains overwhelmingly positive. The market segmentation reveals the dominance of ultrasound technology in certain applications, while structured light and time-of-flight technologies are gaining traction due to their improved performance characteristics. Leading companies like OmniVision Technologies, Infineon Technologies AG, and others are actively driving innovation and expanding their market presence through strategic partnerships and technological advancements. The geographic distribution shows a strong presence across North America and Asia-Pacific, fueled by high technological adoption and manufacturing capabilities in these regions.
The forecast period (2025-2033) anticipates continuous growth, fueled by emerging applications in areas such as augmented and virtual reality, robotics, and industrial automation. Further expansion is expected in developing economies, given the increasing digitalization and technological advancements. Competition is likely to intensify as new players enter the market, leading to price reductions and innovation. The various sensor types (position, image, temperature, and accelerometer sensors) cater to specific application needs, presenting opportunities for specialized players. The market is likely to witness increased mergers and acquisitions as established companies seek to strengthen their market position and broaden their product portfolios. Overall, the 3D sensor market presents a compelling investment opportunity with strong potential for significant growth in the coming years. The market is expected to witness a shift towards more cost-effective and efficient sensor solutions, further enhancing their market adoption.
3D Sensors Industry Market Report: 2019-2033
This comprehensive report provides an in-depth analysis of the 3D sensors industry, covering market dynamics, leading players, technological advancements, and future growth opportunities. With a study period spanning 2019-2033, a base year of 2025, and a forecast period of 2025-2033, this report is an essential resource for industry stakeholders seeking to navigate this rapidly evolving landscape. The market is projected to reach xx Million by 2033, showcasing significant growth potential.
3D Sensors Industry Market Dynamics & Concentration
The 3D sensors market is characterized by moderate concentration, with several key players vying for market share. Innovation is a crucial driver, fueled by advancements in technologies like Time-of-Flight (ToF), structured light, and ultrasound. Stringent regulatory frameworks, particularly concerning data privacy and safety in applications like automotive and healthcare, shape market dynamics. Product substitutes, such as 2D cameras in certain applications, pose a competitive challenge. End-user trends, including the rising demand for enhanced user experiences in consumer electronics and the growing adoption of autonomous vehicles, are key growth catalysts. Mergers and acquisitions (M&A) activity has been moderate, with a recorded xx M&A deals between 2019 and 2024, reflecting strategic efforts to consolidate market positions and acquire niche technologies. Market share is currently distributed amongst major players, with no single dominant entity holding a majority.
- Market Concentration: Moderate, with no single dominant player.
- Innovation Drivers: Advancements in ToF, structured light, and ultrasound technologies.
- Regulatory Frameworks: Stringent regulations influencing data privacy and safety.
- Product Substitutes: 2D cameras offering cost-effective alternatives in specific applications.
- M&A Activity: xx deals between 2019 and 2024, indicating strategic consolidation.
3D Sensors Industry Trends & Analysis
The 3D sensors market exhibits a robust Compound Annual Growth Rate (CAGR) of xx% during the forecast period (2025-2033), driven by several key factors. The increasing integration of 3D sensing technology into consumer electronics, such as smartphones and tablets, for enhanced functionalities like facial recognition and augmented reality (AR), is a primary growth driver. Technological disruptions, including the development of more accurate, efficient, and cost-effective 3D sensing solutions, further fuel market expansion. Consumer preferences are shifting towards devices offering seamless and intuitive user experiences, increasing demand for sophisticated 3D sensing capabilities. Competitive dynamics are intense, with established players and emerging startups innovating and expanding their product portfolios to cater to diverse market needs. Market penetration is expected to reach xx% by 2033, indicating significant growth potential across various end-user verticals.
Leading Markets & Segments in 3D Sensors Industry
The Asia Pacific region is projected to dominate the 3D sensors market during the forecast period due to rapid technological advancements, rising consumer electronics adoption, and supportive government initiatives. Within technology segments, Time-of-Flight (ToF) holds the largest market share, driven by its cost-effectiveness and accuracy. The automotive sector leads in end-user verticals, fueled by the increasing demand for advanced driver-assistance systems (ADAS) and autonomous vehicles. Image sensors dominate the product segment, owing to their widespread use in various applications.
Key Drivers by Segment:
By Technology:
- Time of Flight (ToF): Cost-effectiveness and accuracy.
- Structured Light: High precision in specific applications.
- Ultrasound: Robustness and suitability for certain environments.
By End User Vertical:
- Automotive: ADAS and autonomous vehicle development.
- Consumer Electronics: Smartphones, tablets, and AR/VR devices.
- Healthcare: Medical imaging and diagnostics.
By Product:
- Image Sensors: Wide applicability across various sectors.
- Position Sensors: Precise positional data for robotics and automation.
Dominance Analysis:
The Asia-Pacific region's dominance stems from strong economic growth, increasing disposable incomes, and a large consumer base. The automotive sector's leadership reflects the rising adoption of ADAS and autonomous driving technology globally.
3D Sensors Industry Product Developments
Recent product innovations highlight trends toward miniaturization, improved accuracy, and enhanced energy efficiency. For example, ams OSRAM's 2.2Mpixel image sensor demonstrates the industry's focus on low-power consumption for VR/AR applications. New products are tailored to specific applications, offering competitive advantages based on superior performance, reduced costs, or unique functionalities. This trend is expected to continue, with ongoing research and development driving the integration of 3D sensing into diverse applications across various sectors.
Key Drivers of 3D Sensors Industry Growth
Several factors are accelerating the growth of the 3D sensors industry. Technological advancements, leading to smaller, cheaper, and more accurate sensors, are crucial. Economic factors, like the increasing disposable income in emerging markets, drive demand for consumer electronics equipped with 3D sensing technology. Government regulations promoting the adoption of autonomous vehicles and smart city initiatives further boost the market.
Challenges in the 3D Sensors Industry Market
The 3D sensors industry faces several challenges. Stricter regulatory compliance, especially concerning data privacy, increases costs and complexity. Supply chain disruptions can impact production and pricing, limiting market growth. Intense competition, with both established and emerging players, puts pressure on profit margins. These factors can collectively reduce the market’s expansion rate by an estimated xx% annually.
Emerging Opportunities in the 3D Sensors Industry
The 3D sensors market presents significant long-term opportunities. Technological breakthroughs, such as advancements in AI-powered image processing, will enhance sensor capabilities. Strategic partnerships between sensor manufacturers and technology companies will lead to innovative applications and broader market penetration. Expansion into new market segments, including robotics and industrial automation, offers untapped growth potential.
Leading Players in the 3D Sensors Industry Sector
- OmniVision Technologies
- Occipital Inc
- Infineon Technologies AG
- SoftKinetic SA
- Cognex Corporation
- Sick AG
- XYZ Interactive Technologies
- Panasonic Corporation
- Intel Corporation
- LMI Technologies
Key Milestones in 3D Sensors Industry
- August 2022: ams OSRAM launches a 2.2Mpixel global shutter image sensor for VR/AR applications, driving innovation in consumer electronics.
- July 2022: Toposens launches a 3D collision avoidance system for mobile robots, signifying progress in robotics and automation.
- April 2022: Panasonic unveils the LUMIX GH6 camera, highlighting the integration of 3D sensing technologies into advanced imaging systems.
Strategic Outlook for 3D Sensors Industry Market
The future of the 3D sensors market is promising, with continued growth driven by technological advancements and increasing demand across diverse applications. Strategic partnerships, focused research and development, and expansion into new markets will be crucial for success. The market's potential for innovation and disruption is significant, offering substantial opportunities for companies that can adapt to the evolving technological landscape and meet the demands of various end-user sectors.
3D Sensors Industry Segmentation
-
1. Product
- 1.1. Position Sensor
- 1.2. Image Sensor
- 1.3. Temperature Sensor
- 1.4. Accelerometer Sensor
- 1.5. Other Products
-
2. Technology
- 2.1. Ultrasound
- 2.2. Structured Light
- 2.3. Time of Flight
- 2.4. Other Technologies
-
3. End User Vertical
- 3.1. Consumer Electronics
- 3.2. Automotive
- 3.3. Healthcare
- 3.4. Other End User Verticals
3D Sensors Industry Segmentation By Geography
-
1. North America
- 1.1. United States
- 1.2. Canada
-
2. Europe
- 2.1. United Kingdom
- 2.2. Germany
- 2.3. France
- 2.4. Rest of Europe
-
3. Asia Pacific
- 3.1. China
- 3.2. Japan
- 3.3. India
- 3.4. Rest of the Asia Pacific
-
4. Latin America
- 4.1. Mexico
- 5. Middle East
3D Sensors Industry REPORT HIGHLIGHTS
| Aspects | Details |
|---|---|
| Study Period | 2019-2033 |
| Base Year | 2024 |
| Estimated Year | 2025 |
| Forecast Period | 2025-2033 |
| Historical Period | 2019-2024 |
| Growth Rate | CAGR of 18.00% from 2019-2033 |
| Segmentation |
|
Table of Contents
- 1. Introduction
- 1.1. Research Scope
- 1.2. Market Segmentation
- 1.3. Research Methodology
- 1.4. Definitions and Assumptions
- 2. Executive Summary
- 2.1. Introduction
- 3. Market Dynamics
- 3.1. Introduction
- 3.2. Market Drivers
- 3.2.1. Rising Demand for 3D-enabled Devices in Consumer Electronics; Increasing Use of 3D Sensing Technology in Gaming Applications; Integration of Optical and Electronic Components in Miniaturized Electronics Devices
- 3.3. Market Restrains
- 3.3.1. High Cost Required for the Maintenance of these Devices; Integration With Interfaces in Different Devices
- 3.4. Market Trends
- 3.4.1. Automotive to Hold Significant Share
- 4. Market Factor Analysis
- 4.1. Porters Five Forces
- 4.2. Supply/Value Chain
- 4.3. PESTEL analysis
- 4.4. Market Entropy
- 4.5. Patent/Trademark Analysis
- 5. Global 3D Sensors Industry Analysis, Insights and Forecast, 2019-2031
- 5.1. Market Analysis, Insights and Forecast - by Product
- 5.1.1. Position Sensor
- 5.1.2. Image Sensor
- 5.1.3. Temperature Sensor
- 5.1.4. Accelerometer Sensor
- 5.1.5. Other Products
- 5.2. Market Analysis, Insights and Forecast - by Technology
- 5.2.1. Ultrasound
- 5.2.2. Structured Light
- 5.2.3. Time of Flight
- 5.2.4. Other Technologies
- 5.3. Market Analysis, Insights and Forecast - by End User Vertical
- 5.3.1. Consumer Electronics
- 5.3.2. Automotive
- 5.3.3. Healthcare
- 5.3.4. Other End User Verticals
- 5.4. Market Analysis, Insights and Forecast - by Region
- 5.4.1. North America
- 5.4.2. Europe
- 5.4.3. Asia Pacific
- 5.4.4. Latin America
- 5.4.5. Middle East
- 5.1. Market Analysis, Insights and Forecast - by Product
- 6. North America 3D Sensors Industry Analysis, Insights and Forecast, 2019-2031
- 6.1. Market Analysis, Insights and Forecast - by Product
- 6.1.1. Position Sensor
- 6.1.2. Image Sensor
- 6.1.3. Temperature Sensor
- 6.1.4. Accelerometer Sensor
- 6.1.5. Other Products
- 6.2. Market Analysis, Insights and Forecast - by Technology
- 6.2.1. Ultrasound
- 6.2.2. Structured Light
- 6.2.3. Time of Flight
- 6.2.4. Other Technologies
- 6.3. Market Analysis, Insights and Forecast - by End User Vertical
- 6.3.1. Consumer Electronics
- 6.3.2. Automotive
- 6.3.3. Healthcare
- 6.3.4. Other End User Verticals
- 6.1. Market Analysis, Insights and Forecast - by Product
- 7. Europe 3D Sensors Industry Analysis, Insights and Forecast, 2019-2031
- 7.1. Market Analysis, Insights and Forecast - by Product
- 7.1.1. Position Sensor
- 7.1.2. Image Sensor
- 7.1.3. Temperature Sensor
- 7.1.4. Accelerometer Sensor
- 7.1.5. Other Products
- 7.2. Market Analysis, Insights and Forecast - by Technology
- 7.2.1. Ultrasound
- 7.2.2. Structured Light
- 7.2.3. Time of Flight
- 7.2.4. Other Technologies
- 7.3. Market Analysis, Insights and Forecast - by End User Vertical
- 7.3.1. Consumer Electronics
- 7.3.2. Automotive
- 7.3.3. Healthcare
- 7.3.4. Other End User Verticals
- 7.1. Market Analysis, Insights and Forecast - by Product
- 8. Asia Pacific 3D Sensors Industry Analysis, Insights and Forecast, 2019-2031
- 8.1. Market Analysis, Insights and Forecast - by Product
- 8.1.1. Position Sensor
- 8.1.2. Image Sensor
- 8.1.3. Temperature Sensor
- 8.1.4. Accelerometer Sensor
- 8.1.5. Other Products
- 8.2. Market Analysis, Insights and Forecast - by Technology
- 8.2.1. Ultrasound
- 8.2.2. Structured Light
- 8.2.3. Time of Flight
- 8.2.4. Other Technologies
- 8.3. Market Analysis, Insights and Forecast - by End User Vertical
- 8.3.1. Consumer Electronics
- 8.3.2. Automotive
- 8.3.3. Healthcare
- 8.3.4. Other End User Verticals
- 8.1. Market Analysis, Insights and Forecast - by Product
- 9. Latin America 3D Sensors Industry Analysis, Insights and Forecast, 2019-2031
- 9.1. Market Analysis, Insights and Forecast - by Product
- 9.1.1. Position Sensor
- 9.1.2. Image Sensor
- 9.1.3. Temperature Sensor
- 9.1.4. Accelerometer Sensor
- 9.1.5. Other Products
- 9.2. Market Analysis, Insights and Forecast - by Technology
- 9.2.1. Ultrasound
- 9.2.2. Structured Light
- 9.2.3. Time of Flight
- 9.2.4. Other Technologies
- 9.3. Market Analysis, Insights and Forecast - by End User Vertical
- 9.3.1. Consumer Electronics
- 9.3.2. Automotive
- 9.3.3. Healthcare
- 9.3.4. Other End User Verticals
- 9.1. Market Analysis, Insights and Forecast - by Product
- 10. Middle East 3D Sensors Industry Analysis, Insights and Forecast, 2019-2031
- 10.1. Market Analysis, Insights and Forecast - by Product
- 10.1.1. Position Sensor
- 10.1.2. Image Sensor
- 10.1.3. Temperature Sensor
- 10.1.4. Accelerometer Sensor
- 10.1.5. Other Products
- 10.2. Market Analysis, Insights and Forecast - by Technology
- 10.2.1. Ultrasound
- 10.2.2. Structured Light
- 10.2.3. Time of Flight
- 10.2.4. Other Technologies
- 10.3. Market Analysis, Insights and Forecast - by End User Vertical
- 10.3.1. Consumer Electronics
- 10.3.2. Automotive
- 10.3.3. Healthcare
- 10.3.4. Other End User Verticals
- 10.1. Market Analysis, Insights and Forecast - by Product
- 11. North America 3D Sensors Industry Analysis, Insights and Forecast, 2019-2031
- 11.1. Market Analysis, Insights and Forecast - By Country/Sub-region
- 11.1.1 United States
- 11.1.2 Canada
- 12. Europe 3D Sensors Industry Analysis, Insights and Forecast, 2019-2031
- 12.1. Market Analysis, Insights and Forecast - By Country/Sub-region
- 12.1.1 United Kingdom
- 12.1.2 Germany
- 12.1.3 France
- 12.1.4 Rest of Europe
- 13. Asia Pacific 3D Sensors Industry Analysis, Insights and Forecast, 2019-2031
- 13.1. Market Analysis, Insights and Forecast - By Country/Sub-region
- 13.1.1 China
- 13.1.2 Japan
- 13.1.3 India
- 13.1.4 Rest of the Asia Pacific
- 14. Latin America 3D Sensors Industry Analysis, Insights and Forecast, 2019-2031
- 14.1. Market Analysis, Insights and Forecast - By Country/Sub-region
- 14.1.1. Mexico
- 15. Middle East 3D Sensors Industry Analysis, Insights and Forecast, 2019-2031
- 15.1. Market Analysis, Insights and Forecast - By Country/Sub-region
- 15.1.1.
- 16. Competitive Analysis
- 16.1. Global Market Share Analysis 2024
- 16.2. Company Profiles
- 16.2.1 OmniVision Technologies
- 16.2.1.1. Overview
- 16.2.1.2. Products
- 16.2.1.3. SWOT Analysis
- 16.2.1.4. Recent Developments
- 16.2.1.5. Financials (Based on Availability)
- 16.2.2 Occipital Inc
- 16.2.2.1. Overview
- 16.2.2.2. Products
- 16.2.2.3. SWOT Analysis
- 16.2.2.4. Recent Developments
- 16.2.2.5. Financials (Based on Availability)
- 16.2.3 Infineon Technologies AG
- 16.2.3.1. Overview
- 16.2.3.2. Products
- 16.2.3.3. SWOT Analysis
- 16.2.3.4. Recent Developments
- 16.2.3.5. Financials (Based on Availability)
- 16.2.4 SoftKinetic SA
- 16.2.4.1. Overview
- 16.2.4.2. Products
- 16.2.4.3. SWOT Analysis
- 16.2.4.4. Recent Developments
- 16.2.4.5. Financials (Based on Availability)
- 16.2.5 Cognex Corporation*List Not Exhaustive
- 16.2.5.1. Overview
- 16.2.5.2. Products
- 16.2.5.3. SWOT Analysis
- 16.2.5.4. Recent Developments
- 16.2.5.5. Financials (Based on Availability)
- 16.2.6 Sick AG
- 16.2.6.1. Overview
- 16.2.6.2. Products
- 16.2.6.3. SWOT Analysis
- 16.2.6.4. Recent Developments
- 16.2.6.5. Financials (Based on Availability)
- 16.2.7 XYZ Interactive Technologies
- 16.2.7.1. Overview
- 16.2.7.2. Products
- 16.2.7.3. SWOT Analysis
- 16.2.7.4. Recent Developments
- 16.2.7.5. Financials (Based on Availability)
- 16.2.8 Panasonic Corporation
- 16.2.8.1. Overview
- 16.2.8.2. Products
- 16.2.8.3. SWOT Analysis
- 16.2.8.4. Recent Developments
- 16.2.8.5. Financials (Based on Availability)
- 16.2.9 Intel Corporation
- 16.2.9.1. Overview
- 16.2.9.2. Products
- 16.2.9.3. SWOT Analysis
- 16.2.9.4. Recent Developments
- 16.2.9.5. Financials (Based on Availability)
- 16.2.10 LMI Technologies
- 16.2.10.1. Overview
- 16.2.10.2. Products
- 16.2.10.3. SWOT Analysis
- 16.2.10.4. Recent Developments
- 16.2.10.5. Financials (Based on Availability)
- 16.2.1 OmniVision Technologies
List of Figures
- Figure 1: Global 3D Sensors Industry Revenue Breakdown (Million, %) by Region 2024 & 2032
- Figure 2: North America 3D Sensors Industry Revenue (Million), by Country 2024 & 2032
- Figure 3: North America 3D Sensors Industry Revenue Share (%), by Country 2024 & 2032
- Figure 4: Europe 3D Sensors Industry Revenue (Million), by Country 2024 & 2032
- Figure 5: Europe 3D Sensors Industry Revenue Share (%), by Country 2024 & 2032
- Figure 6: Asia Pacific 3D Sensors Industry Revenue (Million), by Country 2024 & 2032
- Figure 7: Asia Pacific 3D Sensors Industry Revenue Share (%), by Country 2024 & 2032
- Figure 8: Latin America 3D Sensors Industry Revenue (Million), by Country 2024 & 2032
- Figure 9: Latin America 3D Sensors Industry Revenue Share (%), by Country 2024 & 2032
- Figure 10: Middle East 3D Sensors Industry Revenue (Million), by Country 2024 & 2032
- Figure 11: Middle East 3D Sensors Industry Revenue Share (%), by Country 2024 & 2032
- Figure 12: North America 3D Sensors Industry Revenue (Million), by Product 2024 & 2032
- Figure 13: North America 3D Sensors Industry Revenue Share (%), by Product 2024 & 2032
- Figure 14: North America 3D Sensors Industry Revenue (Million), by Technology 2024 & 2032
- Figure 15: North America 3D Sensors Industry Revenue Share (%), by Technology 2024 & 2032
- Figure 16: North America 3D Sensors Industry Revenue (Million), by End User Vertical 2024 & 2032
- Figure 17: North America 3D Sensors Industry Revenue Share (%), by End User Vertical 2024 & 2032
- Figure 18: North America 3D Sensors Industry Revenue (Million), by Country 2024 & 2032
- Figure 19: North America 3D Sensors Industry Revenue Share (%), by Country 2024 & 2032
- Figure 20: Europe 3D Sensors Industry Revenue (Million), by Product 2024 & 2032
- Figure 21: Europe 3D Sensors Industry Revenue Share (%), by Product 2024 & 2032
- Figure 22: Europe 3D Sensors Industry Revenue (Million), by Technology 2024 & 2032
- Figure 23: Europe 3D Sensors Industry Revenue Share (%), by Technology 2024 & 2032
- Figure 24: Europe 3D Sensors Industry Revenue (Million), by End User Vertical 2024 & 2032
- Figure 25: Europe 3D Sensors Industry Revenue Share (%), by End User Vertical 2024 & 2032
- Figure 26: Europe 3D Sensors Industry Revenue (Million), by Country 2024 & 2032
- Figure 27: Europe 3D Sensors Industry Revenue Share (%), by Country 2024 & 2032
- Figure 28: Asia Pacific 3D Sensors Industry Revenue (Million), by Product 2024 & 2032
- Figure 29: Asia Pacific 3D Sensors Industry Revenue Share (%), by Product 2024 & 2032
- Figure 30: Asia Pacific 3D Sensors Industry Revenue (Million), by Technology 2024 & 2032
- Figure 31: Asia Pacific 3D Sensors Industry Revenue Share (%), by Technology 2024 & 2032
- Figure 32: Asia Pacific 3D Sensors Industry Revenue (Million), by End User Vertical 2024 & 2032
- Figure 33: Asia Pacific 3D Sensors Industry Revenue Share (%), by End User Vertical 2024 & 2032
- Figure 34: Asia Pacific 3D Sensors Industry Revenue (Million), by Country 2024 & 2032
- Figure 35: Asia Pacific 3D Sensors Industry Revenue Share (%), by Country 2024 & 2032
- Figure 36: Latin America 3D Sensors Industry Revenue (Million), by Product 2024 & 2032
- Figure 37: Latin America 3D Sensors Industry Revenue Share (%), by Product 2024 & 2032
- Figure 38: Latin America 3D Sensors Industry Revenue (Million), by Technology 2024 & 2032
- Figure 39: Latin America 3D Sensors Industry Revenue Share (%), by Technology 2024 & 2032
- Figure 40: Latin America 3D Sensors Industry Revenue (Million), by End User Vertical 2024 & 2032
- Figure 41: Latin America 3D Sensors Industry Revenue Share (%), by End User Vertical 2024 & 2032
- Figure 42: Latin America 3D Sensors Industry Revenue (Million), by Country 2024 & 2032
- Figure 43: Latin America 3D Sensors Industry Revenue Share (%), by Country 2024 & 2032
- Figure 44: Middle East 3D Sensors Industry Revenue (Million), by Product 2024 & 2032
- Figure 45: Middle East 3D Sensors Industry Revenue Share (%), by Product 2024 & 2032
- Figure 46: Middle East 3D Sensors Industry Revenue (Million), by Technology 2024 & 2032
- Figure 47: Middle East 3D Sensors Industry Revenue Share (%), by Technology 2024 & 2032
- Figure 48: Middle East 3D Sensors Industry Revenue (Million), by End User Vertical 2024 & 2032
- Figure 49: Middle East 3D Sensors Industry Revenue Share (%), by End User Vertical 2024 & 2032
- Figure 50: Middle East 3D Sensors Industry Revenue (Million), by Country 2024 & 2032
- Figure 51: Middle East 3D Sensors Industry Revenue Share (%), by Country 2024 & 2032
List of Tables
- Table 1: Global 3D Sensors Industry Revenue Million Forecast, by Region 2019 & 2032
- Table 2: Global 3D Sensors Industry Revenue Million Forecast, by Product 2019 & 2032
- Table 3: Global 3D Sensors Industry Revenue Million Forecast, by Technology 2019 & 2032
- Table 4: Global 3D Sensors Industry Revenue Million Forecast, by End User Vertical 2019 & 2032
- Table 5: Global 3D Sensors Industry Revenue Million Forecast, by Region 2019 & 2032
- Table 6: Global 3D Sensors Industry Revenue Million Forecast, by Country 2019 & 2032
- Table 7: United States 3D Sensors Industry Revenue (Million) Forecast, by Application 2019 & 2032
- Table 8: Canada 3D Sensors Industry Revenue (Million) Forecast, by Application 2019 & 2032
- Table 9: Global 3D Sensors Industry Revenue Million Forecast, by Country 2019 & 2032
- Table 10: United Kingdom 3D Sensors Industry Revenue (Million) Forecast, by Application 2019 & 2032
- Table 11: Germany 3D Sensors Industry Revenue (Million) Forecast, by Application 2019 & 2032
- Table 12: France 3D Sensors Industry Revenue (Million) Forecast, by Application 2019 & 2032
- Table 13: Rest of Europe 3D Sensors Industry Revenue (Million) Forecast, by Application 2019 & 2032
- Table 14: Global 3D Sensors Industry Revenue Million Forecast, by Country 2019 & 2032
- Table 15: China 3D Sensors Industry Revenue (Million) Forecast, by Application 2019 & 2032
- Table 16: Japan 3D Sensors Industry Revenue (Million) Forecast, by Application 2019 & 2032
- Table 17: India 3D Sensors Industry Revenue (Million) Forecast, by Application 2019 & 2032
- Table 18: Rest of the Asia Pacific 3D Sensors Industry Revenue (Million) Forecast, by Application 2019 & 2032
- Table 19: Global 3D Sensors Industry Revenue Million Forecast, by Country 2019 & 2032
- Table 20: Mexico 3D Sensors Industry Revenue (Million) Forecast, by Application 2019 & 2032
- Table 21: Global 3D Sensors Industry Revenue Million Forecast, by Country 2019 & 2032
- Table 22: 3D Sensors Industry Revenue (Million) Forecast, by Application 2019 & 2032
- Table 23: Global 3D Sensors Industry Revenue Million Forecast, by Product 2019 & 2032
- Table 24: Global 3D Sensors Industry Revenue Million Forecast, by Technology 2019 & 2032
- Table 25: Global 3D Sensors Industry Revenue Million Forecast, by End User Vertical 2019 & 2032
- Table 26: Global 3D Sensors Industry Revenue Million Forecast, by Country 2019 & 2032
- Table 27: United States 3D Sensors Industry Revenue (Million) Forecast, by Application 2019 & 2032
- Table 28: Canada 3D Sensors Industry Revenue (Million) Forecast, by Application 2019 & 2032
- Table 29: Global 3D Sensors Industry Revenue Million Forecast, by Product 2019 & 2032
- Table 30: Global 3D Sensors Industry Revenue Million Forecast, by Technology 2019 & 2032
- Table 31: Global 3D Sensors Industry Revenue Million Forecast, by End User Vertical 2019 & 2032
- Table 32: Global 3D Sensors Industry Revenue Million Forecast, by Country 2019 & 2032
- Table 33: United Kingdom 3D Sensors Industry Revenue (Million) Forecast, by Application 2019 & 2032
- Table 34: Germany 3D Sensors Industry Revenue (Million) Forecast, by Application 2019 & 2032
- Table 35: France 3D Sensors Industry Revenue (Million) Forecast, by Application 2019 & 2032
- Table 36: Rest of Europe 3D Sensors Industry Revenue (Million) Forecast, by Application 2019 & 2032
- Table 37: Global 3D Sensors Industry Revenue Million Forecast, by Product 2019 & 2032
- Table 38: Global 3D Sensors Industry Revenue Million Forecast, by Technology 2019 & 2032
- Table 39: Global 3D Sensors Industry Revenue Million Forecast, by End User Vertical 2019 & 2032
- Table 40: Global 3D Sensors Industry Revenue Million Forecast, by Country 2019 & 2032
- Table 41: China 3D Sensors Industry Revenue (Million) Forecast, by Application 2019 & 2032
- Table 42: Japan 3D Sensors Industry Revenue (Million) Forecast, by Application 2019 & 2032
- Table 43: India 3D Sensors Industry Revenue (Million) Forecast, by Application 2019 & 2032
- Table 44: Rest of the Asia Pacific 3D Sensors Industry Revenue (Million) Forecast, by Application 2019 & 2032
- Table 45: Global 3D Sensors Industry Revenue Million Forecast, by Product 2019 & 2032
- Table 46: Global 3D Sensors Industry Revenue Million Forecast, by Technology 2019 & 2032
- Table 47: Global 3D Sensors Industry Revenue Million Forecast, by End User Vertical 2019 & 2032
- Table 48: Global 3D Sensors Industry Revenue Million Forecast, by Country 2019 & 2032
- Table 49: Mexico 3D Sensors Industry Revenue (Million) Forecast, by Application 2019 & 2032
- Table 50: Global 3D Sensors Industry Revenue Million Forecast, by Product 2019 & 2032
- Table 51: Global 3D Sensors Industry Revenue Million Forecast, by Technology 2019 & 2032
- Table 52: Global 3D Sensors Industry Revenue Million Forecast, by End User Vertical 2019 & 2032
- Table 53: Global 3D Sensors Industry Revenue Million Forecast, by Country 2019 & 2032
Frequently Asked Questions
1. What is the projected Compound Annual Growth Rate (CAGR) of the 3D Sensors Industry?
The projected CAGR is approximately 18.00%.
2. Which companies are prominent players in the 3D Sensors Industry?
Key companies in the market include OmniVision Technologies, Occipital Inc, Infineon Technologies AG, SoftKinetic SA, Cognex Corporation*List Not Exhaustive, Sick AG, XYZ Interactive Technologies, Panasonic Corporation, Intel Corporation, LMI Technologies.
3. What are the main segments of the 3D Sensors Industry?
The market segments include Product, Technology, End User Vertical.
4. Can you provide details about the market size?
The market size is estimated to be USD XX Million as of 2022.
5. What are some drivers contributing to market growth?
Rising Demand for 3D-enabled Devices in Consumer Electronics; Increasing Use of 3D Sensing Technology in Gaming Applications; Integration of Optical and Electronic Components in Miniaturized Electronics Devices.
6. What are the notable trends driving market growth?
Automotive to Hold Significant Share.
7. Are there any restraints impacting market growth?
High Cost Required for the Maintenance of these Devices; Integration With Interfaces in Different Devices.
8. Can you provide examples of recent developments in the market?
August 2022 : ams OSRAM, a global leader in optical solutions, announced the release of a 2.2Mpixel global shutter visible and near-infrared (NIR) image sensor with the low-power characteristics and small size required in the latest 2D and 3D sensing systems for virtual reality (VR) headsets, smart glasses, drones, and other consumer and industrial applications.
9. What pricing options are available for accessing the report?
Pricing options include single-user, multi-user, and enterprise licenses priced at USD 4750, USD 5250, and USD 8750 respectively.
10. Is the market size provided in terms of value or volume?
The market size is provided in terms of value, measured in Million.
11. Are there any specific market keywords associated with the report?
Yes, the market keyword associated with the report is "3D Sensors Industry," which aids in identifying and referencing the specific market segment covered.
12. How do I determine which pricing option suits my needs best?
The pricing options vary based on user requirements and access needs. Individual users may opt for single-user licenses, while businesses requiring broader access may choose multi-user or enterprise licenses for cost-effective access to the report.
13. Are there any additional resources or data provided in the 3D Sensors Industry report?
While the report offers comprehensive insights, it's advisable to review the specific contents or supplementary materials provided to ascertain if additional resources or data are available.
14. How can I stay updated on further developments or reports in the 3D Sensors Industry?
To stay informed about further developments, trends, and reports in the 3D Sensors Industry, consider subscribing to industry newsletters, following relevant companies and organizations, or regularly checking reputable industry news sources and publications.
Methodology
Step 1 - Identification of Relevant Samples Size from Population Database


Step 2 - Approaches for Defining Global Market Size (Value, Volume* & Price*)

Note*: In applicable scenarios
Step 3 - Data Sources
Primary Research
- Web Analytics
- Survey Reports
- Research Institute
- Latest Research Reports
- Opinion Leaders
Secondary Research
- Annual Reports
- White Paper
- Latest Press Release
- Industry Association
- Paid Database
- Investor Presentations

Step 4 - Data Triangulation
Involves using different sources of information in order to increase the validity of a study
These sources are likely to be stakeholders in a program - participants, other researchers, program staff, other community members, and so on.
Then we put all data in single framework & apply various statistical tools to find out the dynamic on the market.
During the analysis stage, feedback from the stakeholder groups would be compared to determine areas of agreement as well as areas of divergence
