

Key Insights
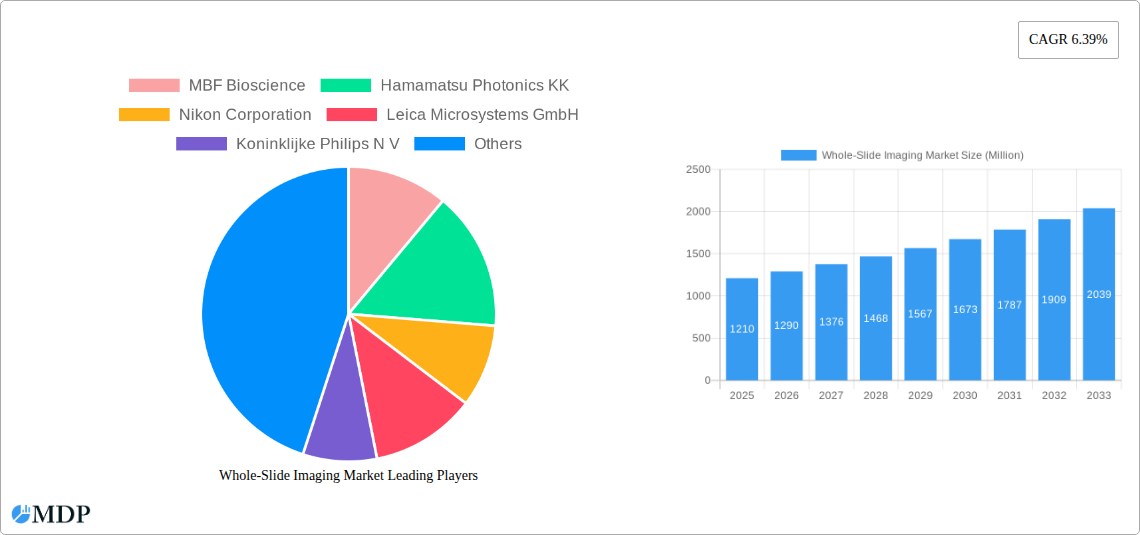
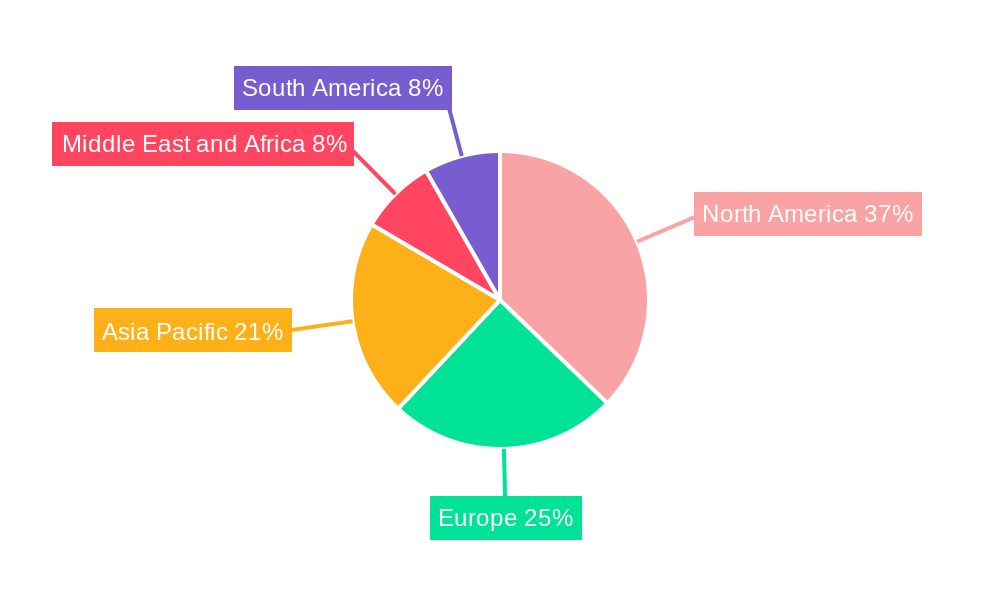
The global whole-slide imaging (WSI) market, valued at $1.21 billion in 2025, is projected to experience robust growth, driven by the increasing adoption of digital pathology in healthcare settings. This expansion is fueled by several key factors. Firstly, WSI offers significant advantages over traditional microscopy, including improved efficiency, enhanced collaboration among pathologists, and the potential for remote diagnosis. The rising prevalence of chronic diseases, coupled with the growing demand for accurate and timely diagnoses, further propels market growth. Technological advancements, such as the development of higher-resolution scanners and advanced image analysis software, are also contributing to the market's expansion. Furthermore, the integration of artificial intelligence (AI) and machine learning (ML) into WSI systems is creating new opportunities for automated image analysis and improved diagnostic accuracy, attracting substantial investment and driving innovation. The market is segmented by technology (scanners, IT infrastructure, viewers, image management systems), application (telepathology, cytopathology, immunohistochemistry, hematopathology), and end-user (academic institutes, research facilities, hospitals). North America currently holds a significant market share, due to advanced healthcare infrastructure and high adoption rates of digital pathology. However, Asia Pacific is expected to witness substantial growth in the coming years, driven by increasing healthcare expenditure and growing awareness of advanced diagnostic techniques.
The competitive landscape is marked by a blend of established players like Leica Microsystems, Nikon, and Olympus, and emerging companies specializing in specific WSI technologies or applications. These companies are actively engaged in research and development, strategic partnerships, and acquisitions to maintain their market position and expand their product portfolios. While high initial investment costs and the need for specialized training can act as restraints, the long-term benefits of WSI in terms of cost-effectiveness, improved diagnostic accuracy, and enhanced workflow efficiency are expected to outweigh these challenges, resulting in sustained market growth throughout the forecast period. The market is anticipated to continue its trajectory of expansion, driven by ongoing technological advancements, increasing demand for efficient diagnostic solutions, and the expanding application of WSI in various pathological disciplines.
Whole-Slide Imaging Market: A Comprehensive Report (2019-2033)
This comprehensive report provides an in-depth analysis of the Whole-Slide Imaging market, offering actionable insights for stakeholders across the industry. Covering the period from 2019 to 2033, with a focus on 2025, this report meticulously examines market dynamics, leading players, technological advancements, and future growth projections. The report's detailed segmentation and analysis of key trends will equip you with the knowledge needed to navigate this rapidly evolving market. Expected market value in 2025 is estimated at xx Million.
Whole-Slide Imaging Market Market Dynamics & Concentration
The Whole-Slide Imaging market is experiencing significant growth, driven by technological advancements, increasing demand for digital pathology solutions, and favorable regulatory frameworks. Market concentration is moderate, with several key players holding significant market share, while smaller, specialized companies also contribute to innovation. The market share of the top 5 players is estimated at xx%, with MBF Bioscience, Hamamatsu Photonics KK, Nikon Corporation, Leica Microsystems GmbH, and Koninklijke Philips N V among the leading companies. Innovation is a key driver, with continuous development of higher-resolution scanners, advanced image analysis software, and cloud-based solutions. Regulatory approvals and reimbursement policies play a critical role, influencing market adoption rates. Substitutes, such as traditional microscopy methods, are gradually being replaced due to the advantages offered by whole-slide imaging. End-user trends show a shift towards digital pathology workflows in academic institutions, research labs, and hospitals. The number of M&A activities in the market has increased in recent years, with approximately xx deals recorded in the past 5 years, indicating consolidation and expansion within the sector.
- Market Concentration: Moderate, top 5 players holding xx% market share.
- Innovation Drivers: Higher-resolution scanners, AI-powered image analysis, cloud-based platforms.
- Regulatory Frameworks: Influencing adoption rates and reimbursement.
- Product Substitutes: Traditional microscopy methods facing gradual displacement.
- End-User Trends: Growing adoption in academic, research, and clinical settings.
- M&A Activities: Approximately xx deals in the last 5 years.
Whole-Slide Imaging Market Industry Trends & Analysis
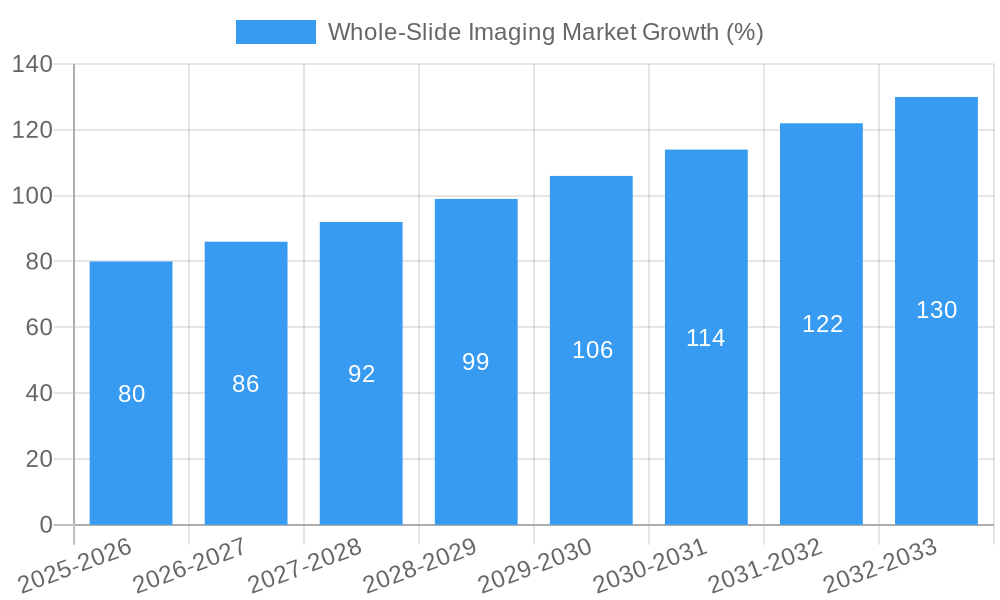
The Whole-Slide Imaging market exhibits a robust CAGR of xx% during the forecast period (2025-2033), driven by several key factors. The increasing adoption of digital pathology in healthcare settings is a major catalyst, enabling remote consultations, improved diagnostic accuracy, and enhanced collaborative workflows. Technological disruptions, such as the integration of artificial intelligence (AI) and machine learning (ML) algorithms for automated image analysis, are revolutionizing diagnostic capabilities and efficiency. Consumer preferences are shifting towards faster, more precise, and cost-effective diagnostic solutions, creating a strong demand for whole-slide imaging technologies. Competitive dynamics are shaped by continuous innovation, strategic partnerships, and the introduction of new products and services. Market penetration is expected to reach xx% by 2033, indicating substantial growth potential across various applications and end-user segments. The integration of AI and machine learning algorithms is expected to increase the efficiency and accuracy of disease diagnosis, creating growth opportunities.
Leading Markets & Segments in Whole-Slide Imaging Market
The North American region dominates the Whole-Slide Imaging market, driven by strong technological advancements, substantial investments in healthcare infrastructure, and early adoption of digital pathology. Within the segments, the scanners segment currently holds the largest market share, followed by IT infrastructure. In applications, Telepathology is witnessing rapid growth due to the increasing need for remote diagnostics, while Immunohistochemistry and Hematopathology represent significant application areas. Academic Institutes and Research sectors are major end-users, driven by the need for advanced research and education tools.
Key Drivers (North America):
- Strong technological advancements.
- High healthcare infrastructure investment.
- Early adoption of digital pathology.
Dominant Segments:
- By Technology: Scanners, IT Infrastructure.
- By Application: Telepathology, Immunohistochemistry, Hematopathology.
- By End User: Academic Institutes, Research.
Whole-Slide Imaging Market Product Developments
Recent product innovations focus on enhancing scanner resolution, integrating AI-powered image analysis tools, and developing user-friendly image management systems. These advancements are aimed at improving diagnostic accuracy, workflow efficiency, and user experience. The market is witnessing a trend towards cloud-based solutions that enable remote access and collaboration, expanding the reach and accessibility of whole-slide imaging technologies. These products offer advantages such as improved diagnostic accuracy, cost-effectiveness, and increased efficiency compared to traditional methods.
Key Drivers of Whole-Slide Imaging Market Growth
The Whole-Slide Imaging market is propelled by several key factors. Technological advancements such as high-resolution scanners, AI-driven image analysis, and cloud-based platforms are driving adoption. Economic factors, including rising healthcare expenditure and the demand for cost-effective diagnostic solutions, are also significant drivers. Favorable regulatory frameworks and reimbursement policies further accelerate market growth. For example, the increasing number of government initiatives promoting the adoption of digital pathology is creating a positive impact on market growth.
Challenges in the Whole-Slide Imaging Market Market
Despite the considerable growth potential, the Whole-Slide Imaging market faces challenges. High initial investment costs for equipment and software can deter adoption, particularly in resource-constrained settings. Regulatory hurdles and the need for standardization across different systems pose obstacles. Supply chain disruptions and the competitive landscape, with established players and emerging companies vying for market share, add to the complexities. These factors can significantly impact market growth if not addressed effectively. The estimated impact of these challenges on market growth is approximately xx% reduction in growth rate.
Emerging Opportunities in Whole-Slide Imaging Market
The long-term growth of the Whole-Slide Imaging market is promising. Technological breakthroughs, such as the integration of advanced AI and ML algorithms, will significantly enhance diagnostic capabilities and create new opportunities. Strategic partnerships between technology providers and healthcare institutions will further accelerate adoption. Expanding into new geographic markets and tapping into unmet clinical needs, such as personalized medicine and telepathology, present significant growth potential.
Leading Players in the Whole-Slide Imaging Market Sector
- MBF Bioscience
- Hamamatsu Photonics KK
- Nikon Corporation
- Leica Microsystems GmbH
- Koninklijke Philips N V
- 3Dhistech
- Visiopharm
- Indica Labs
- Molecular Machines & Industries
- Mikroscan Technologies Inc
- Olympus Corporation
- Akoya Biosciences
Key Milestones in Whole-Slide Imaging Market Industry
- March 2023: Pramana, Inc. collaborates with PathPresenter to accelerate enterprise adoption of digital pathology workflows. This collaboration aims to streamline the user experience for labs adopting digital pathology solutions.
- March 2023: Hamamatsu enters a multi-year distribution agreement with Siemens Healthineers, expanding access to Hamamatsu's whole-slide scanners in the Americas and Europe. This partnership significantly boosts Siemens Healthineer's digital pathology offerings.
Strategic Outlook for Whole-Slide Imaging Market Market
The Whole-Slide Imaging market holds immense potential for future growth, driven by technological advancements, increasing demand for digital pathology, and favorable regulatory landscapes. Strategic opportunities lie in developing innovative products, expanding into emerging markets, and forging strategic partnerships. Focusing on AI-powered image analysis, cloud-based solutions, and personalized medicine applications will be crucial for maximizing market share and achieving long-term success. The market is expected to witness significant expansion in the coming years, offering lucrative opportunities for players across the value chain.
Whole-Slide Imaging Market Segmentation
-
1. Technology
- 1.1. Scanners
- 1.2. IT Infrastructure
- 1.3. Viewer
- 1.4. Image Management System
-
2. Application
- 2.1. Telepathology
- 2.2. Cytopathology
- 2.3. Immunohistochemistry
- 2.4. Hematopathology
-
3. End User
- 3.1. Academic Institute
- 3.2. Research
- 3.3. Others
Whole-Slide Imaging Market Segmentation By Geography
-
1. North America
- 1.1. United States
- 1.2. Canada
- 1.3. Mexico
-
2. Europe
- 2.1. Germany
- 2.2. United Kingdom
- 2.3. France
- 2.4. Italy
- 2.5. Spain
- 2.6. Rest of Europe
-
3. Asia Pacific
- 3.1. China
- 3.2. Japan
- 3.3. India
- 3.4. Australia
- 3.5. South korea
- 3.6. Rest of Asia Pacific
-
4. Middle East and Africa
- 4.1. GCC
- 4.2. South Africa
- 4.3. Rest of Middle East and Africa
-
5. South America
- 5.1. Brazil
- 5.2. Argentina
- 5.3. Rest of South America
Whole-Slide Imaging Market REPORT HIGHLIGHTS
| Aspects | Details |
|---|---|
| Study Period | 2019-2033 |
| Base Year | 2024 |
| Estimated Year | 2025 |
| Forecast Period | 2025-2033 |
| Historical Period | 2019-2024 |
| Growth Rate | CAGR of 6.39% from 2019-2033 |
| Segmentation |
|
Table of Contents
- 1. Introduction
- 1.1. Research Scope
- 1.2. Market Segmentation
- 1.3. Research Methodology
- 1.4. Definitions and Assumptions
- 2. Executive Summary
- 2.1. Introduction
- 3. Market Dynamics
- 3.1. Introduction
- 3.2. Market Drivers
- 3.2.1. Growing Popularity of Virtual Slides as Compared to Physical Slides; Technological Advancements in Whole Slide Imaging; Increasing Research in Drug Discovery
- 3.3. Market Restrains
- 3.3.1. Stringent Regulatory Approvals; High Cost of Whole Slide Imaging Systems
- 3.4. Market Trends
- 3.4.1. Telepathology Segment is Expected to Grow Significantly Over the Forecast Period
- 4. Market Factor Analysis
- 4.1. Porters Five Forces
- 4.2. Supply/Value Chain
- 4.3. PESTEL analysis
- 4.4. Market Entropy
- 4.5. Patent/Trademark Analysis
- 5. Global Whole-Slide Imaging Market Analysis, Insights and Forecast, 2019-2031
- 5.1. Market Analysis, Insights and Forecast - by Technology
- 5.1.1. Scanners
- 5.1.2. IT Infrastructure
- 5.1.3. Viewer
- 5.1.4. Image Management System
- 5.2. Market Analysis, Insights and Forecast - by Application
- 5.2.1. Telepathology
- 5.2.2. Cytopathology
- 5.2.3. Immunohistochemistry
- 5.2.4. Hematopathology
- 5.3. Market Analysis, Insights and Forecast - by End User
- 5.3.1. Academic Institute
- 5.3.2. Research
- 5.3.3. Others
- 5.4. Market Analysis, Insights and Forecast - by Region
- 5.4.1. North America
- 5.4.2. Europe
- 5.4.3. Asia Pacific
- 5.4.4. Middle East and Africa
- 5.4.5. South America
- 5.1. Market Analysis, Insights and Forecast - by Technology
- 6. North America Whole-Slide Imaging Market Analysis, Insights and Forecast, 2019-2031
- 6.1. Market Analysis, Insights and Forecast - by Technology
- 6.1.1. Scanners
- 6.1.2. IT Infrastructure
- 6.1.3. Viewer
- 6.1.4. Image Management System
- 6.2. Market Analysis, Insights and Forecast - by Application
- 6.2.1. Telepathology
- 6.2.2. Cytopathology
- 6.2.3. Immunohistochemistry
- 6.2.4. Hematopathology
- 6.3. Market Analysis, Insights and Forecast - by End User
- 6.3.1. Academic Institute
- 6.3.2. Research
- 6.3.3. Others
- 6.1. Market Analysis, Insights and Forecast - by Technology
- 7. Europe Whole-Slide Imaging Market Analysis, Insights and Forecast, 2019-2031
- 7.1. Market Analysis, Insights and Forecast - by Technology
- 7.1.1. Scanners
- 7.1.2. IT Infrastructure
- 7.1.3. Viewer
- 7.1.4. Image Management System
- 7.2. Market Analysis, Insights and Forecast - by Application
- 7.2.1. Telepathology
- 7.2.2. Cytopathology
- 7.2.3. Immunohistochemistry
- 7.2.4. Hematopathology
- 7.3. Market Analysis, Insights and Forecast - by End User
- 7.3.1. Academic Institute
- 7.3.2. Research
- 7.3.3. Others
- 7.1. Market Analysis, Insights and Forecast - by Technology
- 8. Asia Pacific Whole-Slide Imaging Market Analysis, Insights and Forecast, 2019-2031
- 8.1. Market Analysis, Insights and Forecast - by Technology
- 8.1.1. Scanners
- 8.1.2. IT Infrastructure
- 8.1.3. Viewer
- 8.1.4. Image Management System
- 8.2. Market Analysis, Insights and Forecast - by Application
- 8.2.1. Telepathology
- 8.2.2. Cytopathology
- 8.2.3. Immunohistochemistry
- 8.2.4. Hematopathology
- 8.3. Market Analysis, Insights and Forecast - by End User
- 8.3.1. Academic Institute
- 8.3.2. Research
- 8.3.3. Others
- 8.1. Market Analysis, Insights and Forecast - by Technology
- 9. Middle East and Africa Whole-Slide Imaging Market Analysis, Insights and Forecast, 2019-2031
- 9.1. Market Analysis, Insights and Forecast - by Technology
- 9.1.1. Scanners
- 9.1.2. IT Infrastructure
- 9.1.3. Viewer
- 9.1.4. Image Management System
- 9.2. Market Analysis, Insights and Forecast - by Application
- 9.2.1. Telepathology
- 9.2.2. Cytopathology
- 9.2.3. Immunohistochemistry
- 9.2.4. Hematopathology
- 9.3. Market Analysis, Insights and Forecast - by End User
- 9.3.1. Academic Institute
- 9.3.2. Research
- 9.3.3. Others
- 9.1. Market Analysis, Insights and Forecast - by Technology
- 10. South America Whole-Slide Imaging Market Analysis, Insights and Forecast, 2019-2031
- 10.1. Market Analysis, Insights and Forecast - by Technology
- 10.1.1. Scanners
- 10.1.2. IT Infrastructure
- 10.1.3. Viewer
- 10.1.4. Image Management System
- 10.2. Market Analysis, Insights and Forecast - by Application
- 10.2.1. Telepathology
- 10.2.2. Cytopathology
- 10.2.3. Immunohistochemistry
- 10.2.4. Hematopathology
- 10.3. Market Analysis, Insights and Forecast - by End User
- 10.3.1. Academic Institute
- 10.3.2. Research
- 10.3.3. Others
- 10.1. Market Analysis, Insights and Forecast - by Technology
- 11. North America Whole-Slide Imaging Market Analysis, Insights and Forecast, 2019-2031
- 11.1. Market Analysis, Insights and Forecast - By Country/Sub-region
- 11.1.1 United States
- 11.1.2 Canada
- 11.1.3 Mexico
- 12. Europe Whole-Slide Imaging Market Analysis, Insights and Forecast, 2019-2031
- 12.1. Market Analysis, Insights and Forecast - By Country/Sub-region
- 12.1.1 Germany
- 12.1.2 United Kingdom
- 12.1.3 France
- 12.1.4 Italy
- 12.1.5 Spain
- 12.1.6 Rest of Europe
- 13. Asia Pacific Whole-Slide Imaging Market Analysis, Insights and Forecast, 2019-2031
- 13.1. Market Analysis, Insights and Forecast - By Country/Sub-region
- 13.1.1 China
- 13.1.2 Japan
- 13.1.3 India
- 13.1.4 Australia
- 13.1.5 South korea
- 13.1.6 Rest of Asia Pacific
- 14. Middle East and Africa Whole-Slide Imaging Market Analysis, Insights and Forecast, 2019-2031
- 14.1. Market Analysis, Insights and Forecast - By Country/Sub-region
- 14.1.1 GCC
- 14.1.2 South Africa
- 14.1.3 Rest of Middle East and Africa
- 15. South America Whole-Slide Imaging Market Analysis, Insights and Forecast, 2019-2031
- 15.1. Market Analysis, Insights and Forecast - By Country/Sub-region
- 15.1.1 Brazil
- 15.1.2 Argentina
- 15.1.3 Rest of South America
- 16. Competitive Analysis
- 16.1. Global Market Share Analysis 2024
- 16.2. Company Profiles
- 16.2.1 MBF Bioscience
- 16.2.1.1. Overview
- 16.2.1.2. Products
- 16.2.1.3. SWOT Analysis
- 16.2.1.4. Recent Developments
- 16.2.1.5. Financials (Based on Availability)
- 16.2.2 Hamamatsu Photonics KK
- 16.2.2.1. Overview
- 16.2.2.2. Products
- 16.2.2.3. SWOT Analysis
- 16.2.2.4. Recent Developments
- 16.2.2.5. Financials (Based on Availability)
- 16.2.3 Nikon Corporation
- 16.2.3.1. Overview
- 16.2.3.2. Products
- 16.2.3.3. SWOT Analysis
- 16.2.3.4. Recent Developments
- 16.2.3.5. Financials (Based on Availability)
- 16.2.4 Leica Microsystems GmbH
- 16.2.4.1. Overview
- 16.2.4.2. Products
- 16.2.4.3. SWOT Analysis
- 16.2.4.4. Recent Developments
- 16.2.4.5. Financials (Based on Availability)
- 16.2.5 Koninklijke Philips N V
- 16.2.5.1. Overview
- 16.2.5.2. Products
- 16.2.5.3. SWOT Analysis
- 16.2.5.4. Recent Developments
- 16.2.5.5. Financials (Based on Availability)
- 16.2.6 3Dhistech
- 16.2.6.1. Overview
- 16.2.6.2. Products
- 16.2.6.3. SWOT Analysis
- 16.2.6.4. Recent Developments
- 16.2.6.5. Financials (Based on Availability)
- 16.2.7 Visiopharm
- 16.2.7.1. Overview
- 16.2.7.2. Products
- 16.2.7.3. SWOT Analysis
- 16.2.7.4. Recent Developments
- 16.2.7.5. Financials (Based on Availability)
- 16.2.8 Indica Labs
- 16.2.8.1. Overview
- 16.2.8.2. Products
- 16.2.8.3. SWOT Analysis
- 16.2.8.4. Recent Developments
- 16.2.8.5. Financials (Based on Availability)
- 16.2.9 Molecular Machines & Industries
- 16.2.9.1. Overview
- 16.2.9.2. Products
- 16.2.9.3. SWOT Analysis
- 16.2.9.4. Recent Developments
- 16.2.9.5. Financials (Based on Availability)
- 16.2.10 Mikroscan Technologies Inc
- 16.2.10.1. Overview
- 16.2.10.2. Products
- 16.2.10.3. SWOT Analysis
- 16.2.10.4. Recent Developments
- 16.2.10.5. Financials (Based on Availability)
- 16.2.11 Olympus Corporation
- 16.2.11.1. Overview
- 16.2.11.2. Products
- 16.2.11.3. SWOT Analysis
- 16.2.11.4. Recent Developments
- 16.2.11.5. Financials (Based on Availability)
- 16.2.12 Akoya Biosciences
- 16.2.12.1. Overview
- 16.2.12.2. Products
- 16.2.12.3. SWOT Analysis
- 16.2.12.4. Recent Developments
- 16.2.12.5. Financials (Based on Availability)
- 16.2.1 MBF Bioscience
List of Figures
- Figure 1: Global Whole-Slide Imaging Market Revenue Breakdown (Million, %) by Region 2024 & 2032
- Figure 2: Global Whole-Slide Imaging Market Volume Breakdown (K Unit, %) by Region 2024 & 2032
- Figure 3: North America Whole-Slide Imaging Market Revenue (Million), by Country 2024 & 2032
- Figure 4: North America Whole-Slide Imaging Market Volume (K Unit), by Country 2024 & 2032
- Figure 5: North America Whole-Slide Imaging Market Revenue Share (%), by Country 2024 & 2032
- Figure 6: North America Whole-Slide Imaging Market Volume Share (%), by Country 2024 & 2032
- Figure 7: Europe Whole-Slide Imaging Market Revenue (Million), by Country 2024 & 2032
- Figure 8: Europe Whole-Slide Imaging Market Volume (K Unit), by Country 2024 & 2032
- Figure 9: Europe Whole-Slide Imaging Market Revenue Share (%), by Country 2024 & 2032
- Figure 10: Europe Whole-Slide Imaging Market Volume Share (%), by Country 2024 & 2032
- Figure 11: Asia Pacific Whole-Slide Imaging Market Revenue (Million), by Country 2024 & 2032
- Figure 12: Asia Pacific Whole-Slide Imaging Market Volume (K Unit), by Country 2024 & 2032
- Figure 13: Asia Pacific Whole-Slide Imaging Market Revenue Share (%), by Country 2024 & 2032
- Figure 14: Asia Pacific Whole-Slide Imaging Market Volume Share (%), by Country 2024 & 2032
- Figure 15: Middle East and Africa Whole-Slide Imaging Market Revenue (Million), by Country 2024 & 2032
- Figure 16: Middle East and Africa Whole-Slide Imaging Market Volume (K Unit), by Country 2024 & 2032
- Figure 17: Middle East and Africa Whole-Slide Imaging Market Revenue Share (%), by Country 2024 & 2032
- Figure 18: Middle East and Africa Whole-Slide Imaging Market Volume Share (%), by Country 2024 & 2032
- Figure 19: South America Whole-Slide Imaging Market Revenue (Million), by Country 2024 & 2032
- Figure 20: South America Whole-Slide Imaging Market Volume (K Unit), by Country 2024 & 2032
- Figure 21: South America Whole-Slide Imaging Market Revenue Share (%), by Country 2024 & 2032
- Figure 22: South America Whole-Slide Imaging Market Volume Share (%), by Country 2024 & 2032
- Figure 23: North America Whole-Slide Imaging Market Revenue (Million), by Technology 2024 & 2032
- Figure 24: North America Whole-Slide Imaging Market Volume (K Unit), by Technology 2024 & 2032
- Figure 25: North America Whole-Slide Imaging Market Revenue Share (%), by Technology 2024 & 2032
- Figure 26: North America Whole-Slide Imaging Market Volume Share (%), by Technology 2024 & 2032
- Figure 27: North America Whole-Slide Imaging Market Revenue (Million), by Application 2024 & 2032
- Figure 28: North America Whole-Slide Imaging Market Volume (K Unit), by Application 2024 & 2032
- Figure 29: North America Whole-Slide Imaging Market Revenue Share (%), by Application 2024 & 2032
- Figure 30: North America Whole-Slide Imaging Market Volume Share (%), by Application 2024 & 2032
- Figure 31: North America Whole-Slide Imaging Market Revenue (Million), by End User 2024 & 2032
- Figure 32: North America Whole-Slide Imaging Market Volume (K Unit), by End User 2024 & 2032
- Figure 33: North America Whole-Slide Imaging Market Revenue Share (%), by End User 2024 & 2032
- Figure 34: North America Whole-Slide Imaging Market Volume Share (%), by End User 2024 & 2032
- Figure 35: North America Whole-Slide Imaging Market Revenue (Million), by Country 2024 & 2032
- Figure 36: North America Whole-Slide Imaging Market Volume (K Unit), by Country 2024 & 2032
- Figure 37: North America Whole-Slide Imaging Market Revenue Share (%), by Country 2024 & 2032
- Figure 38: North America Whole-Slide Imaging Market Volume Share (%), by Country 2024 & 2032
- Figure 39: Europe Whole-Slide Imaging Market Revenue (Million), by Technology 2024 & 2032
- Figure 40: Europe Whole-Slide Imaging Market Volume (K Unit), by Technology 2024 & 2032
- Figure 41: Europe Whole-Slide Imaging Market Revenue Share (%), by Technology 2024 & 2032
- Figure 42: Europe Whole-Slide Imaging Market Volume Share (%), by Technology 2024 & 2032
- Figure 43: Europe Whole-Slide Imaging Market Revenue (Million), by Application 2024 & 2032
- Figure 44: Europe Whole-Slide Imaging Market Volume (K Unit), by Application 2024 & 2032
- Figure 45: Europe Whole-Slide Imaging Market Revenue Share (%), by Application 2024 & 2032
- Figure 46: Europe Whole-Slide Imaging Market Volume Share (%), by Application 2024 & 2032
- Figure 47: Europe Whole-Slide Imaging Market Revenue (Million), by End User 2024 & 2032
- Figure 48: Europe Whole-Slide Imaging Market Volume (K Unit), by End User 2024 & 2032
- Figure 49: Europe Whole-Slide Imaging Market Revenue Share (%), by End User 2024 & 2032
- Figure 50: Europe Whole-Slide Imaging Market Volume Share (%), by End User 2024 & 2032
- Figure 51: Europe Whole-Slide Imaging Market Revenue (Million), by Country 2024 & 2032
- Figure 52: Europe Whole-Slide Imaging Market Volume (K Unit), by Country 2024 & 2032
- Figure 53: Europe Whole-Slide Imaging Market Revenue Share (%), by Country 2024 & 2032
- Figure 54: Europe Whole-Slide Imaging Market Volume Share (%), by Country 2024 & 2032
- Figure 55: Asia Pacific Whole-Slide Imaging Market Revenue (Million), by Technology 2024 & 2032
- Figure 56: Asia Pacific Whole-Slide Imaging Market Volume (K Unit), by Technology 2024 & 2032
- Figure 57: Asia Pacific Whole-Slide Imaging Market Revenue Share (%), by Technology 2024 & 2032
- Figure 58: Asia Pacific Whole-Slide Imaging Market Volume Share (%), by Technology 2024 & 2032
- Figure 59: Asia Pacific Whole-Slide Imaging Market Revenue (Million), by Application 2024 & 2032
- Figure 60: Asia Pacific Whole-Slide Imaging Market Volume (K Unit), by Application 2024 & 2032
- Figure 61: Asia Pacific Whole-Slide Imaging Market Revenue Share (%), by Application 2024 & 2032
- Figure 62: Asia Pacific Whole-Slide Imaging Market Volume Share (%), by Application 2024 & 2032
- Figure 63: Asia Pacific Whole-Slide Imaging Market Revenue (Million), by End User 2024 & 2032
- Figure 64: Asia Pacific Whole-Slide Imaging Market Volume (K Unit), by End User 2024 & 2032
- Figure 65: Asia Pacific Whole-Slide Imaging Market Revenue Share (%), by End User 2024 & 2032
- Figure 66: Asia Pacific Whole-Slide Imaging Market Volume Share (%), by End User 2024 & 2032
- Figure 67: Asia Pacific Whole-Slide Imaging Market Revenue (Million), by Country 2024 & 2032
- Figure 68: Asia Pacific Whole-Slide Imaging Market Volume (K Unit), by Country 2024 & 2032
- Figure 69: Asia Pacific Whole-Slide Imaging Market Revenue Share (%), by Country 2024 & 2032
- Figure 70: Asia Pacific Whole-Slide Imaging Market Volume Share (%), by Country 2024 & 2032
- Figure 71: Middle East and Africa Whole-Slide Imaging Market Revenue (Million), by Technology 2024 & 2032
- Figure 72: Middle East and Africa Whole-Slide Imaging Market Volume (K Unit), by Technology 2024 & 2032
- Figure 73: Middle East and Africa Whole-Slide Imaging Market Revenue Share (%), by Technology 2024 & 2032
- Figure 74: Middle East and Africa Whole-Slide Imaging Market Volume Share (%), by Technology 2024 & 2032
- Figure 75: Middle East and Africa Whole-Slide Imaging Market Revenue (Million), by Application 2024 & 2032
- Figure 76: Middle East and Africa Whole-Slide Imaging Market Volume (K Unit), by Application 2024 & 2032
- Figure 77: Middle East and Africa Whole-Slide Imaging Market Revenue Share (%), by Application 2024 & 2032
- Figure 78: Middle East and Africa Whole-Slide Imaging Market Volume Share (%), by Application 2024 & 2032
- Figure 79: Middle East and Africa Whole-Slide Imaging Market Revenue (Million), by End User 2024 & 2032
- Figure 80: Middle East and Africa Whole-Slide Imaging Market Volume (K Unit), by End User 2024 & 2032
- Figure 81: Middle East and Africa Whole-Slide Imaging Market Revenue Share (%), by End User 2024 & 2032
- Figure 82: Middle East and Africa Whole-Slide Imaging Market Volume Share (%), by End User 2024 & 2032
- Figure 83: Middle East and Africa Whole-Slide Imaging Market Revenue (Million), by Country 2024 & 2032
- Figure 84: Middle East and Africa Whole-Slide Imaging Market Volume (K Unit), by Country 2024 & 2032
- Figure 85: Middle East and Africa Whole-Slide Imaging Market Revenue Share (%), by Country 2024 & 2032
- Figure 86: Middle East and Africa Whole-Slide Imaging Market Volume Share (%), by Country 2024 & 2032
- Figure 87: South America Whole-Slide Imaging Market Revenue (Million), by Technology 2024 & 2032
- Figure 88: South America Whole-Slide Imaging Market Volume (K Unit), by Technology 2024 & 2032
- Figure 89: South America Whole-Slide Imaging Market Revenue Share (%), by Technology 2024 & 2032
- Figure 90: South America Whole-Slide Imaging Market Volume Share (%), by Technology 2024 & 2032
- Figure 91: South America Whole-Slide Imaging Market Revenue (Million), by Application 2024 & 2032
- Figure 92: South America Whole-Slide Imaging Market Volume (K Unit), by Application 2024 & 2032
- Figure 93: South America Whole-Slide Imaging Market Revenue Share (%), by Application 2024 & 2032
- Figure 94: South America Whole-Slide Imaging Market Volume Share (%), by Application 2024 & 2032
- Figure 95: South America Whole-Slide Imaging Market Revenue (Million), by End User 2024 & 2032
- Figure 96: South America Whole-Slide Imaging Market Volume (K Unit), by End User 2024 & 2032
- Figure 97: South America Whole-Slide Imaging Market Revenue Share (%), by End User 2024 & 2032
- Figure 98: South America Whole-Slide Imaging Market Volume Share (%), by End User 2024 & 2032
- Figure 99: South America Whole-Slide Imaging Market Revenue (Million), by Country 2024 & 2032
- Figure 100: South America Whole-Slide Imaging Market Volume (K Unit), by Country 2024 & 2032
- Figure 101: South America Whole-Slide Imaging Market Revenue Share (%), by Country 2024 & 2032
- Figure 102: South America Whole-Slide Imaging Market Volume Share (%), by Country 2024 & 2032
List of Tables
- Table 1: Global Whole-Slide Imaging Market Revenue Million Forecast, by Region 2019 & 2032
- Table 2: Global Whole-Slide Imaging Market Volume K Unit Forecast, by Region 2019 & 2032
- Table 3: Global Whole-Slide Imaging Market Revenue Million Forecast, by Technology 2019 & 2032
- Table 4: Global Whole-Slide Imaging Market Volume K Unit Forecast, by Technology 2019 & 2032
- Table 5: Global Whole-Slide Imaging Market Revenue Million Forecast, by Application 2019 & 2032
- Table 6: Global Whole-Slide Imaging Market Volume K Unit Forecast, by Application 2019 & 2032
- Table 7: Global Whole-Slide Imaging Market Revenue Million Forecast, by End User 2019 & 2032
- Table 8: Global Whole-Slide Imaging Market Volume K Unit Forecast, by End User 2019 & 2032
- Table 9: Global Whole-Slide Imaging Market Revenue Million Forecast, by Region 2019 & 2032
- Table 10: Global Whole-Slide Imaging Market Volume K Unit Forecast, by Region 2019 & 2032
- Table 11: Global Whole-Slide Imaging Market Revenue Million Forecast, by Country 2019 & 2032
- Table 12: Global Whole-Slide Imaging Market Volume K Unit Forecast, by Country 2019 & 2032
- Table 13: United States Whole-Slide Imaging Market Revenue (Million) Forecast, by Application 2019 & 2032
- Table 14: United States Whole-Slide Imaging Market Volume (K Unit) Forecast, by Application 2019 & 2032
- Table 15: Canada Whole-Slide Imaging Market Revenue (Million) Forecast, by Application 2019 & 2032
- Table 16: Canada Whole-Slide Imaging Market Volume (K Unit) Forecast, by Application 2019 & 2032
- Table 17: Mexico Whole-Slide Imaging Market Revenue (Million) Forecast, by Application 2019 & 2032
- Table 18: Mexico Whole-Slide Imaging Market Volume (K Unit) Forecast, by Application 2019 & 2032
- Table 19: Global Whole-Slide Imaging Market Revenue Million Forecast, by Country 2019 & 2032
- Table 20: Global Whole-Slide Imaging Market Volume K Unit Forecast, by Country 2019 & 2032
- Table 21: Germany Whole-Slide Imaging Market Revenue (Million) Forecast, by Application 2019 & 2032
- Table 22: Germany Whole-Slide Imaging Market Volume (K Unit) Forecast, by Application 2019 & 2032
- Table 23: United Kingdom Whole-Slide Imaging Market Revenue (Million) Forecast, by Application 2019 & 2032
- Table 24: United Kingdom Whole-Slide Imaging Market Volume (K Unit) Forecast, by Application 2019 & 2032
- Table 25: France Whole-Slide Imaging Market Revenue (Million) Forecast, by Application 2019 & 2032
- Table 26: France Whole-Slide Imaging Market Volume (K Unit) Forecast, by Application 2019 & 2032
- Table 27: Italy Whole-Slide Imaging Market Revenue (Million) Forecast, by Application 2019 & 2032
- Table 28: Italy Whole-Slide Imaging Market Volume (K Unit) Forecast, by Application 2019 & 2032
- Table 29: Spain Whole-Slide Imaging Market Revenue (Million) Forecast, by Application 2019 & 2032
- Table 30: Spain Whole-Slide Imaging Market Volume (K Unit) Forecast, by Application 2019 & 2032
- Table 31: Rest of Europe Whole-Slide Imaging Market Revenue (Million) Forecast, by Application 2019 & 2032
- Table 32: Rest of Europe Whole-Slide Imaging Market Volume (K Unit) Forecast, by Application 2019 & 2032
- Table 33: Global Whole-Slide Imaging Market Revenue Million Forecast, by Country 2019 & 2032
- Table 34: Global Whole-Slide Imaging Market Volume K Unit Forecast, by Country 2019 & 2032
- Table 35: China Whole-Slide Imaging Market Revenue (Million) Forecast, by Application 2019 & 2032
- Table 36: China Whole-Slide Imaging Market Volume (K Unit) Forecast, by Application 2019 & 2032
- Table 37: Japan Whole-Slide Imaging Market Revenue (Million) Forecast, by Application 2019 & 2032
- Table 38: Japan Whole-Slide Imaging Market Volume (K Unit) Forecast, by Application 2019 & 2032
- Table 39: India Whole-Slide Imaging Market Revenue (Million) Forecast, by Application 2019 & 2032
- Table 40: India Whole-Slide Imaging Market Volume (K Unit) Forecast, by Application 2019 & 2032
- Table 41: Australia Whole-Slide Imaging Market Revenue (Million) Forecast, by Application 2019 & 2032
- Table 42: Australia Whole-Slide Imaging Market Volume (K Unit) Forecast, by Application 2019 & 2032
- Table 43: South korea Whole-Slide Imaging Market Revenue (Million) Forecast, by Application 2019 & 2032
- Table 44: South korea Whole-Slide Imaging Market Volume (K Unit) Forecast, by Application 2019 & 2032
- Table 45: Rest of Asia Pacific Whole-Slide Imaging Market Revenue (Million) Forecast, by Application 2019 & 2032
- Table 46: Rest of Asia Pacific Whole-Slide Imaging Market Volume (K Unit) Forecast, by Application 2019 & 2032
- Table 47: Global Whole-Slide Imaging Market Revenue Million Forecast, by Country 2019 & 2032
- Table 48: Global Whole-Slide Imaging Market Volume K Unit Forecast, by Country 2019 & 2032
- Table 49: GCC Whole-Slide Imaging Market Revenue (Million) Forecast, by Application 2019 & 2032
- Table 50: GCC Whole-Slide Imaging Market Volume (K Unit) Forecast, by Application 2019 & 2032
- Table 51: South Africa Whole-Slide Imaging Market Revenue (Million) Forecast, by Application 2019 & 2032
- Table 52: South Africa Whole-Slide Imaging Market Volume (K Unit) Forecast, by Application 2019 & 2032
- Table 53: Rest of Middle East and Africa Whole-Slide Imaging Market Revenue (Million) Forecast, by Application 2019 & 2032
- Table 54: Rest of Middle East and Africa Whole-Slide Imaging Market Volume (K Unit) Forecast, by Application 2019 & 2032
- Table 55: Global Whole-Slide Imaging Market Revenue Million Forecast, by Country 2019 & 2032
- Table 56: Global Whole-Slide Imaging Market Volume K Unit Forecast, by Country 2019 & 2032
- Table 57: Brazil Whole-Slide Imaging Market Revenue (Million) Forecast, by Application 2019 & 2032
- Table 58: Brazil Whole-Slide Imaging Market Volume (K Unit) Forecast, by Application 2019 & 2032
- Table 59: Argentina Whole-Slide Imaging Market Revenue (Million) Forecast, by Application 2019 & 2032
- Table 60: Argentina Whole-Slide Imaging Market Volume (K Unit) Forecast, by Application 2019 & 2032
- Table 61: Rest of South America Whole-Slide Imaging Market Revenue (Million) Forecast, by Application 2019 & 2032
- Table 62: Rest of South America Whole-Slide Imaging Market Volume (K Unit) Forecast, by Application 2019 & 2032
- Table 63: Global Whole-Slide Imaging Market Revenue Million Forecast, by Technology 2019 & 2032
- Table 64: Global Whole-Slide Imaging Market Volume K Unit Forecast, by Technology 2019 & 2032
- Table 65: Global Whole-Slide Imaging Market Revenue Million Forecast, by Application 2019 & 2032
- Table 66: Global Whole-Slide Imaging Market Volume K Unit Forecast, by Application 2019 & 2032
- Table 67: Global Whole-Slide Imaging Market Revenue Million Forecast, by End User 2019 & 2032
- Table 68: Global Whole-Slide Imaging Market Volume K Unit Forecast, by End User 2019 & 2032
- Table 69: Global Whole-Slide Imaging Market Revenue Million Forecast, by Country 2019 & 2032
- Table 70: Global Whole-Slide Imaging Market Volume K Unit Forecast, by Country 2019 & 2032
- Table 71: United States Whole-Slide Imaging Market Revenue (Million) Forecast, by Application 2019 & 2032
- Table 72: United States Whole-Slide Imaging Market Volume (K Unit) Forecast, by Application 2019 & 2032
- Table 73: Canada Whole-Slide Imaging Market Revenue (Million) Forecast, by Application 2019 & 2032
- Table 74: Canada Whole-Slide Imaging Market Volume (K Unit) Forecast, by Application 2019 & 2032
- Table 75: Mexico Whole-Slide Imaging Market Revenue (Million) Forecast, by Application 2019 & 2032
- Table 76: Mexico Whole-Slide Imaging Market Volume (K Unit) Forecast, by Application 2019 & 2032
- Table 77: Global Whole-Slide Imaging Market Revenue Million Forecast, by Technology 2019 & 2032
- Table 78: Global Whole-Slide Imaging Market Volume K Unit Forecast, by Technology 2019 & 2032
- Table 79: Global Whole-Slide Imaging Market Revenue Million Forecast, by Application 2019 & 2032
- Table 80: Global Whole-Slide Imaging Market Volume K Unit Forecast, by Application 2019 & 2032
- Table 81: Global Whole-Slide Imaging Market Revenue Million Forecast, by End User 2019 & 2032
- Table 82: Global Whole-Slide Imaging Market Volume K Unit Forecast, by End User 2019 & 2032
- Table 83: Global Whole-Slide Imaging Market Revenue Million Forecast, by Country 2019 & 2032
- Table 84: Global Whole-Slide Imaging Market Volume K Unit Forecast, by Country 2019 & 2032
- Table 85: Germany Whole-Slide Imaging Market Revenue (Million) Forecast, by Application 2019 & 2032
- Table 86: Germany Whole-Slide Imaging Market Volume (K Unit) Forecast, by Application 2019 & 2032
- Table 87: United Kingdom Whole-Slide Imaging Market Revenue (Million) Forecast, by Application 2019 & 2032
- Table 88: United Kingdom Whole-Slide Imaging Market Volume (K Unit) Forecast, by Application 2019 & 2032
- Table 89: France Whole-Slide Imaging Market Revenue (Million) Forecast, by Application 2019 & 2032
- Table 90: France Whole-Slide Imaging Market Volume (K Unit) Forecast, by Application 2019 & 2032
- Table 91: Italy Whole-Slide Imaging Market Revenue (Million) Forecast, by Application 2019 & 2032
- Table 92: Italy Whole-Slide Imaging Market Volume (K Unit) Forecast, by Application 2019 & 2032
- Table 93: Spain Whole-Slide Imaging Market Revenue (Million) Forecast, by Application 2019 & 2032
- Table 94: Spain Whole-Slide Imaging Market Volume (K Unit) Forecast, by Application 2019 & 2032
- Table 95: Rest of Europe Whole-Slide Imaging Market Revenue (Million) Forecast, by Application 2019 & 2032
- Table 96: Rest of Europe Whole-Slide Imaging Market Volume (K Unit) Forecast, by Application 2019 & 2032
- Table 97: Global Whole-Slide Imaging Market Revenue Million Forecast, by Technology 2019 & 2032
- Table 98: Global Whole-Slide Imaging Market Volume K Unit Forecast, by Technology 2019 & 2032
- Table 99: Global Whole-Slide Imaging Market Revenue Million Forecast, by Application 2019 & 2032
- Table 100: Global Whole-Slide Imaging Market Volume K Unit Forecast, by Application 2019 & 2032
- Table 101: Global Whole-Slide Imaging Market Revenue Million Forecast, by End User 2019 & 2032
- Table 102: Global Whole-Slide Imaging Market Volume K Unit Forecast, by End User 2019 & 2032
- Table 103: Global Whole-Slide Imaging Market Revenue Million Forecast, by Country 2019 & 2032
- Table 104: Global Whole-Slide Imaging Market Volume K Unit Forecast, by Country 2019 & 2032
- Table 105: China Whole-Slide Imaging Market Revenue (Million) Forecast, by Application 2019 & 2032
- Table 106: China Whole-Slide Imaging Market Volume (K Unit) Forecast, by Application 2019 & 2032
- Table 107: Japan Whole-Slide Imaging Market Revenue (Million) Forecast, by Application 2019 & 2032
- Table 108: Japan Whole-Slide Imaging Market Volume (K Unit) Forecast, by Application 2019 & 2032
- Table 109: India Whole-Slide Imaging Market Revenue (Million) Forecast, by Application 2019 & 2032
- Table 110: India Whole-Slide Imaging Market Volume (K Unit) Forecast, by Application 2019 & 2032
- Table 111: Australia Whole-Slide Imaging Market Revenue (Million) Forecast, by Application 2019 & 2032
- Table 112: Australia Whole-Slide Imaging Market Volume (K Unit) Forecast, by Application 2019 & 2032
- Table 113: South korea Whole-Slide Imaging Market Revenue (Million) Forecast, by Application 2019 & 2032
- Table 114: South korea Whole-Slide Imaging Market Volume (K Unit) Forecast, by Application 2019 & 2032
- Table 115: Rest of Asia Pacific Whole-Slide Imaging Market Revenue (Million) Forecast, by Application 2019 & 2032
- Table 116: Rest of Asia Pacific Whole-Slide Imaging Market Volume (K Unit) Forecast, by Application 2019 & 2032
- Table 117: Global Whole-Slide Imaging Market Revenue Million Forecast, by Technology 2019 & 2032
- Table 118: Global Whole-Slide Imaging Market Volume K Unit Forecast, by Technology 2019 & 2032
- Table 119: Global Whole-Slide Imaging Market Revenue Million Forecast, by Application 2019 & 2032
- Table 120: Global Whole-Slide Imaging Market Volume K Unit Forecast, by Application 2019 & 2032
- Table 121: Global Whole-Slide Imaging Market Revenue Million Forecast, by End User 2019 & 2032
- Table 122: Global Whole-Slide Imaging Market Volume K Unit Forecast, by End User 2019 & 2032
- Table 123: Global Whole-Slide Imaging Market Revenue Million Forecast, by Country 2019 & 2032
- Table 124: Global Whole-Slide Imaging Market Volume K Unit Forecast, by Country 2019 & 2032
- Table 125: GCC Whole-Slide Imaging Market Revenue (Million) Forecast, by Application 2019 & 2032
- Table 126: GCC Whole-Slide Imaging Market Volume (K Unit) Forecast, by Application 2019 & 2032
- Table 127: South Africa Whole-Slide Imaging Market Revenue (Million) Forecast, by Application 2019 & 2032
- Table 128: South Africa Whole-Slide Imaging Market Volume (K Unit) Forecast, by Application 2019 & 2032
- Table 129: Rest of Middle East and Africa Whole-Slide Imaging Market Revenue (Million) Forecast, by Application 2019 & 2032
- Table 130: Rest of Middle East and Africa Whole-Slide Imaging Market Volume (K Unit) Forecast, by Application 2019 & 2032
- Table 131: Global Whole-Slide Imaging Market Revenue Million Forecast, by Technology 2019 & 2032
- Table 132: Global Whole-Slide Imaging Market Volume K Unit Forecast, by Technology 2019 & 2032
- Table 133: Global Whole-Slide Imaging Market Revenue Million Forecast, by Application 2019 & 2032
- Table 134: Global Whole-Slide Imaging Market Volume K Unit Forecast, by Application 2019 & 2032
- Table 135: Global Whole-Slide Imaging Market Revenue Million Forecast, by End User 2019 & 2032
- Table 136: Global Whole-Slide Imaging Market Volume K Unit Forecast, by End User 2019 & 2032
- Table 137: Global Whole-Slide Imaging Market Revenue Million Forecast, by Country 2019 & 2032
- Table 138: Global Whole-Slide Imaging Market Volume K Unit Forecast, by Country 2019 & 2032
- Table 139: Brazil Whole-Slide Imaging Market Revenue (Million) Forecast, by Application 2019 & 2032
- Table 140: Brazil Whole-Slide Imaging Market Volume (K Unit) Forecast, by Application 2019 & 2032
- Table 141: Argentina Whole-Slide Imaging Market Revenue (Million) Forecast, by Application 2019 & 2032
- Table 142: Argentina Whole-Slide Imaging Market Volume (K Unit) Forecast, by Application 2019 & 2032
- Table 143: Rest of South America Whole-Slide Imaging Market Revenue (Million) Forecast, by Application 2019 & 2032
- Table 144: Rest of South America Whole-Slide Imaging Market Volume (K Unit) Forecast, by Application 2019 & 2032
Frequently Asked Questions
1. What is the projected Compound Annual Growth Rate (CAGR) of the Whole-Slide Imaging Market?
The projected CAGR is approximately 6.39%.
2. Which companies are prominent players in the Whole-Slide Imaging Market?
Key companies in the market include MBF Bioscience, Hamamatsu Photonics KK, Nikon Corporation, Leica Microsystems GmbH, Koninklijke Philips N V, 3Dhistech, Visiopharm, Indica Labs, Molecular Machines & Industries, Mikroscan Technologies Inc, Olympus Corporation, Akoya Biosciences.
3. What are the main segments of the Whole-Slide Imaging Market?
The market segments include Technology, Application, End User.
4. Can you provide details about the market size?
The market size is estimated to be USD 1.21 Million as of 2022.
5. What are some drivers contributing to market growth?
Growing Popularity of Virtual Slides as Compared to Physical Slides; Technological Advancements in Whole Slide Imaging; Increasing Research in Drug Discovery.
6. What are the notable trends driving market growth?
Telepathology Segment is Expected to Grow Significantly Over the Forecast Period.
7. Are there any restraints impacting market growth?
Stringent Regulatory Approvals; High Cost of Whole Slide Imaging Systems.
8. Can you provide examples of recent developments in the market?
March 2023: Pramana, Inc., an AI-enabled health tech company modernizing the pathology sector, collaborated with PathPresenter to accelerate the enterprise adoption of digital pathology workflows. The goal of this collaboration is to ensure a seamless user experience for the labs adopting Pramana's Digital Pathology as a Service solution for whole slide image generation, as well as PathPresenter's image management/image viewing platform.
9. What pricing options are available for accessing the report?
Pricing options include single-user, multi-user, and enterprise licenses priced at USD 4750, USD 5250, and USD 8750 respectively.
10. Is the market size provided in terms of value or volume?
The market size is provided in terms of value, measured in Million and volume, measured in K Unit.
11. Are there any specific market keywords associated with the report?
Yes, the market keyword associated with the report is "Whole-Slide Imaging Market," which aids in identifying and referencing the specific market segment covered.
12. How do I determine which pricing option suits my needs best?
The pricing options vary based on user requirements and access needs. Individual users may opt for single-user licenses, while businesses requiring broader access may choose multi-user or enterprise licenses for cost-effective access to the report.
13. Are there any additional resources or data provided in the Whole-Slide Imaging Market report?
While the report offers comprehensive insights, it's advisable to review the specific contents or supplementary materials provided to ascertain if additional resources or data are available.
14. How can I stay updated on further developments or reports in the Whole-Slide Imaging Market?
To stay informed about further developments, trends, and reports in the Whole-Slide Imaging Market, consider subscribing to industry newsletters, following relevant companies and organizations, or regularly checking reputable industry news sources and publications.
Methodology
Step 1 - Identification of Relevant Samples Size from Population Database


Step 2 - Approaches for Defining Global Market Size (Value, Volume* & Price*)

Note*: In applicable scenarios
Step 3 - Data Sources
Primary Research
- Web Analytics
- Survey Reports
- Research Institute
- Latest Research Reports
- Opinion Leaders
Secondary Research
- Annual Reports
- White Paper
- Latest Press Release
- Industry Association
- Paid Database
- Investor Presentations

Step 4 - Data Triangulation
Involves using different sources of information in order to increase the validity of a study
These sources are likely to be stakeholders in a program - participants, other researchers, program staff, other community members, and so on.
Then we put all data in single framework & apply various statistical tools to find out the dynamic on the market.
During the analysis stage, feedback from the stakeholder groups would be compared to determine areas of agreement as well as areas of divergence
