

Key Insights
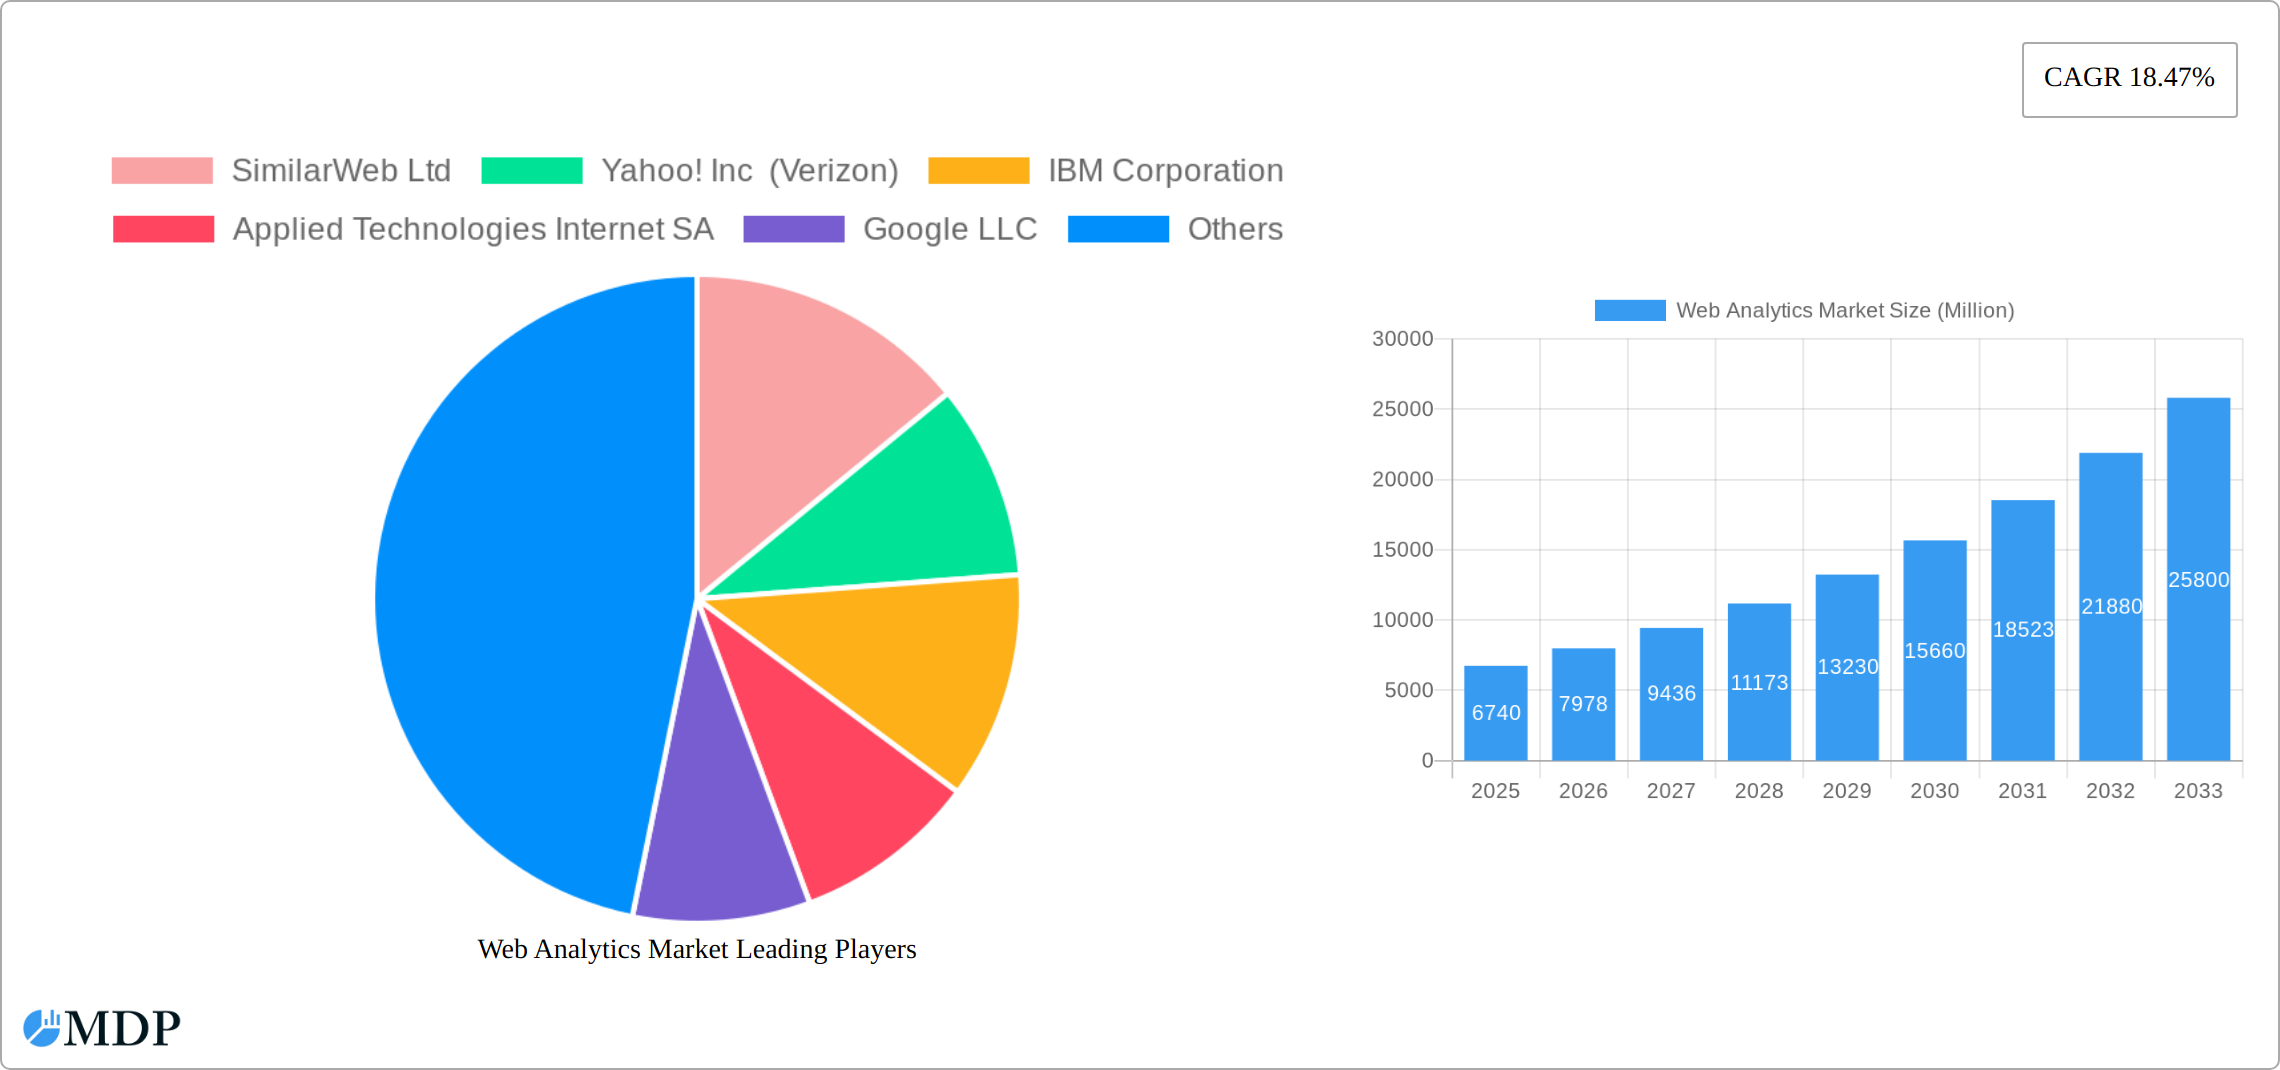
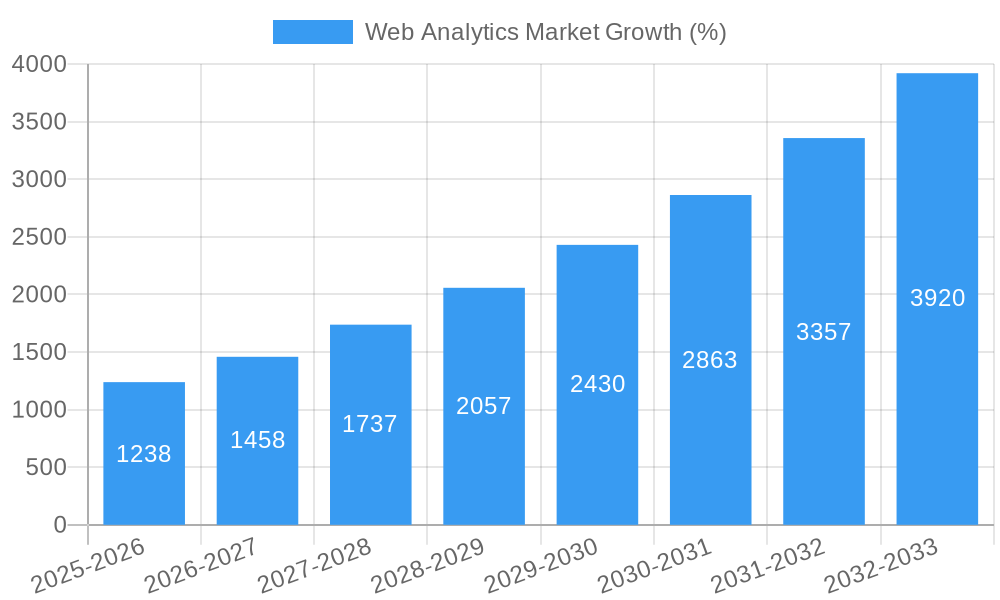
The global web analytics market, valued at $6.74 billion in 2025, is projected to experience robust growth, driven by the increasing adoption of digital marketing strategies across diverse industries. A compound annual growth rate (CAGR) of 18.47% from 2025 to 2033 signifies a significant expansion, fueled by several key factors. The rising need for data-driven decision-making in businesses, coupled with the proliferation of mobile devices and the increasing sophistication of online marketing campaigns, are major contributors to this growth. Businesses across sectors, including retail, manufacturing, IT, BFSI (Banking, Financial Services, and Insurance), healthcare, and transportation & logistics, are increasingly relying on web analytics to understand customer behavior, optimize marketing spend, and enhance overall business performance. The diverse application segments, encompassing online marketing automation, mobile analytics, content marketing, social media management, email marketing, and advanced analytics like targeting and behavioral analysis, further contribute to the market's dynamism. Competition is fierce, with established players like Google, Adobe, and IBM alongside emerging technology companies vying for market share. Geographic expansion, particularly in rapidly developing economies of Asia-Pacific, is another critical factor driving market expansion.
While the market presents significant opportunities, challenges remain. Data privacy concerns and the increasing complexity of integrating various web analytics tools could potentially hinder growth. Furthermore, the need for skilled professionals to effectively interpret and leverage web analytics data poses a significant hurdle for smaller companies. However, the continuous innovation in web analytics technologies and the development of user-friendly platforms are expected to mitigate these challenges to some extent. The market's future trajectory hinges on ongoing technological advancements, increasing digital adoption across industries, and the successful resolution of data privacy concerns. Strategic partnerships and acquisitions among market players are expected to further shape the competitive landscape in the coming years.
Web Analytics Market Report: 2019-2033 Forecast
This comprehensive report provides an in-depth analysis of the Web Analytics Market, projecting robust growth from $xx Million in 2025 to $xx Million by 2033, exhibiting a CAGR of xx%. This report covers the period 2019-2033, with 2025 as the base year and estimated year. It examines market dynamics, leading players (including SimilarWeb Ltd, Yahoo! Inc (Verizon), IBM Corporation, Applied Technologies Internet SA, Google LLC, Teradata Corporation, MicroStrategy Incorporated, Adobe Systems Incorporated, SAS Institute, Webtrends Inc, comScore Inc, Microsoft Inc, Facebook Inc, Hootsuite Inc, Splunk Inc, Tableau Software (Salesforce com Inc )), key segments, and emerging opportunities, offering invaluable insights for stakeholders.
Web Analytics Market Market Dynamics & Concentration
The Web Analytics Market is experiencing significant growth fueled by increasing digitalization and the need for data-driven decision-making across various industries. Market concentration is moderate, with several major players holding substantial shares, but a considerable number of smaller niche players also contribute. Innovation is a key driver, with continuous advancements in AI, machine learning, and big data analytics enhancing the capabilities of web analytics tools. Regulatory frameworks, such as GDPR and CCPA, are shaping data privacy practices and impacting market dynamics. Product substitutes, such as traditional market research methods, are becoming less prevalent as the advantages of web analytics become increasingly apparent. End-user trends indicate a growing preference for integrated platforms offering comprehensive data visualization and actionable insights.
M&A activity is relatively frequent, with larger players acquiring smaller companies to expand their product portfolios and market reach. While precise figures aren’t readily available for the exact number of M&A deals, we predict it in the range of xx per year between 2019-2024. Google, Adobe, and Microsoft hold significant market share, estimated to be between xx% and xx% collectively.
Web Analytics Market Industry Trends & Analysis
The Web Analytics Market is characterized by strong growth, driven by several key factors. The increasing adoption of digital marketing strategies across industries is a major catalyst. Businesses are leveraging web analytics to optimize their online presence, personalize user experiences, and measure campaign effectiveness. Technological advancements, particularly in AI and machine learning, are enhancing the accuracy and sophistication of web analytics tools. Consumers are increasingly comfortable sharing their data online, creating a vast pool of information that businesses can utilize for analytical purposes. The competitive landscape is dynamic, with existing players constantly innovating and new entrants emerging. This competitive pressure drives innovation and enhances the overall value proposition for users. The market is witnessing a shift towards cloud-based solutions, offering scalability, cost-effectiveness, and accessibility. This transition is significantly impacting market penetration, with cloud-based solutions rapidly gaining adoption. The market is expected to maintain a robust growth trajectory, with a projected CAGR of xx% during the forecast period (2025-2033), driven by continued technological advancements and increasing adoption across diverse sectors.
Leading Markets & Segments in Web Analytics Market
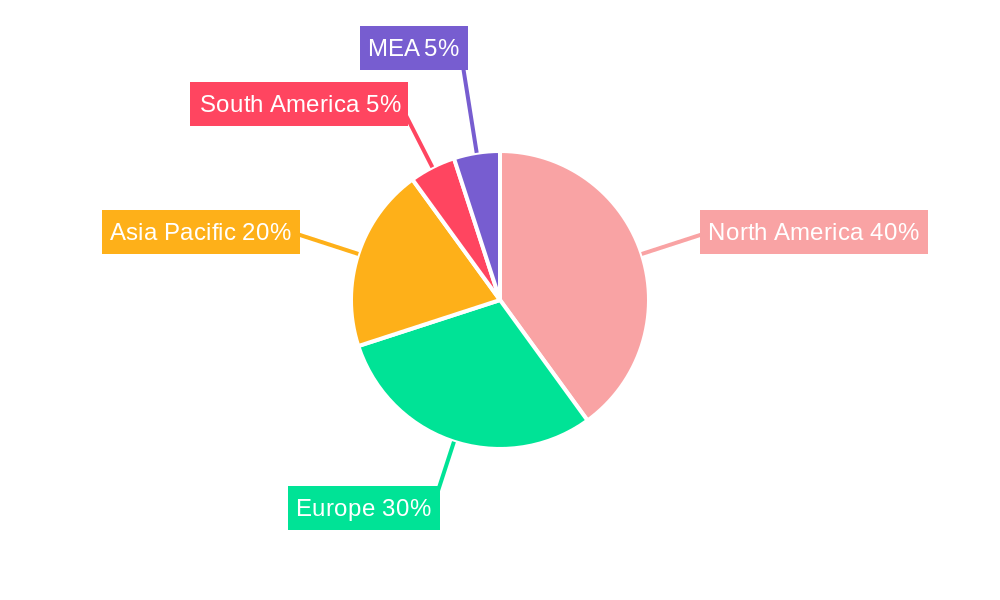
The North American region currently holds the dominant position in the Web Analytics Market, driven by high digital adoption rates, advanced technological infrastructure, and the presence of major players. Within this region, the United States displays the most significant market share.
By Offering: The solutions segment commands a larger market share compared to the services segment due to the increasing demand for comprehensive web analytics platforms.
By End-User Vertical: The Retail sector is the leading end-user vertical, followed by Information Technology, Banking, Financial Services, and Insurance. This dominance stems from these sectors' heavy reliance on online platforms for business operations and customer engagement. The high adoption of e-commerce and the importance of online customer experiences drive substantial investments in web analytics.
By Application: Online Marketing & Marketing Automation is the leading application segment, driven by the growing need for data-driven marketing strategies. Mobile Analytics is experiencing rapid growth due to the increasing use of mobile devices.
Key drivers within these leading segments include:
- Robust economic growth: Strong economies translate into higher investments in digital technologies, fueling demand for web analytics.
- Advanced digital infrastructure: Reliable internet connectivity and advanced IT infrastructure facilitate the seamless deployment and use of web analytics tools.
- Favorable government policies: Supportive regulatory environments and investment incentives promote technological innovation and market growth.
Web Analytics Market Product Developments
Recent product innovations focus on enhancing data visualization capabilities, integrating AI-powered insights, and providing more comprehensive cross-channel analytics. These advancements deliver better decision-making capabilities and increased ROI for businesses. The market is witnessing the emergence of solutions that integrate web analytics with marketing automation, customer relationship management (CRM), and other business intelligence tools. This integration provides a holistic view of customer behavior and business performance, unlocking new opportunities for growth.
Key Drivers of Web Analytics Market Growth
Technological advancements such as AI and machine learning are significantly improving the accuracy and sophistication of web analytics. Economic factors, particularly the increasing digitalization of businesses, are driving the demand for web analytics solutions. Regulatory changes related to data privacy are shaping market practices and influencing product development. For example, the growing adoption of GDPR and CCPA influences the need for compliant solutions.
Challenges in the Web Analytics Market Market
Data privacy concerns and regulations create significant challenges for the market. The complexity of integrating different web analytics tools can hinder adoption, and the high cost of some solutions can restrict access for smaller businesses. Competition is intense, and new entrants constantly challenge established players. This competitive pressure requires businesses to adapt rapidly and ensure market leadership.
Emerging Opportunities in Web Analytics Market
The integration of web analytics with emerging technologies such as the Internet of Things (IoT) and blockchain presents significant growth opportunities. Strategic partnerships between analytics providers and other technology companies can unlock new markets and value propositions. Expansion into developing markets with growing internet penetration offers significant potential for future growth.
Leading Players in the Web Analytics Market Sector
- SimilarWeb Ltd
- Yahoo! Inc (Verizon)
- IBM Corporation
- Applied Technologies Internet SA
- Google LLC
- Teradata Corporation
- MicroStrategy Incorporated
- Adobe Systems Incorporated
- SAS Institute
- Webtrends Inc
- comScore Inc
- Microsoft Inc
- Facebook Inc
- Hootsuite Inc
- Splunk Inc
- Tableau Software (Salesforce com Inc )
Key Milestones in Web Analytics Market Industry
- March 2023: Datajoin announces Digital Analytics Integrations for Adobe Analytics and Google Analytics, extending the reach of web analytics beyond website metrics to encompass customer acquisition.
- February 2023: das42 earns Google Cloud Partner Advantage Data Analytics Services Partner specialization, demonstrating expertise in leveraging Google Cloud technology for data analytics solutions.
Strategic Outlook for Web Analytics Market Market
The future of the Web Analytics Market is bright, with continued growth driven by technological advancements, increasing digitalization, and expanding adoption across diverse sectors. Strategic partnerships, expansion into new markets, and the development of innovative solutions will be crucial for success in this competitive landscape. The market offers significant potential for businesses to leverage data-driven insights for improved efficiency, enhanced customer experiences, and optimized marketing campaigns.
Web Analytics Market Segmentation
-
1. Application
- 1.1. Online Marketing & Marketing Automation
- 1.2. Mobile Analytics
- 1.3. Content Marketing
- 1.4. Social Media Management
- 1.5. E-mail Marketing
- 1.6. Other Ap
-
2. Offering
- 2.1. Solution
- 2.2. Services
-
3. End-User Vertical
- 3.1. Retail
- 3.2. Manufacturing
- 3.3. Information Technology
- 3.4. Banking, Financial Services, and Insurance
- 3.5. Healthcare
- 3.6. Transportation and Logistics
- 3.7. Other End-User Verticals
Web Analytics Market Segmentation By Geography
- 1. North America
- 2. Europe
- 3. Asia
- 4. Australia and New Zealand
- 5. Latin America
- 6. Middle East and Africa
Web Analytics Market REPORT HIGHLIGHTS
| Aspects | Details |
|---|---|
| Study Period | 2019-2033 |
| Base Year | 2024 |
| Estimated Year | 2025 |
| Forecast Period | 2025-2033 |
| Historical Period | 2019-2024 |
| Growth Rate | CAGR of 18.47% from 2019-2033 |
| Segmentation |
|
Table of Contents
- 1. Introduction
- 1.1. Research Scope
- 1.2. Market Segmentation
- 1.3. Research Methodology
- 1.4. Definitions and Assumptions
- 2. Executive Summary
- 2.1. Introduction
- 3. Market Dynamics
- 3.1. Introduction
- 3.2. Market Drivers
- 3.2.1. Growing Demand for Online Shopping Trends; Growing Importance of Mobile Analytics Solutions
- 3.3. Market Restrains
- 3.3.1. Rigid Government Regulations and Data Privacy Regulations Compliance
- 3.4. Market Trends
- 3.4.1. Growing Demand for Online Shopping Trends is Expected to Drives the Market Growth
- 4. Market Factor Analysis
- 4.1. Porters Five Forces
- 4.2. Supply/Value Chain
- 4.3. PESTEL analysis
- 4.4. Market Entropy
- 4.5. Patent/Trademark Analysis
- 5. Global Web Analytics Market Analysis, Insights and Forecast, 2019-2031
- 5.1. Market Analysis, Insights and Forecast - by Application
- 5.1.1. Online Marketing & Marketing Automation
- 5.1.2. Mobile Analytics
- 5.1.3. Content Marketing
- 5.1.4. Social Media Management
- 5.1.5. E-mail Marketing
- 5.1.6. Other Ap
- 5.2. Market Analysis, Insights and Forecast - by Offering
- 5.2.1. Solution
- 5.2.2. Services
- 5.3. Market Analysis, Insights and Forecast - by End-User Vertical
- 5.3.1. Retail
- 5.3.2. Manufacturing
- 5.3.3. Information Technology
- 5.3.4. Banking, Financial Services, and Insurance
- 5.3.5. Healthcare
- 5.3.6. Transportation and Logistics
- 5.3.7. Other End-User Verticals
- 5.4. Market Analysis, Insights and Forecast - by Region
- 5.4.1. North America
- 5.4.2. Europe
- 5.4.3. Asia
- 5.4.4. Australia and New Zealand
- 5.4.5. Latin America
- 5.4.6. Middle East and Africa
- 5.1. Market Analysis, Insights and Forecast - by Application
- 6. North America Web Analytics Market Analysis, Insights and Forecast, 2019-2031
- 6.1. Market Analysis, Insights and Forecast - by Application
- 6.1.1. Online Marketing & Marketing Automation
- 6.1.2. Mobile Analytics
- 6.1.3. Content Marketing
- 6.1.4. Social Media Management
- 6.1.5. E-mail Marketing
- 6.1.6. Other Ap
- 6.2. Market Analysis, Insights and Forecast - by Offering
- 6.2.1. Solution
- 6.2.2. Services
- 6.3. Market Analysis, Insights and Forecast - by End-User Vertical
- 6.3.1. Retail
- 6.3.2. Manufacturing
- 6.3.3. Information Technology
- 6.3.4. Banking, Financial Services, and Insurance
- 6.3.5. Healthcare
- 6.3.6. Transportation and Logistics
- 6.3.7. Other End-User Verticals
- 6.1. Market Analysis, Insights and Forecast - by Application
- 7. Europe Web Analytics Market Analysis, Insights and Forecast, 2019-2031
- 7.1. Market Analysis, Insights and Forecast - by Application
- 7.1.1. Online Marketing & Marketing Automation
- 7.1.2. Mobile Analytics
- 7.1.3. Content Marketing
- 7.1.4. Social Media Management
- 7.1.5. E-mail Marketing
- 7.1.6. Other Ap
- 7.2. Market Analysis, Insights and Forecast - by Offering
- 7.2.1. Solution
- 7.2.2. Services
- 7.3. Market Analysis, Insights and Forecast - by End-User Vertical
- 7.3.1. Retail
- 7.3.2. Manufacturing
- 7.3.3. Information Technology
- 7.3.4. Banking, Financial Services, and Insurance
- 7.3.5. Healthcare
- 7.3.6. Transportation and Logistics
- 7.3.7. Other End-User Verticals
- 7.1. Market Analysis, Insights and Forecast - by Application
- 8. Asia Web Analytics Market Analysis, Insights and Forecast, 2019-2031
- 8.1. Market Analysis, Insights and Forecast - by Application
- 8.1.1. Online Marketing & Marketing Automation
- 8.1.2. Mobile Analytics
- 8.1.3. Content Marketing
- 8.1.4. Social Media Management
- 8.1.5. E-mail Marketing
- 8.1.6. Other Ap
- 8.2. Market Analysis, Insights and Forecast - by Offering
- 8.2.1. Solution
- 8.2.2. Services
- 8.3. Market Analysis, Insights and Forecast - by End-User Vertical
- 8.3.1. Retail
- 8.3.2. Manufacturing
- 8.3.3. Information Technology
- 8.3.4. Banking, Financial Services, and Insurance
- 8.3.5. Healthcare
- 8.3.6. Transportation and Logistics
- 8.3.7. Other End-User Verticals
- 8.1. Market Analysis, Insights and Forecast - by Application
- 9. Australia and New Zealand Web Analytics Market Analysis, Insights and Forecast, 2019-2031
- 9.1. Market Analysis, Insights and Forecast - by Application
- 9.1.1. Online Marketing & Marketing Automation
- 9.1.2. Mobile Analytics
- 9.1.3. Content Marketing
- 9.1.4. Social Media Management
- 9.1.5. E-mail Marketing
- 9.1.6. Other Ap
- 9.2. Market Analysis, Insights and Forecast - by Offering
- 9.2.1. Solution
- 9.2.2. Services
- 9.3. Market Analysis, Insights and Forecast - by End-User Vertical
- 9.3.1. Retail
- 9.3.2. Manufacturing
- 9.3.3. Information Technology
- 9.3.4. Banking, Financial Services, and Insurance
- 9.3.5. Healthcare
- 9.3.6. Transportation and Logistics
- 9.3.7. Other End-User Verticals
- 9.1. Market Analysis, Insights and Forecast - by Application
- 10. Latin America Web Analytics Market Analysis, Insights and Forecast, 2019-2031
- 10.1. Market Analysis, Insights and Forecast - by Application
- 10.1.1. Online Marketing & Marketing Automation
- 10.1.2. Mobile Analytics
- 10.1.3. Content Marketing
- 10.1.4. Social Media Management
- 10.1.5. E-mail Marketing
- 10.1.6. Other Ap
- 10.2. Market Analysis, Insights and Forecast - by Offering
- 10.2.1. Solution
- 10.2.2. Services
- 10.3. Market Analysis, Insights and Forecast - by End-User Vertical
- 10.3.1. Retail
- 10.3.2. Manufacturing
- 10.3.3. Information Technology
- 10.3.4. Banking, Financial Services, and Insurance
- 10.3.5. Healthcare
- 10.3.6. Transportation and Logistics
- 10.3.7. Other End-User Verticals
- 10.1. Market Analysis, Insights and Forecast - by Application
- 11. Middle East and Africa Web Analytics Market Analysis, Insights and Forecast, 2019-2031
- 11.1. Market Analysis, Insights and Forecast - by Application
- 11.1.1. Online Marketing & Marketing Automation
- 11.1.2. Mobile Analytics
- 11.1.3. Content Marketing
- 11.1.4. Social Media Management
- 11.1.5. E-mail Marketing
- 11.1.6. Other Ap
- 11.2. Market Analysis, Insights and Forecast - by Offering
- 11.2.1. Solution
- 11.2.2. Services
- 11.3. Market Analysis, Insights and Forecast - by End-User Vertical
- 11.3.1. Retail
- 11.3.2. Manufacturing
- 11.3.3. Information Technology
- 11.3.4. Banking, Financial Services, and Insurance
- 11.3.5. Healthcare
- 11.3.6. Transportation and Logistics
- 11.3.7. Other End-User Verticals
- 11.1. Market Analysis, Insights and Forecast - by Application
- 12. North America Web Analytics Market Analysis, Insights and Forecast, 2019-2031
- 12.1. Market Analysis, Insights and Forecast - By Country/Sub-region
- 12.1.1 United States
- 12.1.2 Canada
- 12.1.3 Mexico
- 13. Europe Web Analytics Market Analysis, Insights and Forecast, 2019-2031
- 13.1. Market Analysis, Insights and Forecast - By Country/Sub-region
- 13.1.1 Germany
- 13.1.2 United Kingdom
- 13.1.3 France
- 13.1.4 Spain
- 13.1.5 Italy
- 13.1.6 Spain
- 13.1.7 Belgium
- 13.1.8 Netherland
- 13.1.9 Nordics
- 13.1.10 Rest of Europe
- 14. Asia Pacific Web Analytics Market Analysis, Insights and Forecast, 2019-2031
- 14.1. Market Analysis, Insights and Forecast - By Country/Sub-region
- 14.1.1 China
- 14.1.2 Japan
- 14.1.3 India
- 14.1.4 South Korea
- 14.1.5 Southeast Asia
- 14.1.6 Australia
- 14.1.7 Indonesia
- 14.1.8 Phillipes
- 14.1.9 Singapore
- 14.1.10 Thailandc
- 14.1.11 Rest of Asia Pacific
- 15. South America Web Analytics Market Analysis, Insights and Forecast, 2019-2031
- 15.1. Market Analysis, Insights and Forecast - By Country/Sub-region
- 15.1.1 Brazil
- 15.1.2 Argentina
- 15.1.3 Peru
- 15.1.4 Chile
- 15.1.5 Colombia
- 15.1.6 Ecuador
- 15.1.7 Venezuela
- 15.1.8 Rest of South America
- 16. North America Web Analytics Market Analysis, Insights and Forecast, 2019-2031
- 16.1. Market Analysis, Insights and Forecast - By Country/Sub-region
- 16.1.1 United States
- 16.1.2 Canada
- 16.1.3 Mexico
- 17. MEA Web Analytics Market Analysis, Insights and Forecast, 2019-2031
- 17.1. Market Analysis, Insights and Forecast - By Country/Sub-region
- 17.1.1 United Arab Emirates
- 17.1.2 Saudi Arabia
- 17.1.3 South Africa
- 17.1.4 Rest of Middle East and Africa
- 18. Competitive Analysis
- 18.1. Global Market Share Analysis 2024
- 18.2. Company Profiles
- 18.2.1 SimilarWeb Ltd
- 18.2.1.1. Overview
- 18.2.1.2. Products
- 18.2.1.3. SWOT Analysis
- 18.2.1.4. Recent Developments
- 18.2.1.5. Financials (Based on Availability)
- 18.2.2 Yahoo! Inc (Verizon)
- 18.2.2.1. Overview
- 18.2.2.2. Products
- 18.2.2.3. SWOT Analysis
- 18.2.2.4. Recent Developments
- 18.2.2.5. Financials (Based on Availability)
- 18.2.3 IBM Corporation
- 18.2.3.1. Overview
- 18.2.3.2. Products
- 18.2.3.3. SWOT Analysis
- 18.2.3.4. Recent Developments
- 18.2.3.5. Financials (Based on Availability)
- 18.2.4 Applied Technologies Internet SA
- 18.2.4.1. Overview
- 18.2.4.2. Products
- 18.2.4.3. SWOT Analysis
- 18.2.4.4. Recent Developments
- 18.2.4.5. Financials (Based on Availability)
- 18.2.5 Google LLC
- 18.2.5.1. Overview
- 18.2.5.2. Products
- 18.2.5.3. SWOT Analysis
- 18.2.5.4. Recent Developments
- 18.2.5.5. Financials (Based on Availability)
- 18.2.6 Teradata Corporation
- 18.2.6.1. Overview
- 18.2.6.2. Products
- 18.2.6.3. SWOT Analysis
- 18.2.6.4. Recent Developments
- 18.2.6.5. Financials (Based on Availability)
- 18.2.7 MicroStrategy Incorporated
- 18.2.7.1. Overview
- 18.2.7.2. Products
- 18.2.7.3. SWOT Analysis
- 18.2.7.4. Recent Developments
- 18.2.7.5. Financials (Based on Availability)
- 18.2.8 Adobe Systems Incorporated
- 18.2.8.1. Overview
- 18.2.8.2. Products
- 18.2.8.3. SWOT Analysis
- 18.2.8.4. Recent Developments
- 18.2.8.5. Financials (Based on Availability)
- 18.2.9 SAS Institute
- 18.2.9.1. Overview
- 18.2.9.2. Products
- 18.2.9.3. SWOT Analysis
- 18.2.9.4. Recent Developments
- 18.2.9.5. Financials (Based on Availability)
- 18.2.10 Webtrends Inc
- 18.2.10.1. Overview
- 18.2.10.2. Products
- 18.2.10.3. SWOT Analysis
- 18.2.10.4. Recent Developments
- 18.2.10.5. Financials (Based on Availability)
- 18.2.11 comScore Inc
- 18.2.11.1. Overview
- 18.2.11.2. Products
- 18.2.11.3. SWOT Analysis
- 18.2.11.4. Recent Developments
- 18.2.11.5. Financials (Based on Availability)
- 18.2.12 Microsoft Inc
- 18.2.12.1. Overview
- 18.2.12.2. Products
- 18.2.12.3. SWOT Analysis
- 18.2.12.4. Recent Developments
- 18.2.12.5. Financials (Based on Availability)
- 18.2.13 Facebook Inc
- 18.2.13.1. Overview
- 18.2.13.2. Products
- 18.2.13.3. SWOT Analysis
- 18.2.13.4. Recent Developments
- 18.2.13.5. Financials (Based on Availability)
- 18.2.14 Hootsuite Inc
- 18.2.14.1. Overview
- 18.2.14.2. Products
- 18.2.14.3. SWOT Analysis
- 18.2.14.4. Recent Developments
- 18.2.14.5. Financials (Based on Availability)
- 18.2.15 Splunk Inc
- 18.2.15.1. Overview
- 18.2.15.2. Products
- 18.2.15.3. SWOT Analysis
- 18.2.15.4. Recent Developments
- 18.2.15.5. Financials (Based on Availability)
- 18.2.16 Tableau Software (Salesforce com Inc )
- 18.2.16.1. Overview
- 18.2.16.2. Products
- 18.2.16.3. SWOT Analysis
- 18.2.16.4. Recent Developments
- 18.2.16.5. Financials (Based on Availability)
- 18.2.1 SimilarWeb Ltd
List of Figures
- Figure 1: Global Web Analytics Market Revenue Breakdown (Million, %) by Region 2024 & 2032
- Figure 2: Global Web Analytics Market Volume Breakdown (K Unit, %) by Region 2024 & 2032
- Figure 3: North America Web Analytics Market Revenue (Million), by Country 2024 & 2032
- Figure 4: North America Web Analytics Market Volume (K Unit), by Country 2024 & 2032
- Figure 5: North America Web Analytics Market Revenue Share (%), by Country 2024 & 2032
- Figure 6: North America Web Analytics Market Volume Share (%), by Country 2024 & 2032
- Figure 7: Europe Web Analytics Market Revenue (Million), by Country 2024 & 2032
- Figure 8: Europe Web Analytics Market Volume (K Unit), by Country 2024 & 2032
- Figure 9: Europe Web Analytics Market Revenue Share (%), by Country 2024 & 2032
- Figure 10: Europe Web Analytics Market Volume Share (%), by Country 2024 & 2032
- Figure 11: Asia Pacific Web Analytics Market Revenue (Million), by Country 2024 & 2032
- Figure 12: Asia Pacific Web Analytics Market Volume (K Unit), by Country 2024 & 2032
- Figure 13: Asia Pacific Web Analytics Market Revenue Share (%), by Country 2024 & 2032
- Figure 14: Asia Pacific Web Analytics Market Volume Share (%), by Country 2024 & 2032
- Figure 15: South America Web Analytics Market Revenue (Million), by Country 2024 & 2032
- Figure 16: South America Web Analytics Market Volume (K Unit), by Country 2024 & 2032
- Figure 17: South America Web Analytics Market Revenue Share (%), by Country 2024 & 2032
- Figure 18: South America Web Analytics Market Volume Share (%), by Country 2024 & 2032
- Figure 19: North America Web Analytics Market Revenue (Million), by Country 2024 & 2032
- Figure 20: North America Web Analytics Market Volume (K Unit), by Country 2024 & 2032
- Figure 21: North America Web Analytics Market Revenue Share (%), by Country 2024 & 2032
- Figure 22: North America Web Analytics Market Volume Share (%), by Country 2024 & 2032
- Figure 23: MEA Web Analytics Market Revenue (Million), by Country 2024 & 2032
- Figure 24: MEA Web Analytics Market Volume (K Unit), by Country 2024 & 2032
- Figure 25: MEA Web Analytics Market Revenue Share (%), by Country 2024 & 2032
- Figure 26: MEA Web Analytics Market Volume Share (%), by Country 2024 & 2032
- Figure 27: North America Web Analytics Market Revenue (Million), by Application 2024 & 2032
- Figure 28: North America Web Analytics Market Volume (K Unit), by Application 2024 & 2032
- Figure 29: North America Web Analytics Market Revenue Share (%), by Application 2024 & 2032
- Figure 30: North America Web Analytics Market Volume Share (%), by Application 2024 & 2032
- Figure 31: North America Web Analytics Market Revenue (Million), by Offering 2024 & 2032
- Figure 32: North America Web Analytics Market Volume (K Unit), by Offering 2024 & 2032
- Figure 33: North America Web Analytics Market Revenue Share (%), by Offering 2024 & 2032
- Figure 34: North America Web Analytics Market Volume Share (%), by Offering 2024 & 2032
- Figure 35: North America Web Analytics Market Revenue (Million), by End-User Vertical 2024 & 2032
- Figure 36: North America Web Analytics Market Volume (K Unit), by End-User Vertical 2024 & 2032
- Figure 37: North America Web Analytics Market Revenue Share (%), by End-User Vertical 2024 & 2032
- Figure 38: North America Web Analytics Market Volume Share (%), by End-User Vertical 2024 & 2032
- Figure 39: North America Web Analytics Market Revenue (Million), by Country 2024 & 2032
- Figure 40: North America Web Analytics Market Volume (K Unit), by Country 2024 & 2032
- Figure 41: North America Web Analytics Market Revenue Share (%), by Country 2024 & 2032
- Figure 42: North America Web Analytics Market Volume Share (%), by Country 2024 & 2032
- Figure 43: Europe Web Analytics Market Revenue (Million), by Application 2024 & 2032
- Figure 44: Europe Web Analytics Market Volume (K Unit), by Application 2024 & 2032
- Figure 45: Europe Web Analytics Market Revenue Share (%), by Application 2024 & 2032
- Figure 46: Europe Web Analytics Market Volume Share (%), by Application 2024 & 2032
- Figure 47: Europe Web Analytics Market Revenue (Million), by Offering 2024 & 2032
- Figure 48: Europe Web Analytics Market Volume (K Unit), by Offering 2024 & 2032
- Figure 49: Europe Web Analytics Market Revenue Share (%), by Offering 2024 & 2032
- Figure 50: Europe Web Analytics Market Volume Share (%), by Offering 2024 & 2032
- Figure 51: Europe Web Analytics Market Revenue (Million), by End-User Vertical 2024 & 2032
- Figure 52: Europe Web Analytics Market Volume (K Unit), by End-User Vertical 2024 & 2032
- Figure 53: Europe Web Analytics Market Revenue Share (%), by End-User Vertical 2024 & 2032
- Figure 54: Europe Web Analytics Market Volume Share (%), by End-User Vertical 2024 & 2032
- Figure 55: Europe Web Analytics Market Revenue (Million), by Country 2024 & 2032
- Figure 56: Europe Web Analytics Market Volume (K Unit), by Country 2024 & 2032
- Figure 57: Europe Web Analytics Market Revenue Share (%), by Country 2024 & 2032
- Figure 58: Europe Web Analytics Market Volume Share (%), by Country 2024 & 2032
- Figure 59: Asia Web Analytics Market Revenue (Million), by Application 2024 & 2032
- Figure 60: Asia Web Analytics Market Volume (K Unit), by Application 2024 & 2032
- Figure 61: Asia Web Analytics Market Revenue Share (%), by Application 2024 & 2032
- Figure 62: Asia Web Analytics Market Volume Share (%), by Application 2024 & 2032
- Figure 63: Asia Web Analytics Market Revenue (Million), by Offering 2024 & 2032
- Figure 64: Asia Web Analytics Market Volume (K Unit), by Offering 2024 & 2032
- Figure 65: Asia Web Analytics Market Revenue Share (%), by Offering 2024 & 2032
- Figure 66: Asia Web Analytics Market Volume Share (%), by Offering 2024 & 2032
- Figure 67: Asia Web Analytics Market Revenue (Million), by End-User Vertical 2024 & 2032
- Figure 68: Asia Web Analytics Market Volume (K Unit), by End-User Vertical 2024 & 2032
- Figure 69: Asia Web Analytics Market Revenue Share (%), by End-User Vertical 2024 & 2032
- Figure 70: Asia Web Analytics Market Volume Share (%), by End-User Vertical 2024 & 2032
- Figure 71: Asia Web Analytics Market Revenue (Million), by Country 2024 & 2032
- Figure 72: Asia Web Analytics Market Volume (K Unit), by Country 2024 & 2032
- Figure 73: Asia Web Analytics Market Revenue Share (%), by Country 2024 & 2032
- Figure 74: Asia Web Analytics Market Volume Share (%), by Country 2024 & 2032
- Figure 75: Australia and New Zealand Web Analytics Market Revenue (Million), by Application 2024 & 2032
- Figure 76: Australia and New Zealand Web Analytics Market Volume (K Unit), by Application 2024 & 2032
- Figure 77: Australia and New Zealand Web Analytics Market Revenue Share (%), by Application 2024 & 2032
- Figure 78: Australia and New Zealand Web Analytics Market Volume Share (%), by Application 2024 & 2032
- Figure 79: Australia and New Zealand Web Analytics Market Revenue (Million), by Offering 2024 & 2032
- Figure 80: Australia and New Zealand Web Analytics Market Volume (K Unit), by Offering 2024 & 2032
- Figure 81: Australia and New Zealand Web Analytics Market Revenue Share (%), by Offering 2024 & 2032
- Figure 82: Australia and New Zealand Web Analytics Market Volume Share (%), by Offering 2024 & 2032
- Figure 83: Australia and New Zealand Web Analytics Market Revenue (Million), by End-User Vertical 2024 & 2032
- Figure 84: Australia and New Zealand Web Analytics Market Volume (K Unit), by End-User Vertical 2024 & 2032
- Figure 85: Australia and New Zealand Web Analytics Market Revenue Share (%), by End-User Vertical 2024 & 2032
- Figure 86: Australia and New Zealand Web Analytics Market Volume Share (%), by End-User Vertical 2024 & 2032
- Figure 87: Australia and New Zealand Web Analytics Market Revenue (Million), by Country 2024 & 2032
- Figure 88: Australia and New Zealand Web Analytics Market Volume (K Unit), by Country 2024 & 2032
- Figure 89: Australia and New Zealand Web Analytics Market Revenue Share (%), by Country 2024 & 2032
- Figure 90: Australia and New Zealand Web Analytics Market Volume Share (%), by Country 2024 & 2032
- Figure 91: Latin America Web Analytics Market Revenue (Million), by Application 2024 & 2032
- Figure 92: Latin America Web Analytics Market Volume (K Unit), by Application 2024 & 2032
- Figure 93: Latin America Web Analytics Market Revenue Share (%), by Application 2024 & 2032
- Figure 94: Latin America Web Analytics Market Volume Share (%), by Application 2024 & 2032
- Figure 95: Latin America Web Analytics Market Revenue (Million), by Offering 2024 & 2032
- Figure 96: Latin America Web Analytics Market Volume (K Unit), by Offering 2024 & 2032
- Figure 97: Latin America Web Analytics Market Revenue Share (%), by Offering 2024 & 2032
- Figure 98: Latin America Web Analytics Market Volume Share (%), by Offering 2024 & 2032
- Figure 99: Latin America Web Analytics Market Revenue (Million), by End-User Vertical 2024 & 2032
- Figure 100: Latin America Web Analytics Market Volume (K Unit), by End-User Vertical 2024 & 2032
- Figure 101: Latin America Web Analytics Market Revenue Share (%), by End-User Vertical 2024 & 2032
- Figure 102: Latin America Web Analytics Market Volume Share (%), by End-User Vertical 2024 & 2032
- Figure 103: Latin America Web Analytics Market Revenue (Million), by Country 2024 & 2032
- Figure 104: Latin America Web Analytics Market Volume (K Unit), by Country 2024 & 2032
- Figure 105: Latin America Web Analytics Market Revenue Share (%), by Country 2024 & 2032
- Figure 106: Latin America Web Analytics Market Volume Share (%), by Country 2024 & 2032
- Figure 107: Middle East and Africa Web Analytics Market Revenue (Million), by Application 2024 & 2032
- Figure 108: Middle East and Africa Web Analytics Market Volume (K Unit), by Application 2024 & 2032
- Figure 109: Middle East and Africa Web Analytics Market Revenue Share (%), by Application 2024 & 2032
- Figure 110: Middle East and Africa Web Analytics Market Volume Share (%), by Application 2024 & 2032
- Figure 111: Middle East and Africa Web Analytics Market Revenue (Million), by Offering 2024 & 2032
- Figure 112: Middle East and Africa Web Analytics Market Volume (K Unit), by Offering 2024 & 2032
- Figure 113: Middle East and Africa Web Analytics Market Revenue Share (%), by Offering 2024 & 2032
- Figure 114: Middle East and Africa Web Analytics Market Volume Share (%), by Offering 2024 & 2032
- Figure 115: Middle East and Africa Web Analytics Market Revenue (Million), by End-User Vertical 2024 & 2032
- Figure 116: Middle East and Africa Web Analytics Market Volume (K Unit), by End-User Vertical 2024 & 2032
- Figure 117: Middle East and Africa Web Analytics Market Revenue Share (%), by End-User Vertical 2024 & 2032
- Figure 118: Middle East and Africa Web Analytics Market Volume Share (%), by End-User Vertical 2024 & 2032
- Figure 119: Middle East and Africa Web Analytics Market Revenue (Million), by Country 2024 & 2032
- Figure 120: Middle East and Africa Web Analytics Market Volume (K Unit), by Country 2024 & 2032
- Figure 121: Middle East and Africa Web Analytics Market Revenue Share (%), by Country 2024 & 2032
- Figure 122: Middle East and Africa Web Analytics Market Volume Share (%), by Country 2024 & 2032
List of Tables
- Table 1: Global Web Analytics Market Revenue Million Forecast, by Region 2019 & 2032
- Table 2: Global Web Analytics Market Volume K Unit Forecast, by Region 2019 & 2032
- Table 3: Global Web Analytics Market Revenue Million Forecast, by Application 2019 & 2032
- Table 4: Global Web Analytics Market Volume K Unit Forecast, by Application 2019 & 2032
- Table 5: Global Web Analytics Market Revenue Million Forecast, by Offering 2019 & 2032
- Table 6: Global Web Analytics Market Volume K Unit Forecast, by Offering 2019 & 2032
- Table 7: Global Web Analytics Market Revenue Million Forecast, by End-User Vertical 2019 & 2032
- Table 8: Global Web Analytics Market Volume K Unit Forecast, by End-User Vertical 2019 & 2032
- Table 9: Global Web Analytics Market Revenue Million Forecast, by Region 2019 & 2032
- Table 10: Global Web Analytics Market Volume K Unit Forecast, by Region 2019 & 2032
- Table 11: Global Web Analytics Market Revenue Million Forecast, by Country 2019 & 2032
- Table 12: Global Web Analytics Market Volume K Unit Forecast, by Country 2019 & 2032
- Table 13: United States Web Analytics Market Revenue (Million) Forecast, by Application 2019 & 2032
- Table 14: United States Web Analytics Market Volume (K Unit) Forecast, by Application 2019 & 2032
- Table 15: Canada Web Analytics Market Revenue (Million) Forecast, by Application 2019 & 2032
- Table 16: Canada Web Analytics Market Volume (K Unit) Forecast, by Application 2019 & 2032
- Table 17: Mexico Web Analytics Market Revenue (Million) Forecast, by Application 2019 & 2032
- Table 18: Mexico Web Analytics Market Volume (K Unit) Forecast, by Application 2019 & 2032
- Table 19: Global Web Analytics Market Revenue Million Forecast, by Country 2019 & 2032
- Table 20: Global Web Analytics Market Volume K Unit Forecast, by Country 2019 & 2032
- Table 21: Germany Web Analytics Market Revenue (Million) Forecast, by Application 2019 & 2032
- Table 22: Germany Web Analytics Market Volume (K Unit) Forecast, by Application 2019 & 2032
- Table 23: United Kingdom Web Analytics Market Revenue (Million) Forecast, by Application 2019 & 2032
- Table 24: United Kingdom Web Analytics Market Volume (K Unit) Forecast, by Application 2019 & 2032
- Table 25: France Web Analytics Market Revenue (Million) Forecast, by Application 2019 & 2032
- Table 26: France Web Analytics Market Volume (K Unit) Forecast, by Application 2019 & 2032
- Table 27: Spain Web Analytics Market Revenue (Million) Forecast, by Application 2019 & 2032
- Table 28: Spain Web Analytics Market Volume (K Unit) Forecast, by Application 2019 & 2032
- Table 29: Italy Web Analytics Market Revenue (Million) Forecast, by Application 2019 & 2032
- Table 30: Italy Web Analytics Market Volume (K Unit) Forecast, by Application 2019 & 2032
- Table 31: Spain Web Analytics Market Revenue (Million) Forecast, by Application 2019 & 2032
- Table 32: Spain Web Analytics Market Volume (K Unit) Forecast, by Application 2019 & 2032
- Table 33: Belgium Web Analytics Market Revenue (Million) Forecast, by Application 2019 & 2032
- Table 34: Belgium Web Analytics Market Volume (K Unit) Forecast, by Application 2019 & 2032
- Table 35: Netherland Web Analytics Market Revenue (Million) Forecast, by Application 2019 & 2032
- Table 36: Netherland Web Analytics Market Volume (K Unit) Forecast, by Application 2019 & 2032
- Table 37: Nordics Web Analytics Market Revenue (Million) Forecast, by Application 2019 & 2032
- Table 38: Nordics Web Analytics Market Volume (K Unit) Forecast, by Application 2019 & 2032
- Table 39: Rest of Europe Web Analytics Market Revenue (Million) Forecast, by Application 2019 & 2032
- Table 40: Rest of Europe Web Analytics Market Volume (K Unit) Forecast, by Application 2019 & 2032
- Table 41: Global Web Analytics Market Revenue Million Forecast, by Country 2019 & 2032
- Table 42: Global Web Analytics Market Volume K Unit Forecast, by Country 2019 & 2032
- Table 43: China Web Analytics Market Revenue (Million) Forecast, by Application 2019 & 2032
- Table 44: China Web Analytics Market Volume (K Unit) Forecast, by Application 2019 & 2032
- Table 45: Japan Web Analytics Market Revenue (Million) Forecast, by Application 2019 & 2032
- Table 46: Japan Web Analytics Market Volume (K Unit) Forecast, by Application 2019 & 2032
- Table 47: India Web Analytics Market Revenue (Million) Forecast, by Application 2019 & 2032
- Table 48: India Web Analytics Market Volume (K Unit) Forecast, by Application 2019 & 2032
- Table 49: South Korea Web Analytics Market Revenue (Million) Forecast, by Application 2019 & 2032
- Table 50: South Korea Web Analytics Market Volume (K Unit) Forecast, by Application 2019 & 2032
- Table 51: Southeast Asia Web Analytics Market Revenue (Million) Forecast, by Application 2019 & 2032
- Table 52: Southeast Asia Web Analytics Market Volume (K Unit) Forecast, by Application 2019 & 2032
- Table 53: Australia Web Analytics Market Revenue (Million) Forecast, by Application 2019 & 2032
- Table 54: Australia Web Analytics Market Volume (K Unit) Forecast, by Application 2019 & 2032
- Table 55: Indonesia Web Analytics Market Revenue (Million) Forecast, by Application 2019 & 2032
- Table 56: Indonesia Web Analytics Market Volume (K Unit) Forecast, by Application 2019 & 2032
- Table 57: Phillipes Web Analytics Market Revenue (Million) Forecast, by Application 2019 & 2032
- Table 58: Phillipes Web Analytics Market Volume (K Unit) Forecast, by Application 2019 & 2032
- Table 59: Singapore Web Analytics Market Revenue (Million) Forecast, by Application 2019 & 2032
- Table 60: Singapore Web Analytics Market Volume (K Unit) Forecast, by Application 2019 & 2032
- Table 61: Thailandc Web Analytics Market Revenue (Million) Forecast, by Application 2019 & 2032
- Table 62: Thailandc Web Analytics Market Volume (K Unit) Forecast, by Application 2019 & 2032
- Table 63: Rest of Asia Pacific Web Analytics Market Revenue (Million) Forecast, by Application 2019 & 2032
- Table 64: Rest of Asia Pacific Web Analytics Market Volume (K Unit) Forecast, by Application 2019 & 2032
- Table 65: Global Web Analytics Market Revenue Million Forecast, by Country 2019 & 2032
- Table 66: Global Web Analytics Market Volume K Unit Forecast, by Country 2019 & 2032
- Table 67: Brazil Web Analytics Market Revenue (Million) Forecast, by Application 2019 & 2032
- Table 68: Brazil Web Analytics Market Volume (K Unit) Forecast, by Application 2019 & 2032
- Table 69: Argentina Web Analytics Market Revenue (Million) Forecast, by Application 2019 & 2032
- Table 70: Argentina Web Analytics Market Volume (K Unit) Forecast, by Application 2019 & 2032
- Table 71: Peru Web Analytics Market Revenue (Million) Forecast, by Application 2019 & 2032
- Table 72: Peru Web Analytics Market Volume (K Unit) Forecast, by Application 2019 & 2032
- Table 73: Chile Web Analytics Market Revenue (Million) Forecast, by Application 2019 & 2032
- Table 74: Chile Web Analytics Market Volume (K Unit) Forecast, by Application 2019 & 2032
- Table 75: Colombia Web Analytics Market Revenue (Million) Forecast, by Application 2019 & 2032
- Table 76: Colombia Web Analytics Market Volume (K Unit) Forecast, by Application 2019 & 2032
- Table 77: Ecuador Web Analytics Market Revenue (Million) Forecast, by Application 2019 & 2032
- Table 78: Ecuador Web Analytics Market Volume (K Unit) Forecast, by Application 2019 & 2032
- Table 79: Venezuela Web Analytics Market Revenue (Million) Forecast, by Application 2019 & 2032
- Table 80: Venezuela Web Analytics Market Volume (K Unit) Forecast, by Application 2019 & 2032
- Table 81: Rest of South America Web Analytics Market Revenue (Million) Forecast, by Application 2019 & 2032
- Table 82: Rest of South America Web Analytics Market Volume (K Unit) Forecast, by Application 2019 & 2032
- Table 83: Global Web Analytics Market Revenue Million Forecast, by Country 2019 & 2032
- Table 84: Global Web Analytics Market Volume K Unit Forecast, by Country 2019 & 2032
- Table 85: United States Web Analytics Market Revenue (Million) Forecast, by Application 2019 & 2032
- Table 86: United States Web Analytics Market Volume (K Unit) Forecast, by Application 2019 & 2032
- Table 87: Canada Web Analytics Market Revenue (Million) Forecast, by Application 2019 & 2032
- Table 88: Canada Web Analytics Market Volume (K Unit) Forecast, by Application 2019 & 2032
- Table 89: Mexico Web Analytics Market Revenue (Million) Forecast, by Application 2019 & 2032
- Table 90: Mexico Web Analytics Market Volume (K Unit) Forecast, by Application 2019 & 2032
- Table 91: Global Web Analytics Market Revenue Million Forecast, by Country 2019 & 2032
- Table 92: Global Web Analytics Market Volume K Unit Forecast, by Country 2019 & 2032
- Table 93: United Arab Emirates Web Analytics Market Revenue (Million) Forecast, by Application 2019 & 2032
- Table 94: United Arab Emirates Web Analytics Market Volume (K Unit) Forecast, by Application 2019 & 2032
- Table 95: Saudi Arabia Web Analytics Market Revenue (Million) Forecast, by Application 2019 & 2032
- Table 96: Saudi Arabia Web Analytics Market Volume (K Unit) Forecast, by Application 2019 & 2032
- Table 97: South Africa Web Analytics Market Revenue (Million) Forecast, by Application 2019 & 2032
- Table 98: South Africa Web Analytics Market Volume (K Unit) Forecast, by Application 2019 & 2032
- Table 99: Rest of Middle East and Africa Web Analytics Market Revenue (Million) Forecast, by Application 2019 & 2032
- Table 100: Rest of Middle East and Africa Web Analytics Market Volume (K Unit) Forecast, by Application 2019 & 2032
- Table 101: Global Web Analytics Market Revenue Million Forecast, by Application 2019 & 2032
- Table 102: Global Web Analytics Market Volume K Unit Forecast, by Application 2019 & 2032
- Table 103: Global Web Analytics Market Revenue Million Forecast, by Offering 2019 & 2032
- Table 104: Global Web Analytics Market Volume K Unit Forecast, by Offering 2019 & 2032
- Table 105: Global Web Analytics Market Revenue Million Forecast, by End-User Vertical 2019 & 2032
- Table 106: Global Web Analytics Market Volume K Unit Forecast, by End-User Vertical 2019 & 2032
- Table 107: Global Web Analytics Market Revenue Million Forecast, by Country 2019 & 2032
- Table 108: Global Web Analytics Market Volume K Unit Forecast, by Country 2019 & 2032
- Table 109: Global Web Analytics Market Revenue Million Forecast, by Application 2019 & 2032
- Table 110: Global Web Analytics Market Volume K Unit Forecast, by Application 2019 & 2032
- Table 111: Global Web Analytics Market Revenue Million Forecast, by Offering 2019 & 2032
- Table 112: Global Web Analytics Market Volume K Unit Forecast, by Offering 2019 & 2032
- Table 113: Global Web Analytics Market Revenue Million Forecast, by End-User Vertical 2019 & 2032
- Table 114: Global Web Analytics Market Volume K Unit Forecast, by End-User Vertical 2019 & 2032
- Table 115: Global Web Analytics Market Revenue Million Forecast, by Country 2019 & 2032
- Table 116: Global Web Analytics Market Volume K Unit Forecast, by Country 2019 & 2032
- Table 117: Global Web Analytics Market Revenue Million Forecast, by Application 2019 & 2032
- Table 118: Global Web Analytics Market Volume K Unit Forecast, by Application 2019 & 2032
- Table 119: Global Web Analytics Market Revenue Million Forecast, by Offering 2019 & 2032
- Table 120: Global Web Analytics Market Volume K Unit Forecast, by Offering 2019 & 2032
- Table 121: Global Web Analytics Market Revenue Million Forecast, by End-User Vertical 2019 & 2032
- Table 122: Global Web Analytics Market Volume K Unit Forecast, by End-User Vertical 2019 & 2032
- Table 123: Global Web Analytics Market Revenue Million Forecast, by Country 2019 & 2032
- Table 124: Global Web Analytics Market Volume K Unit Forecast, by Country 2019 & 2032
- Table 125: Global Web Analytics Market Revenue Million Forecast, by Application 2019 & 2032
- Table 126: Global Web Analytics Market Volume K Unit Forecast, by Application 2019 & 2032
- Table 127: Global Web Analytics Market Revenue Million Forecast, by Offering 2019 & 2032
- Table 128: Global Web Analytics Market Volume K Unit Forecast, by Offering 2019 & 2032
- Table 129: Global Web Analytics Market Revenue Million Forecast, by End-User Vertical 2019 & 2032
- Table 130: Global Web Analytics Market Volume K Unit Forecast, by End-User Vertical 2019 & 2032
- Table 131: Global Web Analytics Market Revenue Million Forecast, by Country 2019 & 2032
- Table 132: Global Web Analytics Market Volume K Unit Forecast, by Country 2019 & 2032
- Table 133: Global Web Analytics Market Revenue Million Forecast, by Application 2019 & 2032
- Table 134: Global Web Analytics Market Volume K Unit Forecast, by Application 2019 & 2032
- Table 135: Global Web Analytics Market Revenue Million Forecast, by Offering 2019 & 2032
- Table 136: Global Web Analytics Market Volume K Unit Forecast, by Offering 2019 & 2032
- Table 137: Global Web Analytics Market Revenue Million Forecast, by End-User Vertical 2019 & 2032
- Table 138: Global Web Analytics Market Volume K Unit Forecast, by End-User Vertical 2019 & 2032
- Table 139: Global Web Analytics Market Revenue Million Forecast, by Country 2019 & 2032
- Table 140: Global Web Analytics Market Volume K Unit Forecast, by Country 2019 & 2032
- Table 141: Global Web Analytics Market Revenue Million Forecast, by Application 2019 & 2032
- Table 142: Global Web Analytics Market Volume K Unit Forecast, by Application 2019 & 2032
- Table 143: Global Web Analytics Market Revenue Million Forecast, by Offering 2019 & 2032
- Table 144: Global Web Analytics Market Volume K Unit Forecast, by Offering 2019 & 2032
- Table 145: Global Web Analytics Market Revenue Million Forecast, by End-User Vertical 2019 & 2032
- Table 146: Global Web Analytics Market Volume K Unit Forecast, by End-User Vertical 2019 & 2032
- Table 147: Global Web Analytics Market Revenue Million Forecast, by Country 2019 & 2032
- Table 148: Global Web Analytics Market Volume K Unit Forecast, by Country 2019 & 2032
Frequently Asked Questions
1. What is the projected Compound Annual Growth Rate (CAGR) of the Web Analytics Market?
The projected CAGR is approximately 18.47%.
2. Which companies are prominent players in the Web Analytics Market?
Key companies in the market include SimilarWeb Ltd, Yahoo! Inc (Verizon), IBM Corporation, Applied Technologies Internet SA, Google LLC, Teradata Corporation, MicroStrategy Incorporated, Adobe Systems Incorporated, SAS Institute, Webtrends Inc, comScore Inc, Microsoft Inc, Facebook Inc, Hootsuite Inc, Splunk Inc, Tableau Software (Salesforce com Inc ).
3. What are the main segments of the Web Analytics Market?
The market segments include Application, Offering, End-User Vertical.
4. Can you provide details about the market size?
The market size is estimated to be USD 6.74 Million as of 2022.
5. What are some drivers contributing to market growth?
Growing Demand for Online Shopping Trends; Growing Importance of Mobile Analytics Solutions.
6. What are the notable trends driving market growth?
Growing Demand for Online Shopping Trends is Expected to Drives the Market Growth.
7. Are there any restraints impacting market growth?
Rigid Government Regulations and Data Privacy Regulations Compliance.
8. Can you provide examples of recent developments in the market?
March 2023: Datajoin, an integration solutions company in Orem, Utah, announced the Digital Analytics Integrations for Adobe Analytics and Google Analytics teams. These new connections extend digital analytics tools beyond website metrics to drive business customer acquisition. Datajoin can connect web analytics data to help to get the most out of marketing automation and advertising platforms.
9. What pricing options are available for accessing the report?
Pricing options include single-user, multi-user, and enterprise licenses priced at USD 4750, USD 5250, and USD 8750 respectively.
10. Is the market size provided in terms of value or volume?
The market size is provided in terms of value, measured in Million and volume, measured in K Unit.
11. Are there any specific market keywords associated with the report?
Yes, the market keyword associated with the report is "Web Analytics Market," which aids in identifying and referencing the specific market segment covered.
12. How do I determine which pricing option suits my needs best?
The pricing options vary based on user requirements and access needs. Individual users may opt for single-user licenses, while businesses requiring broader access may choose multi-user or enterprise licenses for cost-effective access to the report.
13. Are there any additional resources or data provided in the Web Analytics Market report?
While the report offers comprehensive insights, it's advisable to review the specific contents or supplementary materials provided to ascertain if additional resources or data are available.
14. How can I stay updated on further developments or reports in the Web Analytics Market?
To stay informed about further developments, trends, and reports in the Web Analytics Market, consider subscribing to industry newsletters, following relevant companies and organizations, or regularly checking reputable industry news sources and publications.
Methodology
Step 1 - Identification of Relevant Samples Size from Population Database


Step 2 - Approaches for Defining Global Market Size (Value, Volume* & Price*)

Note*: In applicable scenarios
Step 3 - Data Sources
Primary Research
- Web Analytics
- Survey Reports
- Research Institute
- Latest Research Reports
- Opinion Leaders
Secondary Research
- Annual Reports
- White Paper
- Latest Press Release
- Industry Association
- Paid Database
- Investor Presentations

Step 4 - Data Triangulation
Involves using different sources of information in order to increase the validity of a study
These sources are likely to be stakeholders in a program - participants, other researchers, program staff, other community members, and so on.
Then we put all data in single framework & apply various statistical tools to find out the dynamic on the market.
During the analysis stage, feedback from the stakeholder groups would be compared to determine areas of agreement as well as areas of divergence
