

Key Insights
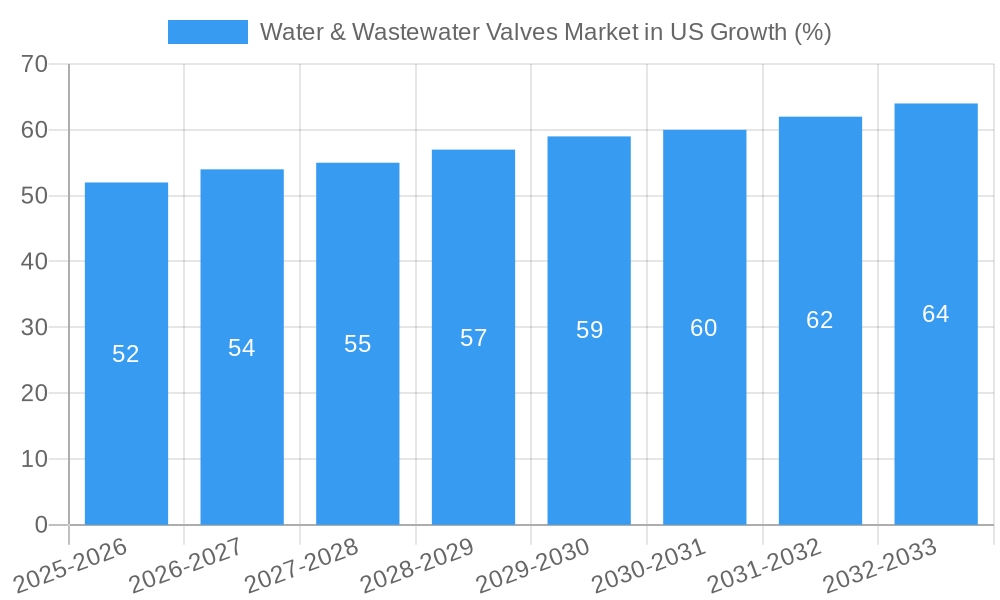
The US water and wastewater valves market, valued at $1.67 billion in 2025, is projected to experience steady growth, driven by increasing investments in water infrastructure modernization and expansion of wastewater treatment facilities. A Compound Annual Growth Rate (CAGR) of 3.28% from 2025 to 2033 indicates a continuous demand for efficient and reliable valve solutions across various applications. Key drivers include aging water infrastructure requiring replacement and upgrades, stringent environmental regulations promoting water conservation and efficient wastewater management, and the growing adoption of smart water management technologies integrating advanced valve automation systems. The market is segmented by valve type (ball, butterfly, gate, globe, check, pressure relief, automatic control, strainer, and others), region (Northeast, Southwest, West, Southeast, Midwest), and wastewater application (water distribution and wastewater treatment/disposal). Competition is robust, with major players such as American Valve Inc, Parker-Hannifin Corp, Flowserve Corporation, and Emerson Electric Co vying for market share through technological innovation, strategic partnerships, and expansion of product portfolios. The Northeast and West regions are likely to exhibit stronger growth due to higher population density and existing infrastructure challenges. The increasing adoption of automated and intelligent valves, designed for remote monitoring and control, is a significant trend shaping market dynamics. While challenges may include fluctuating raw material prices and economic uncertainties, the overall outlook for the US water and wastewater valves market remains positive due to persistent demand for water infrastructure development and improvement.
The growth trajectory is influenced by several factors including government initiatives promoting sustainable water management, technological advancements in valve design and materials (leading to increased durability and efficiency), and the increasing adoption of smart city initiatives that rely heavily on sophisticated water management systems. Specific valve types, such as automated control valves and pressure relief valves, are expected to witness above-average growth rates due to their crucial role in optimizing water distribution and preventing system failures. Regional variations in growth rates are expected, with regions facing significant infrastructure deficits experiencing higher demand. The competitive landscape remains dynamic with mergers, acquisitions, and product innovations continually reshaping the market. Projections suggest a substantial market expansion over the forecast period, driven by the consistent need for reliable and efficient water and wastewater management systems across the United States.

Water & Wastewater Valves Market in US: A Comprehensive Report (2019-2033)
This comprehensive report provides an in-depth analysis of the Water & Wastewater Valves market in the US, covering market dynamics, industry trends, leading segments, and key players. The study period spans from 2019 to 2033, with 2025 as the base and estimated year. This report is crucial for stakeholders seeking actionable insights to navigate this dynamic market and capitalize on emerging opportunities. The market size is projected to reach xx Million by 2033.
Water & Wastewater Valves Market in US Market Dynamics & Concentration
The US water and wastewater valves market exhibits a moderately concentrated landscape, with several major players commanding significant market share. Market concentration is influenced by factors such as economies of scale, technological advancements, and brand recognition. Key players engage in strategic mergers and acquisitions (M&A) to expand their product portfolios, geographical reach, and technological capabilities. The number of M&A deals in the sector has been steadily increasing, reflecting the strategic importance of consolidation in this market. For example, in 2024, xx M&A deals were recorded, representing a xx% increase from the previous year.
- Market Concentration: The top 5 players account for approximately xx% of the market share in 2025.
- Innovation Drivers: Increasing demand for automation, smart technologies, and energy efficiency drives innovation in valve design and functionality.
- Regulatory Frameworks: Stringent environmental regulations and safety standards influence product development and adoption.
- Product Substitutes: The market faces competition from alternative technologies, although valves remain the dominant solution.
- End-User Trends: The growing emphasis on water conservation and infrastructure upgrades drives demand for advanced valves.
Water & Wastewater Valves Market in US Industry Trends & Analysis
The US water and wastewater valves market is experiencing robust growth, driven by factors such as aging infrastructure, increasing urbanization, and stringent environmental regulations. The market is estimated to register a CAGR of xx% during the forecast period (2025-2033). Technological advancements, like smart valves with remote monitoring capabilities, are rapidly increasing market penetration. Consumer preferences are shifting towards durable, energy-efficient, and easily maintainable valves. The competitive landscape is characterized by both intense rivalry among established players and the emergence of innovative startups. This dynamic environment requires proactive strategies for market success.
Leading Markets & Segments in Water & Wastewater Valves Market in US
The Northeast and Southwest regions dominate the US water and wastewater valves market due to robust infrastructure development and high population density. Within the product type segment, Ball Valves and Butterfly Valves hold the largest share due to their wide range of applications and cost-effectiveness. Wastewater treatment and disposal segments show significant growth potential, fueled by increased investments in water infrastructure projects.
- Key Drivers (By Region):
- Northeast: Strong industrial presence, significant infrastructure investments, and stringent environmental regulations.
- Southwest: Rapid urbanization, growing population, and rising demand for water infrastructure upgrades.
- Midwest: Agricultural activities requiring extensive irrigation systems, industrial expansion, and aging infrastructure.
- Key Drivers (By Type):
- Ball Valves: Versatility, ease of operation, and cost-effectiveness.
- Butterfly Valves: Suitable for large diameter pipelines, simple design, and cost-effectiveness.
- Water Distribution: Large-scale water infrastructure projects and rising urban population.
- Wastewater Treatment and Disposal: Investments in improving wastewater treatment facilities and addressing pollution control.
Water & Wastewater Valves Market in US Product Developments
Recent product innovations focus on enhancing valve performance, durability, and smart functionalities. Manufacturers are integrating advanced materials, sensors, and control systems to optimize valve operation and reduce maintenance needs. These developments aim to improve operational efficiency, enhance safety, and meet the growing demand for sustainable water management solutions. For example, DEZURIK's Extended Flange Urethane Lined Knife Gate Valves improve performance in slurry applications. The integration of HART 7 technology in Emerson's TopWorxTM DX PST provides valuable diagnostic information for predictive maintenance.
Key Drivers of Water & Wastewater Valves Market in US Growth
Several factors contribute to the market's growth. Firstly, aging water infrastructure across the US necessitates extensive repairs and upgrades, driving significant demand for valves. Secondly, stringent environmental regulations and increasing awareness of water conservation promote the adoption of advanced and efficient valves. Thirdly, technological advancements, such as smart valves with remote monitoring capabilities, enhance operational efficiency and reduce maintenance costs. Lastly, the increasing adoption of automation in water and wastewater treatment plants further boosts market growth.
Challenges in the Water & Wastewater Valves Market in US Market
The market faces challenges, including supply chain disruptions impacting raw material availability and lead times. Competition from both domestic and international players creates pricing pressures, while stringent regulatory compliance requirements add to the operational complexities. Fluctuations in raw material prices add to the cost of production and can affect profitability.
Emerging Opportunities in Water & Wastewater Valves Market in US
The market presents opportunities for companies leveraging technological advancements, such as smart valves with integrated sensors, data analytics, and remote monitoring capabilities. Strategic partnerships and collaborations with water utilities and municipalities can provide access to potential customers and projects. Expanding into underserved markets and focusing on sustainable and eco-friendly valve solutions further presents significant growth opportunities.
Leading Players in the Water & Wastewater Valves Market in US Sector
- American Valve Inc
- Aegis Flow Technologies
- Ari Valve Corp
- Parker-Hannifin Corp
- Hayward Flow Control
- Flowserve Corporation
- Bi-Torq Valve Automation
- U S Valve LLC
- DeZURIK Inc
- Baker Hughes
- Bray International Inc
- Emerson Electric Co
- CIRCOR International Inc
- Crane Co (Crane Fluid Systems)
- Flomatic Corporation (Boshart Industries Inc )
- Cla-Val Company
- AMERICAN Cast Iron Pipe Company
- Asahi/America Inc (Asahi Yukizai Corporation)
- BELIMO Aircontrols (USA) Inc
- Watts Water Technologies Inc
- Schlumberger Limited *List Not Exhaustive
Key Milestones in Water & Wastewater Valves Market in US Industry
- September 2022: DEZURIK announced the release of Extended Flange Urethane Lined Knife Gate Valves, improving performance in challenging applications.
- May 2022: Emerson introduced the TopWorxTM DX PST with HART 7, enabling digital transformation in process applications through advanced data and diagnostics.
Strategic Outlook for Water & Wastewater Valves Market in US Market
The US water and wastewater valves market presents significant growth potential, driven by ongoing infrastructure upgrades, technological advancements, and increasing demand for sustainable water management solutions. Companies focusing on innovation, strategic partnerships, and expansion into new markets are well-positioned to capitalize on the long-term growth opportunities within this sector. The focus on smart technologies and predictive maintenance will continue to drive market evolution and create new value propositions.
Water & Wastewater Valves Market in US Segmentation
-
1. Type
- 1.1. Ball Valves
- 1.2. Butterfly Valves
- 1.3. Gate Valves
- 1.4. Globe Valves
- 1.5. Check Valves
- 1.6. Pressure
- 1.7. Automatic Control Valves
- 1.8. Strainer Valves and Others
-
2. Wastewater Application
- 2.1. Water Distribution
- 2.2. Wastewater Treatment and Disposal
Water & Wastewater Valves Market in US Segmentation By Geography
-
1. North America
- 1.1. United States
- 1.2. Canada
- 1.3. Mexico
-
2. South America
- 2.1. Brazil
- 2.2. Argentina
- 2.3. Rest of South America
-
3. Europe
- 3.1. United Kingdom
- 3.2. Germany
- 3.3. France
- 3.4. Italy
- 3.5. Spain
- 3.6. Russia
- 3.7. Benelux
- 3.8. Nordics
- 3.9. Rest of Europe
-
4. Middle East & Africa
- 4.1. Turkey
- 4.2. Israel
- 4.3. GCC
- 4.4. North Africa
- 4.5. South Africa
- 4.6. Rest of Middle East & Africa
-
5. Asia Pacific
- 5.1. China
- 5.2. India
- 5.3. Japan
- 5.4. South Korea
- 5.5. ASEAN
- 5.6. Oceania
- 5.7. Rest of Asia Pacific

Water & Wastewater Valves Market in US REPORT HIGHLIGHTS
| Aspects | Details |
|---|---|
| Study Period | 2019-2033 |
| Base Year | 2024 |
| Estimated Year | 2025 |
| Forecast Period | 2025-2033 |
| Historical Period | 2019-2024 |
| Growth Rate | CAGR of 3.28% from 2019-2033 |
| Segmentation |
|
Table of Contents
- 1. Introduction
- 1.1. Research Scope
- 1.2. Market Segmentation
- 1.3. Research Methodology
- 1.4. Definitions and Assumptions
- 2. Executive Summary
- 2.1. Introduction
- 3. Market Dynamics
- 3.1. Introduction
- 3.2. Market Drivers
- 3.2.1. The Need to Replace Aging Water and Wastewater Infrastructure Across the Nation and Supporting Government Loans
- 3.3. Market Restrains
- 3.3.1. Operational Challenges and High Levels of Competition Leading to Price Pressures for Manufacturers
- 3.4. Market Trends
- 3.4.1. The Need to Replace Aging Water and Wastewater Infrastructure Across the Nation and Supporting Government Loans
- 4. Market Factor Analysis
- 4.1. Porters Five Forces
- 4.2. Supply/Value Chain
- 4.3. PESTEL analysis
- 4.4. Market Entropy
- 4.5. Patent/Trademark Analysis
- 5. Global Water & Wastewater Valves Market in US Analysis, Insights and Forecast, 2019-2031
- 5.1. Market Analysis, Insights and Forecast - by Type
- 5.1.1. Ball Valves
- 5.1.2. Butterfly Valves
- 5.1.3. Gate Valves
- 5.1.4. Globe Valves
- 5.1.5. Check Valves
- 5.1.6. Pressure
- 5.1.7. Automatic Control Valves
- 5.1.8. Strainer Valves and Others
- 5.2. Market Analysis, Insights and Forecast - by Wastewater Application
- 5.2.1. Water Distribution
- 5.2.2. Wastewater Treatment and Disposal
- 5.3. Market Analysis, Insights and Forecast - by Region
- 5.3.1. North America
- 5.3.2. South America
- 5.3.3. Europe
- 5.3.4. Middle East & Africa
- 5.3.5. Asia Pacific
- 5.1. Market Analysis, Insights and Forecast - by Type
- 6. North America Water & Wastewater Valves Market in US Analysis, Insights and Forecast, 2019-2031
- 6.1. Market Analysis, Insights and Forecast - by Type
- 6.1.1. Ball Valves
- 6.1.2. Butterfly Valves
- 6.1.3. Gate Valves
- 6.1.4. Globe Valves
- 6.1.5. Check Valves
- 6.1.6. Pressure
- 6.1.7. Automatic Control Valves
- 6.1.8. Strainer Valves and Others
- 6.2. Market Analysis, Insights and Forecast - by Wastewater Application
- 6.2.1. Water Distribution
- 6.2.2. Wastewater Treatment and Disposal
- 6.1. Market Analysis, Insights and Forecast - by Type
- 7. South America Water & Wastewater Valves Market in US Analysis, Insights and Forecast, 2019-2031
- 7.1. Market Analysis, Insights and Forecast - by Type
- 7.1.1. Ball Valves
- 7.1.2. Butterfly Valves
- 7.1.3. Gate Valves
- 7.1.4. Globe Valves
- 7.1.5. Check Valves
- 7.1.6. Pressure
- 7.1.7. Automatic Control Valves
- 7.1.8. Strainer Valves and Others
- 7.2. Market Analysis, Insights and Forecast - by Wastewater Application
- 7.2.1. Water Distribution
- 7.2.2. Wastewater Treatment and Disposal
- 7.1. Market Analysis, Insights and Forecast - by Type
- 8. Europe Water & Wastewater Valves Market in US Analysis, Insights and Forecast, 2019-2031
- 8.1. Market Analysis, Insights and Forecast - by Type
- 8.1.1. Ball Valves
- 8.1.2. Butterfly Valves
- 8.1.3. Gate Valves
- 8.1.4. Globe Valves
- 8.1.5. Check Valves
- 8.1.6. Pressure
- 8.1.7. Automatic Control Valves
- 8.1.8. Strainer Valves and Others
- 8.2. Market Analysis, Insights and Forecast - by Wastewater Application
- 8.2.1. Water Distribution
- 8.2.2. Wastewater Treatment and Disposal
- 8.1. Market Analysis, Insights and Forecast - by Type
- 9. Middle East & Africa Water & Wastewater Valves Market in US Analysis, Insights and Forecast, 2019-2031
- 9.1. Market Analysis, Insights and Forecast - by Type
- 9.1.1. Ball Valves
- 9.1.2. Butterfly Valves
- 9.1.3. Gate Valves
- 9.1.4. Globe Valves
- 9.1.5. Check Valves
- 9.1.6. Pressure
- 9.1.7. Automatic Control Valves
- 9.1.8. Strainer Valves and Others
- 9.2. Market Analysis, Insights and Forecast - by Wastewater Application
- 9.2.1. Water Distribution
- 9.2.2. Wastewater Treatment and Disposal
- 9.1. Market Analysis, Insights and Forecast - by Type
- 10. Asia Pacific Water & Wastewater Valves Market in US Analysis, Insights and Forecast, 2019-2031
- 10.1. Market Analysis, Insights and Forecast - by Type
- 10.1.1. Ball Valves
- 10.1.2. Butterfly Valves
- 10.1.3. Gate Valves
- 10.1.4. Globe Valves
- 10.1.5. Check Valves
- 10.1.6. Pressure
- 10.1.7. Automatic Control Valves
- 10.1.8. Strainer Valves and Others
- 10.2. Market Analysis, Insights and Forecast - by Wastewater Application
- 10.2.1. Water Distribution
- 10.2.2. Wastewater Treatment and Disposal
- 10.1. Market Analysis, Insights and Forecast - by Type
- 11. Northeast Water & Wastewater Valves Market in US Analysis, Insights and Forecast, 2019-2031
- 12. Southeast Water & Wastewater Valves Market in US Analysis, Insights and Forecast, 2019-2031
- 13. Midwest Water & Wastewater Valves Market in US Analysis, Insights and Forecast, 2019-2031
- 14. Southwest Water & Wastewater Valves Market in US Analysis, Insights and Forecast, 2019-2031
- 15. West Water & Wastewater Valves Market in US Analysis, Insights and Forecast, 2019-2031
- 16. Competitive Analysis
- 16.1. Global Market Share Analysis 2024
- 16.2. Company Profiles
- 16.2.1 American Valve Inc
- 16.2.1.1. Overview
- 16.2.1.2. Products
- 16.2.1.3. SWOT Analysis
- 16.2.1.4. Recent Developments
- 16.2.1.5. Financials (Based on Availability)
- 16.2.2 Aegis Flow Technologies
- 16.2.2.1. Overview
- 16.2.2.2. Products
- 16.2.2.3. SWOT Analysis
- 16.2.2.4. Recent Developments
- 16.2.2.5. Financials (Based on Availability)
- 16.2.3 Ari Valve Corp
- 16.2.3.1. Overview
- 16.2.3.2. Products
- 16.2.3.3. SWOT Analysis
- 16.2.3.4. Recent Developments
- 16.2.3.5. Financials (Based on Availability)
- 16.2.4 Parker-Hannifin Corp
- 16.2.4.1. Overview
- 16.2.4.2. Products
- 16.2.4.3. SWOT Analysis
- 16.2.4.4. Recent Developments
- 16.2.4.5. Financials (Based on Availability)
- 16.2.5 Hayward Flow Control
- 16.2.5.1. Overview
- 16.2.5.2. Products
- 16.2.5.3. SWOT Analysis
- 16.2.5.4. Recent Developments
- 16.2.5.5. Financials (Based on Availability)
- 16.2.6 Flowserve Corporation
- 16.2.6.1. Overview
- 16.2.6.2. Products
- 16.2.6.3. SWOT Analysis
- 16.2.6.4. Recent Developments
- 16.2.6.5. Financials (Based on Availability)
- 16.2.7 Bi-Torq Valve Automation
- 16.2.7.1. Overview
- 16.2.7.2. Products
- 16.2.7.3. SWOT Analysis
- 16.2.7.4. Recent Developments
- 16.2.7.5. Financials (Based on Availability)
- 16.2.8 U S Valve LLC
- 16.2.8.1. Overview
- 16.2.8.2. Products
- 16.2.8.3. SWOT Analysis
- 16.2.8.4. Recent Developments
- 16.2.8.5. Financials (Based on Availability)
- 16.2.9 DeZURIK Inc
- 16.2.9.1. Overview
- 16.2.9.2. Products
- 16.2.9.3. SWOT Analysis
- 16.2.9.4. Recent Developments
- 16.2.9.5. Financials (Based on Availability)
- 16.2.10 Baker Hughes
- 16.2.10.1. Overview
- 16.2.10.2. Products
- 16.2.10.3. SWOT Analysis
- 16.2.10.4. Recent Developments
- 16.2.10.5. Financials (Based on Availability)
- 16.2.11 Bray International Inc
- 16.2.11.1. Overview
- 16.2.11.2. Products
- 16.2.11.3. SWOT Analysis
- 16.2.11.4. Recent Developments
- 16.2.11.5. Financials (Based on Availability)
- 16.2.12 Emerson Electric Co
- 16.2.12.1. Overview
- 16.2.12.2. Products
- 16.2.12.3. SWOT Analysis
- 16.2.12.4. Recent Developments
- 16.2.12.5. Financials (Based on Availability)
- 16.2.13 CIRCOR International Inc
- 16.2.13.1. Overview
- 16.2.13.2. Products
- 16.2.13.3. SWOT Analysis
- 16.2.13.4. Recent Developments
- 16.2.13.5. Financials (Based on Availability)
- 16.2.14 Crane Co (Crane Fluid Systems)
- 16.2.14.1. Overview
- 16.2.14.2. Products
- 16.2.14.3. SWOT Analysis
- 16.2.14.4. Recent Developments
- 16.2.14.5. Financials (Based on Availability)
- 16.2.15 Flomatic Corporation (Boshart Industries Inc )
- 16.2.15.1. Overview
- 16.2.15.2. Products
- 16.2.15.3. SWOT Analysis
- 16.2.15.4. Recent Developments
- 16.2.15.5. Financials (Based on Availability)
- 16.2.16 Cla-Val Company
- 16.2.16.1. Overview
- 16.2.16.2. Products
- 16.2.16.3. SWOT Analysis
- 16.2.16.4. Recent Developments
- 16.2.16.5. Financials (Based on Availability)
- 16.2.17 AMERICAN Cast Iron Pipe Company
- 16.2.17.1. Overview
- 16.2.17.2. Products
- 16.2.17.3. SWOT Analysis
- 16.2.17.4. Recent Developments
- 16.2.17.5. Financials (Based on Availability)
- 16.2.18 Asahi/America Inc (Asahi Yukizai Corporation)
- 16.2.18.1. Overview
- 16.2.18.2. Products
- 16.2.18.3. SWOT Analysis
- 16.2.18.4. Recent Developments
- 16.2.18.5. Financials (Based on Availability)
- 16.2.19 BELIMO Aircontrols (USA) Inc
- 16.2.19.1. Overview
- 16.2.19.2. Products
- 16.2.19.3. SWOT Analysis
- 16.2.19.4. Recent Developments
- 16.2.19.5. Financials (Based on Availability)
- 16.2.20 Watts Water Technologies Inc
- 16.2.20.1. Overview
- 16.2.20.2. Products
- 16.2.20.3. SWOT Analysis
- 16.2.20.4. Recent Developments
- 16.2.20.5. Financials (Based on Availability)
- 16.2.21 Schlumberger Limited*List Not Exhaustive
- 16.2.21.1. Overview
- 16.2.21.2. Products
- 16.2.21.3. SWOT Analysis
- 16.2.21.4. Recent Developments
- 16.2.21.5. Financials (Based on Availability)
- 16.2.1 American Valve Inc
List of Figures
- Figure 1: Global Water & Wastewater Valves Market in US Revenue Breakdown (Million, %) by Region 2024 & 2032
- Figure 2: United states Water & Wastewater Valves Market in US Revenue (Million), by Country 2024 & 2032
- Figure 3: United states Water & Wastewater Valves Market in US Revenue Share (%), by Country 2024 & 2032
- Figure 4: North America Water & Wastewater Valves Market in US Revenue (Million), by Type 2024 & 2032
- Figure 5: North America Water & Wastewater Valves Market in US Revenue Share (%), by Type 2024 & 2032
- Figure 6: North America Water & Wastewater Valves Market in US Revenue (Million), by Wastewater Application 2024 & 2032
- Figure 7: North America Water & Wastewater Valves Market in US Revenue Share (%), by Wastewater Application 2024 & 2032
- Figure 8: North America Water & Wastewater Valves Market in US Revenue (Million), by Country 2024 & 2032
- Figure 9: North America Water & Wastewater Valves Market in US Revenue Share (%), by Country 2024 & 2032
- Figure 10: South America Water & Wastewater Valves Market in US Revenue (Million), by Type 2024 & 2032
- Figure 11: South America Water & Wastewater Valves Market in US Revenue Share (%), by Type 2024 & 2032
- Figure 12: South America Water & Wastewater Valves Market in US Revenue (Million), by Wastewater Application 2024 & 2032
- Figure 13: South America Water & Wastewater Valves Market in US Revenue Share (%), by Wastewater Application 2024 & 2032
- Figure 14: South America Water & Wastewater Valves Market in US Revenue (Million), by Country 2024 & 2032
- Figure 15: South America Water & Wastewater Valves Market in US Revenue Share (%), by Country 2024 & 2032
- Figure 16: Europe Water & Wastewater Valves Market in US Revenue (Million), by Type 2024 & 2032
- Figure 17: Europe Water & Wastewater Valves Market in US Revenue Share (%), by Type 2024 & 2032
- Figure 18: Europe Water & Wastewater Valves Market in US Revenue (Million), by Wastewater Application 2024 & 2032
- Figure 19: Europe Water & Wastewater Valves Market in US Revenue Share (%), by Wastewater Application 2024 & 2032
- Figure 20: Europe Water & Wastewater Valves Market in US Revenue (Million), by Country 2024 & 2032
- Figure 21: Europe Water & Wastewater Valves Market in US Revenue Share (%), by Country 2024 & 2032
- Figure 22: Middle East & Africa Water & Wastewater Valves Market in US Revenue (Million), by Type 2024 & 2032
- Figure 23: Middle East & Africa Water & Wastewater Valves Market in US Revenue Share (%), by Type 2024 & 2032
- Figure 24: Middle East & Africa Water & Wastewater Valves Market in US Revenue (Million), by Wastewater Application 2024 & 2032
- Figure 25: Middle East & Africa Water & Wastewater Valves Market in US Revenue Share (%), by Wastewater Application 2024 & 2032
- Figure 26: Middle East & Africa Water & Wastewater Valves Market in US Revenue (Million), by Country 2024 & 2032
- Figure 27: Middle East & Africa Water & Wastewater Valves Market in US Revenue Share (%), by Country 2024 & 2032
- Figure 28: Asia Pacific Water & Wastewater Valves Market in US Revenue (Million), by Type 2024 & 2032
- Figure 29: Asia Pacific Water & Wastewater Valves Market in US Revenue Share (%), by Type 2024 & 2032
- Figure 30: Asia Pacific Water & Wastewater Valves Market in US Revenue (Million), by Wastewater Application 2024 & 2032
- Figure 31: Asia Pacific Water & Wastewater Valves Market in US Revenue Share (%), by Wastewater Application 2024 & 2032
- Figure 32: Asia Pacific Water & Wastewater Valves Market in US Revenue (Million), by Country 2024 & 2032
- Figure 33: Asia Pacific Water & Wastewater Valves Market in US Revenue Share (%), by Country 2024 & 2032
List of Tables
- Table 1: Global Water & Wastewater Valves Market in US Revenue Million Forecast, by Region 2019 & 2032
- Table 2: Global Water & Wastewater Valves Market in US Revenue Million Forecast, by Type 2019 & 2032
- Table 3: Global Water & Wastewater Valves Market in US Revenue Million Forecast, by Wastewater Application 2019 & 2032
- Table 4: Global Water & Wastewater Valves Market in US Revenue Million Forecast, by Region 2019 & 2032
- Table 5: Global Water & Wastewater Valves Market in US Revenue Million Forecast, by Country 2019 & 2032
- Table 6: Northeast Water & Wastewater Valves Market in US Revenue (Million) Forecast, by Application 2019 & 2032
- Table 7: Southeast Water & Wastewater Valves Market in US Revenue (Million) Forecast, by Application 2019 & 2032
- Table 8: Midwest Water & Wastewater Valves Market in US Revenue (Million) Forecast, by Application 2019 & 2032
- Table 9: Southwest Water & Wastewater Valves Market in US Revenue (Million) Forecast, by Application 2019 & 2032
- Table 10: West Water & Wastewater Valves Market in US Revenue (Million) Forecast, by Application 2019 & 2032
- Table 11: Global Water & Wastewater Valves Market in US Revenue Million Forecast, by Type 2019 & 2032
- Table 12: Global Water & Wastewater Valves Market in US Revenue Million Forecast, by Wastewater Application 2019 & 2032
- Table 13: Global Water & Wastewater Valves Market in US Revenue Million Forecast, by Country 2019 & 2032
- Table 14: United States Water & Wastewater Valves Market in US Revenue (Million) Forecast, by Application 2019 & 2032
- Table 15: Canada Water & Wastewater Valves Market in US Revenue (Million) Forecast, by Application 2019 & 2032
- Table 16: Mexico Water & Wastewater Valves Market in US Revenue (Million) Forecast, by Application 2019 & 2032
- Table 17: Global Water & Wastewater Valves Market in US Revenue Million Forecast, by Type 2019 & 2032
- Table 18: Global Water & Wastewater Valves Market in US Revenue Million Forecast, by Wastewater Application 2019 & 2032
- Table 19: Global Water & Wastewater Valves Market in US Revenue Million Forecast, by Country 2019 & 2032
- Table 20: Brazil Water & Wastewater Valves Market in US Revenue (Million) Forecast, by Application 2019 & 2032
- Table 21: Argentina Water & Wastewater Valves Market in US Revenue (Million) Forecast, by Application 2019 & 2032
- Table 22: Rest of South America Water & Wastewater Valves Market in US Revenue (Million) Forecast, by Application 2019 & 2032
- Table 23: Global Water & Wastewater Valves Market in US Revenue Million Forecast, by Type 2019 & 2032
- Table 24: Global Water & Wastewater Valves Market in US Revenue Million Forecast, by Wastewater Application 2019 & 2032
- Table 25: Global Water & Wastewater Valves Market in US Revenue Million Forecast, by Country 2019 & 2032
- Table 26: United Kingdom Water & Wastewater Valves Market in US Revenue (Million) Forecast, by Application 2019 & 2032
- Table 27: Germany Water & Wastewater Valves Market in US Revenue (Million) Forecast, by Application 2019 & 2032
- Table 28: France Water & Wastewater Valves Market in US Revenue (Million) Forecast, by Application 2019 & 2032
- Table 29: Italy Water & Wastewater Valves Market in US Revenue (Million) Forecast, by Application 2019 & 2032
- Table 30: Spain Water & Wastewater Valves Market in US Revenue (Million) Forecast, by Application 2019 & 2032
- Table 31: Russia Water & Wastewater Valves Market in US Revenue (Million) Forecast, by Application 2019 & 2032
- Table 32: Benelux Water & Wastewater Valves Market in US Revenue (Million) Forecast, by Application 2019 & 2032
- Table 33: Nordics Water & Wastewater Valves Market in US Revenue (Million) Forecast, by Application 2019 & 2032
- Table 34: Rest of Europe Water & Wastewater Valves Market in US Revenue (Million) Forecast, by Application 2019 & 2032
- Table 35: Global Water & Wastewater Valves Market in US Revenue Million Forecast, by Type 2019 & 2032
- Table 36: Global Water & Wastewater Valves Market in US Revenue Million Forecast, by Wastewater Application 2019 & 2032
- Table 37: Global Water & Wastewater Valves Market in US Revenue Million Forecast, by Country 2019 & 2032
- Table 38: Turkey Water & Wastewater Valves Market in US Revenue (Million) Forecast, by Application 2019 & 2032
- Table 39: Israel Water & Wastewater Valves Market in US Revenue (Million) Forecast, by Application 2019 & 2032
- Table 40: GCC Water & Wastewater Valves Market in US Revenue (Million) Forecast, by Application 2019 & 2032
- Table 41: North Africa Water & Wastewater Valves Market in US Revenue (Million) Forecast, by Application 2019 & 2032
- Table 42: South Africa Water & Wastewater Valves Market in US Revenue (Million) Forecast, by Application 2019 & 2032
- Table 43: Rest of Middle East & Africa Water & Wastewater Valves Market in US Revenue (Million) Forecast, by Application 2019 & 2032
- Table 44: Global Water & Wastewater Valves Market in US Revenue Million Forecast, by Type 2019 & 2032
- Table 45: Global Water & Wastewater Valves Market in US Revenue Million Forecast, by Wastewater Application 2019 & 2032
- Table 46: Global Water & Wastewater Valves Market in US Revenue Million Forecast, by Country 2019 & 2032
- Table 47: China Water & Wastewater Valves Market in US Revenue (Million) Forecast, by Application 2019 & 2032
- Table 48: India Water & Wastewater Valves Market in US Revenue (Million) Forecast, by Application 2019 & 2032
- Table 49: Japan Water & Wastewater Valves Market in US Revenue (Million) Forecast, by Application 2019 & 2032
- Table 50: South Korea Water & Wastewater Valves Market in US Revenue (Million) Forecast, by Application 2019 & 2032
- Table 51: ASEAN Water & Wastewater Valves Market in US Revenue (Million) Forecast, by Application 2019 & 2032
- Table 52: Oceania Water & Wastewater Valves Market in US Revenue (Million) Forecast, by Application 2019 & 2032
- Table 53: Rest of Asia Pacific Water & Wastewater Valves Market in US Revenue (Million) Forecast, by Application 2019 & 2032
Frequently Asked Questions
1. What is the projected Compound Annual Growth Rate (CAGR) of the Water & Wastewater Valves Market in US?
The projected CAGR is approximately 3.28%.
2. Which companies are prominent players in the Water & Wastewater Valves Market in US?
Key companies in the market include American Valve Inc, Aegis Flow Technologies, Ari Valve Corp, Parker-Hannifin Corp, Hayward Flow Control, Flowserve Corporation, Bi-Torq Valve Automation, U S Valve LLC, DeZURIK Inc, Baker Hughes, Bray International Inc, Emerson Electric Co, CIRCOR International Inc, Crane Co (Crane Fluid Systems), Flomatic Corporation (Boshart Industries Inc ), Cla-Val Company, AMERICAN Cast Iron Pipe Company, Asahi/America Inc (Asahi Yukizai Corporation), BELIMO Aircontrols (USA) Inc, Watts Water Technologies Inc, Schlumberger Limited*List Not Exhaustive.
3. What are the main segments of the Water & Wastewater Valves Market in US?
The market segments include Type, Wastewater Application.
4. Can you provide details about the market size?
The market size is estimated to be USD 1.67 Million as of 2022.
5. What are some drivers contributing to market growth?
The Need to Replace Aging Water and Wastewater Infrastructure Across the Nation and Supporting Government Loans.
6. What are the notable trends driving market growth?
The Need to Replace Aging Water and Wastewater Infrastructure Across the Nation and Supporting Government Loans.
7. Are there any restraints impacting market growth?
Operational Challenges and High Levels of Competition Leading to Price Pressures for Manufacturers.
8. Can you provide examples of recent developments in the market?
September 2022 - DEZURIK announced the release of Extended Flange Urethane Lined Knife Gate Valves. The KUL-EF Extended Flange is a direct dimensional replacement for long-body style slurry push-through valves, but it has the added advantage of not discharging any material while cycling.
9. What pricing options are available for accessing the report?
Pricing options include single-user, multi-user, and enterprise licenses priced at USD 3800, USD 4500, and USD 5800 respectively.
10. Is the market size provided in terms of value or volume?
The market size is provided in terms of value, measured in Million.
11. Are there any specific market keywords associated with the report?
Yes, the market keyword associated with the report is "Water & Wastewater Valves Market in US," which aids in identifying and referencing the specific market segment covered.
12. How do I determine which pricing option suits my needs best?
The pricing options vary based on user requirements and access needs. Individual users may opt for single-user licenses, while businesses requiring broader access may choose multi-user or enterprise licenses for cost-effective access to the report.
13. Are there any additional resources or data provided in the Water & Wastewater Valves Market in US report?
While the report offers comprehensive insights, it's advisable to review the specific contents or supplementary materials provided to ascertain if additional resources or data are available.
14. How can I stay updated on further developments or reports in the Water & Wastewater Valves Market in US?
To stay informed about further developments, trends, and reports in the Water & Wastewater Valves Market in US, consider subscribing to industry newsletters, following relevant companies and organizations, or regularly checking reputable industry news sources and publications.
Methodology
Step 1 - Identification of Relevant Samples Size from Population Database


Step 2 - Approaches for Defining Global Market Size (Value, Volume* & Price*)

Note*: In applicable scenarios
Step 3 - Data Sources
Primary Research
- Web Analytics
- Survey Reports
- Research Institute
- Latest Research Reports
- Opinion Leaders
Secondary Research
- Annual Reports
- White Paper
- Latest Press Release
- Industry Association
- Paid Database
- Investor Presentations

Step 4 - Data Triangulation
Involves using different sources of information in order to increase the validity of a study
These sources are likely to be stakeholders in a program - participants, other researchers, program staff, other community members, and so on.
Then we put all data in single framework & apply various statistical tools to find out the dynamic on the market.
During the analysis stage, feedback from the stakeholder groups would be compared to determine areas of agreement as well as areas of divergence
