

Key Insights
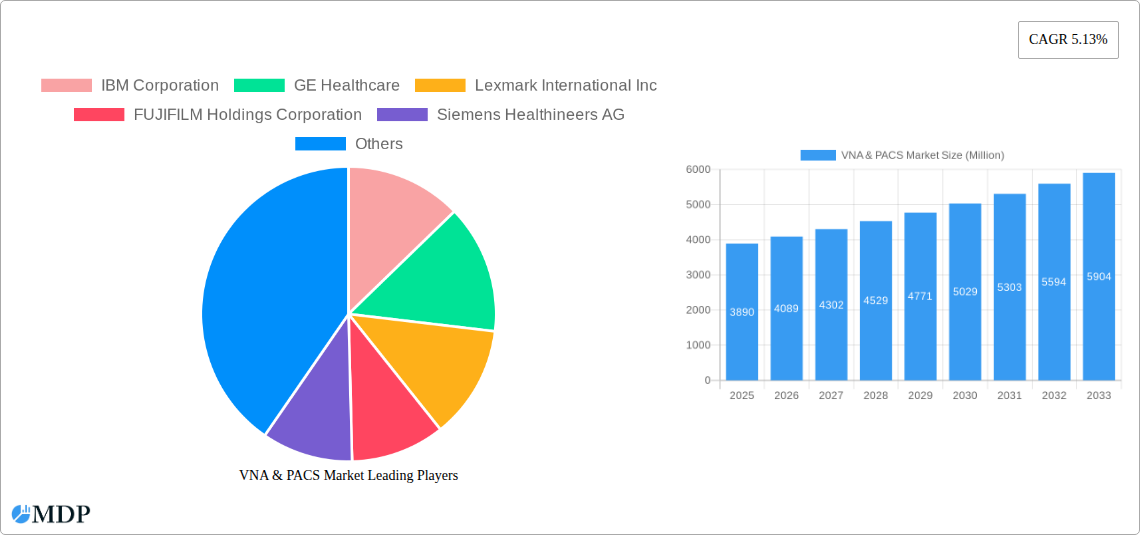
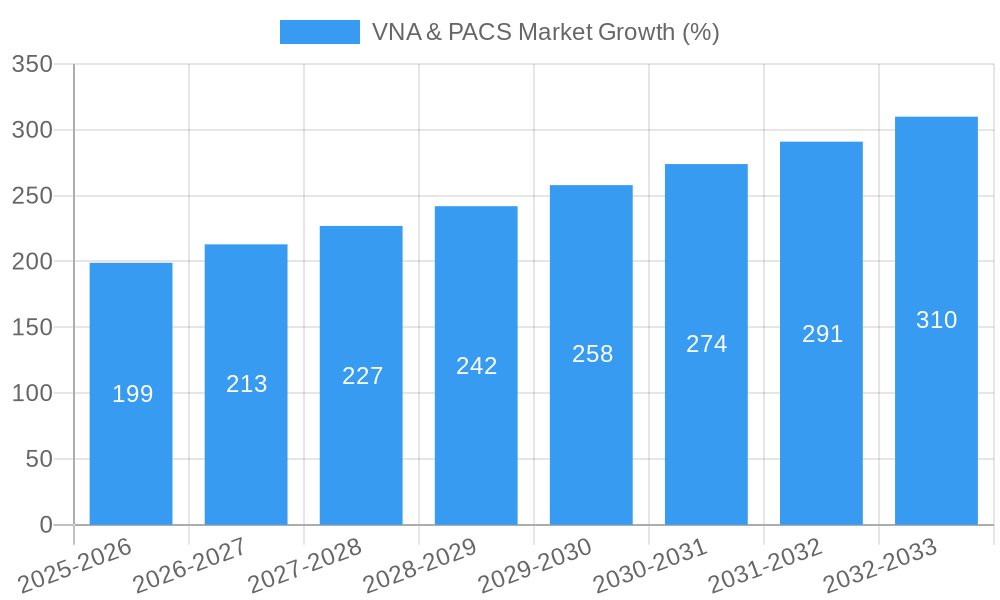
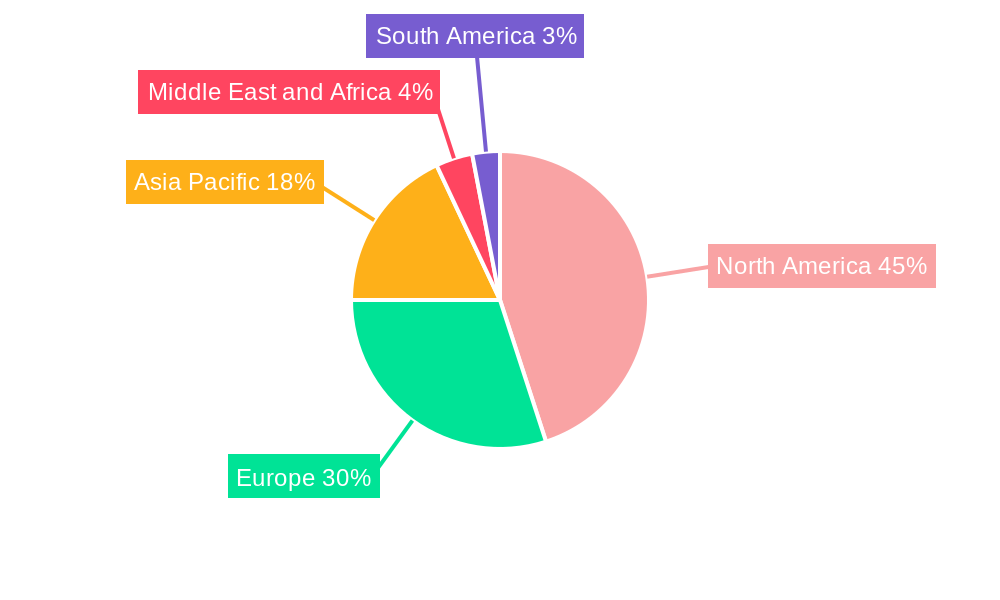
The Vendor Neutral Archive (VNA) and Picture Archiving and Communication Systems (PACS) market is experiencing robust growth, projected to reach \$3.89 billion in 2025 and maintain a Compound Annual Growth Rate (CAGR) of 5.13% from 2025 to 2033. This expansion is fueled by several key drivers. The increasing adoption of digital imaging technologies in healthcare facilities is creating a substantial demand for efficient storage and management solutions. Furthermore, the rising prevalence of chronic diseases requiring extensive imaging procedures and the growing emphasis on improving diagnostic accuracy are significantly contributing to market growth. The shift towards cloud-based solutions, offering scalability, cost-effectiveness, and enhanced accessibility, is another major trend reshaping the market landscape. However, high initial investment costs associated with VNA and PACS implementation, particularly for smaller healthcare providers, and concerns about data security and interoperability remain as significant restraints. The market is segmented by type (PACS and VNA software), mode of delivery (on-site, hybrid, and cloud-hosted), usage model (single department, multiple departments, and multiple sites), and imaging modality (angiography, mammography, computed tomography, magnetic resonance imaging, ultrasound, and other modalities). North America currently holds a substantial market share, driven by high technological advancements and increasing healthcare spending, followed by Europe and the Asia-Pacific region, which are witnessing significant growth due to rising healthcare infrastructure development and expanding digitalization initiatives. The competitive landscape comprises major players including IBM Corporation, GE Healthcare, and Siemens Healthineers, among others, constantly innovating and competing to cater to the evolving needs of the healthcare industry.
The future of the VNA and PACS market is promising, with continuous advancements in artificial intelligence (AI) and machine learning (ML) technologies poised to further enhance diagnostic capabilities and workflow efficiency. Integration of AI-powered image analysis tools within VNAs and PACS platforms is expected to improve diagnostic accuracy, reduce turnaround times, and enhance radiologist productivity. The ongoing adoption of telehealth and remote diagnostics is also driving demand for robust and secure solutions that enable seamless access to medical images across geographical locations. The market is likely to witness further consolidation as larger players acquire smaller companies, leading to increased competition and innovation. Continued focus on improving interoperability, data security, and regulatory compliance will be crucial for vendors to maintain a competitive edge and cater to the growing demands of the healthcare industry. Regional variations in market growth will persist, reflecting differences in healthcare infrastructure, technological adoption rates, and economic factors.
VNA & PACS Market: A Comprehensive Report (2019-2033)
This in-depth report provides a comprehensive analysis of the VNA & PACS market, offering invaluable insights for stakeholders across the healthcare technology landscape. We analyze market dynamics, industry trends, leading segments, key players, and future growth opportunities, covering the period from 2019 to 2033. With a base year of 2025 and a forecast period spanning 2025-2033, this report is essential for informed decision-making in this rapidly evolving market. The total market size in 2025 is estimated at xx Million.
VNA & PACS Market Market Dynamics & Concentration
The VNA & PACS market is experiencing significant growth driven by increasing adoption of digital imaging technologies and the rising demand for efficient image management solutions across healthcare facilities. Market concentration is moderate, with a few major players holding significant market share, yet a number of smaller, niche players providing specialized solutions. The market is characterized by intense competition, with companies focusing on innovation and strategic partnerships to gain a competitive edge. Regulatory frameworks, such as HIPAA in the US and GDPR in Europe, play a crucial role in shaping market dynamics by influencing data security and privacy protocols. The emergence of cloud-based solutions and AI-powered diagnostic tools is driving market innovation. Substitutes for VNA and PACS are limited; however, some organizations may opt for individual departmental solutions rather than enterprise-wide systems. Mergers and acquisitions (M&A) activity is a key aspect, with larger companies acquiring smaller firms to expand their product portfolios and market reach. The historical period (2019-2024) saw xx M&A deals, while the forecast period (2025-2033) is projected to see an increase to xx M&A deals. The top 5 companies hold an estimated xx% of the market share in 2025.
- Market Concentration: Moderate, with a few dominant players.
- Innovation Drivers: Cloud computing, AI, and advanced analytics.
- Regulatory Frameworks: HIPAA, GDPR, and other regional regulations.
- Product Substitutes: Limited, primarily individual departmental solutions.
- End-User Trends: Increasing preference for cloud-based and vendor-neutral solutions.
- M&A Activity: Significant activity expected, driven by consolidation and expansion strategies.
VNA & PACS Market Industry Trends & Analysis
The VNA & PACS market is experiencing robust growth, driven by several factors. The increasing volume of medical images generated necessitates efficient storage and retrieval systems. This demand is fueled by technological advancements like AI-powered image analysis, which improves diagnostic accuracy and workflow efficiency. The rising adoption of telehealth and remote patient monitoring also contributes to the growth as these services rely heavily on image-based diagnostics. Consumer preference leans towards cloud-based solutions owing to their scalability, cost-effectiveness, and accessibility. The competitive landscape is dynamic, with established players and emerging companies vying for market share. This competition fosters innovation and leads to improved product offerings. The market is projected to witness a Compound Annual Growth Rate (CAGR) of xx% during the forecast period (2025-2033), with market penetration expected to reach xx% by 2033. The adoption of cloud-based PACS and VNA systems is a major contributor to market expansion, accounting for approximately xx% of overall market growth.
Leading Markets & Segments in VNA & PACS Market
North America currently holds the largest market share, followed by Europe and Asia Pacific. Within these regions, the United States and Germany are dominant countries driven by factors such as strong healthcare infrastructure, robust IT spending, and advanced healthcare policies.
- Type: PACS systems continue to dominate the market, accounting for approximately xx% of revenue in 2025. However, VNA software is projected to show faster growth due to its ability to integrate diverse imaging modalities.
- Mode of Delivery: Cloud-hosted solutions are gaining significant traction, particularly among smaller healthcare providers, with an estimated xx% market share in 2025, surpassing on-site and hybrid models.
- Usage Model: Multiple departments and multiple sites usage models are the most prevalent, reflecting the need for enterprise-wide image management solutions.
- Imaging Modality: Computed Tomography (CT) and Magnetic Resonance Imaging (MRI) segments drive significant revenue, but ultrasound and other modalities are seeing increased adoption.
Key Drivers by Region:
- North America: Robust healthcare infrastructure, high IT spending, stringent regulatory compliance requirements.
- Europe: Growing adoption of digital imaging technologies and government initiatives promoting e-health.
- Asia Pacific: Expanding healthcare sector, increasing investments in medical infrastructure, and a rising middle class with greater access to healthcare.
VNA & PACS Market Product Developments
Recent product innovations focus on AI-powered image analysis, improved workflow automation, enhanced security features, and the integration of various imaging modalities into unified platforms. These developments cater to the increasing demand for efficient, secure, and scalable image management solutions that improve diagnostic accuracy and clinical workflows. The market is seeing a significant shift towards vendor-neutral platforms, providing greater flexibility and interoperability.
Key Drivers of VNA & PACS Market Growth
Several factors fuel VNA & PACS market growth: the escalating volume of medical images, increasing demand for efficient image management, technological advancements such as AI-powered image analysis, rising adoption of telehealth, and the increasing need for enhanced security and interoperability. Government initiatives promoting the adoption of digital health records and favorable reimbursement policies further accelerate market growth.
Challenges in the VNA & PACS Market Market
Significant challenges exist, including high initial investment costs, concerns regarding data security and privacy, the complexity of integrating different systems, and the need for skilled personnel to manage these complex systems. Interoperability issues across different vendor platforms remain a barrier. Supply chain disruptions can also impact product availability and pricing. These factors cumulatively restrain market expansion.
Emerging Opportunities in VNA & PACS Market
Significant long-term growth potential exists in several areas. The expansion of AI applications for automated image analysis, the integration of VNA and PACS with other healthcare IT systems (e.g., EHRs), and the increasing demand for cloud-based solutions present key opportunities. Strategic partnerships between technology vendors and healthcare providers can accelerate market penetration.
Leading Players in the VNA & PACS Market Sector
- IBM Corporation
- GE Healthcare
- Lexmark International Inc
- FUJIFILM Holdings Corporation
- Siemens Healthineers AG
- Koninklijke Philips NV
- Dell Technologies Inc
- McKesson Corporation
- Novarad Corporation
- Agfa-Gevaert Group
Key Milestones in VNA & PACS Market Industry
- March 2022: Philips launched Ultrasound Workspace, a vendor-neutral echocardiography platform. This highlights a growing trend toward interoperability.
- April 2022: The US DoD partnered with FUJIFILM for its Synapse PACS, showcasing the importance of standardized solutions in large organizations.
- February 2023: Avicenna.AI launched CINA-iPE, an AI-powered tool for detecting pulmonary embolism, demonstrating the increasing role of AI in medical imaging.
Strategic Outlook for VNA & PACS Market Market
The future of the VNA & PACS market is bright, driven by continued technological innovation, increased adoption rates, and strategic partnerships. The focus on cloud-based solutions, AI-powered diagnostics, and enhanced interoperability will define the market's trajectory in the coming years. Companies that adapt to these evolving trends and invest in research and development will be well-positioned for success.
VNA & PACS Market Segmentation
-
1. Imaging Modality
- 1.1. Angiography
- 1.2. Mammography
- 1.3. Computed Tomography
- 1.4. Magnetic Resonance Imaging
- 1.5. Ultrasound
- 1.6. Other Imaging Modalities
-
2. Type
- 2.1. PACS
- 2.2. VNA Software
-
3. Mode of Delivery
- 3.1. On-Site (Premise)
- 3.2. Hybrid
- 3.3. Cloud-hosted
-
4. Usage Model
- 4.1. Single Department
- 4.2. Multiple Departments
- 4.3. Multiple Sites
VNA & PACS Market Segmentation By Geography
-
1. North America
- 1.1. United States
- 1.2. Canada
- 1.3. Mexico
-
2. Europe
- 2.1. Germany
- 2.2. United Kingdom
- 2.3. France
- 2.4. Italy
- 2.5. Spain
- 2.6. Rest of Europe
-
3. Asia Pacific
- 3.1. China
- 3.2. Japan
- 3.3. India
- 3.4. Australia
- 3.5. South Korea
- 3.6. Rest of Asia Pacific
-
4. Middle East and Africa
- 4.1. GCC
- 4.2. South Africa
- 4.3. Rest of Middle East and Africa
-
5. South America
- 5.1. Brazil
- 5.2. Argentina
- 5.3. Rest of South America
VNA & PACS Market REPORT HIGHLIGHTS
| Aspects | Details |
|---|---|
| Study Period | 2019-2033 |
| Base Year | 2024 |
| Estimated Year | 2025 |
| Forecast Period | 2025-2033 |
| Historical Period | 2019-2024 |
| Growth Rate | CAGR of 5.13% from 2019-2033 |
| Segmentation |
|
Table of Contents
- 1. Introduction
- 1.1. Research Scope
- 1.2. Market Segmentation
- 1.3. Research Methodology
- 1.4. Definitions and Assumptions
- 2. Executive Summary
- 2.1. Introduction
- 3. Market Dynamics
- 3.1. Introduction
- 3.2. Market Drivers
- 3.2.1. Increasing Demand for the Universalization of Medical Image Archiving; Reducing Data Storage Costs; High-level Integration with Electronic Health Records (EHR) Industry; Compatibility of VNA with Older Data Archival Systems
- 3.3. Market Restrains
- 3.3.1. Availability of Long-Term Data Affecting the Decisions of Service Providers; Long Product Life Cycle Affecting New Sales
- 3.4. Market Trends
- 3.4.1. On-Site (Premise) Segment is Expected to Hold a Significant Share Over the Forecast Period
- 4. Market Factor Analysis
- 4.1. Porters Five Forces
- 4.2. Supply/Value Chain
- 4.3. PESTEL analysis
- 4.4. Market Entropy
- 4.5. Patent/Trademark Analysis
- 5. Global VNA & PACS Market Analysis, Insights and Forecast, 2019-2031
- 5.1. Market Analysis, Insights and Forecast - by Imaging Modality
- 5.1.1. Angiography
- 5.1.2. Mammography
- 5.1.3. Computed Tomography
- 5.1.4. Magnetic Resonance Imaging
- 5.1.5. Ultrasound
- 5.1.6. Other Imaging Modalities
- 5.2. Market Analysis, Insights and Forecast - by Type
- 5.2.1. PACS
- 5.2.2. VNA Software
- 5.3. Market Analysis, Insights and Forecast - by Mode of Delivery
- 5.3.1. On-Site (Premise)
- 5.3.2. Hybrid
- 5.3.3. Cloud-hosted
- 5.4. Market Analysis, Insights and Forecast - by Usage Model
- 5.4.1. Single Department
- 5.4.2. Multiple Departments
- 5.4.3. Multiple Sites
- 5.5. Market Analysis, Insights and Forecast - by Region
- 5.5.1. North America
- 5.5.2. Europe
- 5.5.3. Asia Pacific
- 5.5.4. Middle East and Africa
- 5.5.5. South America
- 5.1. Market Analysis, Insights and Forecast - by Imaging Modality
- 6. North America VNA & PACS Market Analysis, Insights and Forecast, 2019-2031
- 6.1. Market Analysis, Insights and Forecast - by Imaging Modality
- 6.1.1. Angiography
- 6.1.2. Mammography
- 6.1.3. Computed Tomography
- 6.1.4. Magnetic Resonance Imaging
- 6.1.5. Ultrasound
- 6.1.6. Other Imaging Modalities
- 6.2. Market Analysis, Insights and Forecast - by Type
- 6.2.1. PACS
- 6.2.2. VNA Software
- 6.3. Market Analysis, Insights and Forecast - by Mode of Delivery
- 6.3.1. On-Site (Premise)
- 6.3.2. Hybrid
- 6.3.3. Cloud-hosted
- 6.4. Market Analysis, Insights and Forecast - by Usage Model
- 6.4.1. Single Department
- 6.4.2. Multiple Departments
- 6.4.3. Multiple Sites
- 6.1. Market Analysis, Insights and Forecast - by Imaging Modality
- 7. Europe VNA & PACS Market Analysis, Insights and Forecast, 2019-2031
- 7.1. Market Analysis, Insights and Forecast - by Imaging Modality
- 7.1.1. Angiography
- 7.1.2. Mammography
- 7.1.3. Computed Tomography
- 7.1.4. Magnetic Resonance Imaging
- 7.1.5. Ultrasound
- 7.1.6. Other Imaging Modalities
- 7.2. Market Analysis, Insights and Forecast - by Type
- 7.2.1. PACS
- 7.2.2. VNA Software
- 7.3. Market Analysis, Insights and Forecast - by Mode of Delivery
- 7.3.1. On-Site (Premise)
- 7.3.2. Hybrid
- 7.3.3. Cloud-hosted
- 7.4. Market Analysis, Insights and Forecast - by Usage Model
- 7.4.1. Single Department
- 7.4.2. Multiple Departments
- 7.4.3. Multiple Sites
- 7.1. Market Analysis, Insights and Forecast - by Imaging Modality
- 8. Asia Pacific VNA & PACS Market Analysis, Insights and Forecast, 2019-2031
- 8.1. Market Analysis, Insights and Forecast - by Imaging Modality
- 8.1.1. Angiography
- 8.1.2. Mammography
- 8.1.3. Computed Tomography
- 8.1.4. Magnetic Resonance Imaging
- 8.1.5. Ultrasound
- 8.1.6. Other Imaging Modalities
- 8.2. Market Analysis, Insights and Forecast - by Type
- 8.2.1. PACS
- 8.2.2. VNA Software
- 8.3. Market Analysis, Insights and Forecast - by Mode of Delivery
- 8.3.1. On-Site (Premise)
- 8.3.2. Hybrid
- 8.3.3. Cloud-hosted
- 8.4. Market Analysis, Insights and Forecast - by Usage Model
- 8.4.1. Single Department
- 8.4.2. Multiple Departments
- 8.4.3. Multiple Sites
- 8.1. Market Analysis, Insights and Forecast - by Imaging Modality
- 9. Middle East and Africa VNA & PACS Market Analysis, Insights and Forecast, 2019-2031
- 9.1. Market Analysis, Insights and Forecast - by Imaging Modality
- 9.1.1. Angiography
- 9.1.2. Mammography
- 9.1.3. Computed Tomography
- 9.1.4. Magnetic Resonance Imaging
- 9.1.5. Ultrasound
- 9.1.6. Other Imaging Modalities
- 9.2. Market Analysis, Insights and Forecast - by Type
- 9.2.1. PACS
- 9.2.2. VNA Software
- 9.3. Market Analysis, Insights and Forecast - by Mode of Delivery
- 9.3.1. On-Site (Premise)
- 9.3.2. Hybrid
- 9.3.3. Cloud-hosted
- 9.4. Market Analysis, Insights and Forecast - by Usage Model
- 9.4.1. Single Department
- 9.4.2. Multiple Departments
- 9.4.3. Multiple Sites
- 9.1. Market Analysis, Insights and Forecast - by Imaging Modality
- 10. South America VNA & PACS Market Analysis, Insights and Forecast, 2019-2031
- 10.1. Market Analysis, Insights and Forecast - by Imaging Modality
- 10.1.1. Angiography
- 10.1.2. Mammography
- 10.1.3. Computed Tomography
- 10.1.4. Magnetic Resonance Imaging
- 10.1.5. Ultrasound
- 10.1.6. Other Imaging Modalities
- 10.2. Market Analysis, Insights and Forecast - by Type
- 10.2.1. PACS
- 10.2.2. VNA Software
- 10.3. Market Analysis, Insights and Forecast - by Mode of Delivery
- 10.3.1. On-Site (Premise)
- 10.3.2. Hybrid
- 10.3.3. Cloud-hosted
- 10.4. Market Analysis, Insights and Forecast - by Usage Model
- 10.4.1. Single Department
- 10.4.2. Multiple Departments
- 10.4.3. Multiple Sites
- 10.1. Market Analysis, Insights and Forecast - by Imaging Modality
- 11. North America VNA & PACS Market Analysis, Insights and Forecast, 2019-2031
- 11.1. Market Analysis, Insights and Forecast - By Country/Sub-region
- 11.1.1 United States
- 11.1.2 Canada
- 11.1.3 Mexico
- 12. Europe VNA & PACS Market Analysis, Insights and Forecast, 2019-2031
- 12.1. Market Analysis, Insights and Forecast - By Country/Sub-region
- 12.1.1 Germany
- 12.1.2 United Kingdom
- 12.1.3 France
- 12.1.4 Italy
- 12.1.5 Spain
- 12.1.6 Rest of Europe
- 13. Asia Pacific VNA & PACS Market Analysis, Insights and Forecast, 2019-2031
- 13.1. Market Analysis, Insights and Forecast - By Country/Sub-region
- 13.1.1 China
- 13.1.2 Japan
- 13.1.3 India
- 13.1.4 Australia
- 13.1.5 South Korea
- 13.1.6 Rest of Asia Pacific
- 14. Middle East and Africa VNA & PACS Market Analysis, Insights and Forecast, 2019-2031
- 14.1. Market Analysis, Insights and Forecast - By Country/Sub-region
- 14.1.1 GCC
- 14.1.2 South Africa
- 14.1.3 Rest of Middle East and Africa
- 15. South America VNA & PACS Market Analysis, Insights and Forecast, 2019-2031
- 15.1. Market Analysis, Insights and Forecast - By Country/Sub-region
- 15.1.1 Brazil
- 15.1.2 Argentina
- 15.1.3 Rest of South America
- 16. Competitive Analysis
- 16.1. Global Market Share Analysis 2024
- 16.2. Company Profiles
- 16.2.1 IBM Corporation
- 16.2.1.1. Overview
- 16.2.1.2. Products
- 16.2.1.3. SWOT Analysis
- 16.2.1.4. Recent Developments
- 16.2.1.5. Financials (Based on Availability)
- 16.2.2 GE Healthcare
- 16.2.2.1. Overview
- 16.2.2.2. Products
- 16.2.2.3. SWOT Analysis
- 16.2.2.4. Recent Developments
- 16.2.2.5. Financials (Based on Availability)
- 16.2.3 Lexmark International Inc
- 16.2.3.1. Overview
- 16.2.3.2. Products
- 16.2.3.3. SWOT Analysis
- 16.2.3.4. Recent Developments
- 16.2.3.5. Financials (Based on Availability)
- 16.2.4 FUJIFILM Holdings Corporation
- 16.2.4.1. Overview
- 16.2.4.2. Products
- 16.2.4.3. SWOT Analysis
- 16.2.4.4. Recent Developments
- 16.2.4.5. Financials (Based on Availability)
- 16.2.5 Siemens Healthineers AG
- 16.2.5.1. Overview
- 16.2.5.2. Products
- 16.2.5.3. SWOT Analysis
- 16.2.5.4. Recent Developments
- 16.2.5.5. Financials (Based on Availability)
- 16.2.6 Koninklijke Philips NV
- 16.2.6.1. Overview
- 16.2.6.2. Products
- 16.2.6.3. SWOT Analysis
- 16.2.6.4. Recent Developments
- 16.2.6.5. Financials (Based on Availability)
- 16.2.7 Dell Technologies Inc
- 16.2.7.1. Overview
- 16.2.7.2. Products
- 16.2.7.3. SWOT Analysis
- 16.2.7.4. Recent Developments
- 16.2.7.5. Financials (Based on Availability)
- 16.2.8 McKesson Corporation
- 16.2.8.1. Overview
- 16.2.8.2. Products
- 16.2.8.3. SWOT Analysis
- 16.2.8.4. Recent Developments
- 16.2.8.5. Financials (Based on Availability)
- 16.2.9 Novarad Corporation
- 16.2.9.1. Overview
- 16.2.9.2. Products
- 16.2.9.3. SWOT Analysis
- 16.2.9.4. Recent Developments
- 16.2.9.5. Financials (Based on Availability)
- 16.2.10 Agfa-Gevaert Group
- 16.2.10.1. Overview
- 16.2.10.2. Products
- 16.2.10.3. SWOT Analysis
- 16.2.10.4. Recent Developments
- 16.2.10.5. Financials (Based on Availability)
- 16.2.1 IBM Corporation
List of Figures
- Figure 1: Global VNA & PACS Market Revenue Breakdown (Million, %) by Region 2024 & 2032
- Figure 2: Global VNA & PACS Market Volume Breakdown (K Unit, %) by Region 2024 & 2032
- Figure 3: North America VNA & PACS Market Revenue (Million), by Country 2024 & 2032
- Figure 4: North America VNA & PACS Market Volume (K Unit), by Country 2024 & 2032
- Figure 5: North America VNA & PACS Market Revenue Share (%), by Country 2024 & 2032
- Figure 6: North America VNA & PACS Market Volume Share (%), by Country 2024 & 2032
- Figure 7: Europe VNA & PACS Market Revenue (Million), by Country 2024 & 2032
- Figure 8: Europe VNA & PACS Market Volume (K Unit), by Country 2024 & 2032
- Figure 9: Europe VNA & PACS Market Revenue Share (%), by Country 2024 & 2032
- Figure 10: Europe VNA & PACS Market Volume Share (%), by Country 2024 & 2032
- Figure 11: Asia Pacific VNA & PACS Market Revenue (Million), by Country 2024 & 2032
- Figure 12: Asia Pacific VNA & PACS Market Volume (K Unit), by Country 2024 & 2032
- Figure 13: Asia Pacific VNA & PACS Market Revenue Share (%), by Country 2024 & 2032
- Figure 14: Asia Pacific VNA & PACS Market Volume Share (%), by Country 2024 & 2032
- Figure 15: Middle East and Africa VNA & PACS Market Revenue (Million), by Country 2024 & 2032
- Figure 16: Middle East and Africa VNA & PACS Market Volume (K Unit), by Country 2024 & 2032
- Figure 17: Middle East and Africa VNA & PACS Market Revenue Share (%), by Country 2024 & 2032
- Figure 18: Middle East and Africa VNA & PACS Market Volume Share (%), by Country 2024 & 2032
- Figure 19: South America VNA & PACS Market Revenue (Million), by Country 2024 & 2032
- Figure 20: South America VNA & PACS Market Volume (K Unit), by Country 2024 & 2032
- Figure 21: South America VNA & PACS Market Revenue Share (%), by Country 2024 & 2032
- Figure 22: South America VNA & PACS Market Volume Share (%), by Country 2024 & 2032
- Figure 23: North America VNA & PACS Market Revenue (Million), by Imaging Modality 2024 & 2032
- Figure 24: North America VNA & PACS Market Volume (K Unit), by Imaging Modality 2024 & 2032
- Figure 25: North America VNA & PACS Market Revenue Share (%), by Imaging Modality 2024 & 2032
- Figure 26: North America VNA & PACS Market Volume Share (%), by Imaging Modality 2024 & 2032
- Figure 27: North America VNA & PACS Market Revenue (Million), by Type 2024 & 2032
- Figure 28: North America VNA & PACS Market Volume (K Unit), by Type 2024 & 2032
- Figure 29: North America VNA & PACS Market Revenue Share (%), by Type 2024 & 2032
- Figure 30: North America VNA & PACS Market Volume Share (%), by Type 2024 & 2032
- Figure 31: North America VNA & PACS Market Revenue (Million), by Mode of Delivery 2024 & 2032
- Figure 32: North America VNA & PACS Market Volume (K Unit), by Mode of Delivery 2024 & 2032
- Figure 33: North America VNA & PACS Market Revenue Share (%), by Mode of Delivery 2024 & 2032
- Figure 34: North America VNA & PACS Market Volume Share (%), by Mode of Delivery 2024 & 2032
- Figure 35: North America VNA & PACS Market Revenue (Million), by Usage Model 2024 & 2032
- Figure 36: North America VNA & PACS Market Volume (K Unit), by Usage Model 2024 & 2032
- Figure 37: North America VNA & PACS Market Revenue Share (%), by Usage Model 2024 & 2032
- Figure 38: North America VNA & PACS Market Volume Share (%), by Usage Model 2024 & 2032
- Figure 39: North America VNA & PACS Market Revenue (Million), by Country 2024 & 2032
- Figure 40: North America VNA & PACS Market Volume (K Unit), by Country 2024 & 2032
- Figure 41: North America VNA & PACS Market Revenue Share (%), by Country 2024 & 2032
- Figure 42: North America VNA & PACS Market Volume Share (%), by Country 2024 & 2032
- Figure 43: Europe VNA & PACS Market Revenue (Million), by Imaging Modality 2024 & 2032
- Figure 44: Europe VNA & PACS Market Volume (K Unit), by Imaging Modality 2024 & 2032
- Figure 45: Europe VNA & PACS Market Revenue Share (%), by Imaging Modality 2024 & 2032
- Figure 46: Europe VNA & PACS Market Volume Share (%), by Imaging Modality 2024 & 2032
- Figure 47: Europe VNA & PACS Market Revenue (Million), by Type 2024 & 2032
- Figure 48: Europe VNA & PACS Market Volume (K Unit), by Type 2024 & 2032
- Figure 49: Europe VNA & PACS Market Revenue Share (%), by Type 2024 & 2032
- Figure 50: Europe VNA & PACS Market Volume Share (%), by Type 2024 & 2032
- Figure 51: Europe VNA & PACS Market Revenue (Million), by Mode of Delivery 2024 & 2032
- Figure 52: Europe VNA & PACS Market Volume (K Unit), by Mode of Delivery 2024 & 2032
- Figure 53: Europe VNA & PACS Market Revenue Share (%), by Mode of Delivery 2024 & 2032
- Figure 54: Europe VNA & PACS Market Volume Share (%), by Mode of Delivery 2024 & 2032
- Figure 55: Europe VNA & PACS Market Revenue (Million), by Usage Model 2024 & 2032
- Figure 56: Europe VNA & PACS Market Volume (K Unit), by Usage Model 2024 & 2032
- Figure 57: Europe VNA & PACS Market Revenue Share (%), by Usage Model 2024 & 2032
- Figure 58: Europe VNA & PACS Market Volume Share (%), by Usage Model 2024 & 2032
- Figure 59: Europe VNA & PACS Market Revenue (Million), by Country 2024 & 2032
- Figure 60: Europe VNA & PACS Market Volume (K Unit), by Country 2024 & 2032
- Figure 61: Europe VNA & PACS Market Revenue Share (%), by Country 2024 & 2032
- Figure 62: Europe VNA & PACS Market Volume Share (%), by Country 2024 & 2032
- Figure 63: Asia Pacific VNA & PACS Market Revenue (Million), by Imaging Modality 2024 & 2032
- Figure 64: Asia Pacific VNA & PACS Market Volume (K Unit), by Imaging Modality 2024 & 2032
- Figure 65: Asia Pacific VNA & PACS Market Revenue Share (%), by Imaging Modality 2024 & 2032
- Figure 66: Asia Pacific VNA & PACS Market Volume Share (%), by Imaging Modality 2024 & 2032
- Figure 67: Asia Pacific VNA & PACS Market Revenue (Million), by Type 2024 & 2032
- Figure 68: Asia Pacific VNA & PACS Market Volume (K Unit), by Type 2024 & 2032
- Figure 69: Asia Pacific VNA & PACS Market Revenue Share (%), by Type 2024 & 2032
- Figure 70: Asia Pacific VNA & PACS Market Volume Share (%), by Type 2024 & 2032
- Figure 71: Asia Pacific VNA & PACS Market Revenue (Million), by Mode of Delivery 2024 & 2032
- Figure 72: Asia Pacific VNA & PACS Market Volume (K Unit), by Mode of Delivery 2024 & 2032
- Figure 73: Asia Pacific VNA & PACS Market Revenue Share (%), by Mode of Delivery 2024 & 2032
- Figure 74: Asia Pacific VNA & PACS Market Volume Share (%), by Mode of Delivery 2024 & 2032
- Figure 75: Asia Pacific VNA & PACS Market Revenue (Million), by Usage Model 2024 & 2032
- Figure 76: Asia Pacific VNA & PACS Market Volume (K Unit), by Usage Model 2024 & 2032
- Figure 77: Asia Pacific VNA & PACS Market Revenue Share (%), by Usage Model 2024 & 2032
- Figure 78: Asia Pacific VNA & PACS Market Volume Share (%), by Usage Model 2024 & 2032
- Figure 79: Asia Pacific VNA & PACS Market Revenue (Million), by Country 2024 & 2032
- Figure 80: Asia Pacific VNA & PACS Market Volume (K Unit), by Country 2024 & 2032
- Figure 81: Asia Pacific VNA & PACS Market Revenue Share (%), by Country 2024 & 2032
- Figure 82: Asia Pacific VNA & PACS Market Volume Share (%), by Country 2024 & 2032
- Figure 83: Middle East and Africa VNA & PACS Market Revenue (Million), by Imaging Modality 2024 & 2032
- Figure 84: Middle East and Africa VNA & PACS Market Volume (K Unit), by Imaging Modality 2024 & 2032
- Figure 85: Middle East and Africa VNA & PACS Market Revenue Share (%), by Imaging Modality 2024 & 2032
- Figure 86: Middle East and Africa VNA & PACS Market Volume Share (%), by Imaging Modality 2024 & 2032
- Figure 87: Middle East and Africa VNA & PACS Market Revenue (Million), by Type 2024 & 2032
- Figure 88: Middle East and Africa VNA & PACS Market Volume (K Unit), by Type 2024 & 2032
- Figure 89: Middle East and Africa VNA & PACS Market Revenue Share (%), by Type 2024 & 2032
- Figure 90: Middle East and Africa VNA & PACS Market Volume Share (%), by Type 2024 & 2032
- Figure 91: Middle East and Africa VNA & PACS Market Revenue (Million), by Mode of Delivery 2024 & 2032
- Figure 92: Middle East and Africa VNA & PACS Market Volume (K Unit), by Mode of Delivery 2024 & 2032
- Figure 93: Middle East and Africa VNA & PACS Market Revenue Share (%), by Mode of Delivery 2024 & 2032
- Figure 94: Middle East and Africa VNA & PACS Market Volume Share (%), by Mode of Delivery 2024 & 2032
- Figure 95: Middle East and Africa VNA & PACS Market Revenue (Million), by Usage Model 2024 & 2032
- Figure 96: Middle East and Africa VNA & PACS Market Volume (K Unit), by Usage Model 2024 & 2032
- Figure 97: Middle East and Africa VNA & PACS Market Revenue Share (%), by Usage Model 2024 & 2032
- Figure 98: Middle East and Africa VNA & PACS Market Volume Share (%), by Usage Model 2024 & 2032
- Figure 99: Middle East and Africa VNA & PACS Market Revenue (Million), by Country 2024 & 2032
- Figure 100: Middle East and Africa VNA & PACS Market Volume (K Unit), by Country 2024 & 2032
- Figure 101: Middle East and Africa VNA & PACS Market Revenue Share (%), by Country 2024 & 2032
- Figure 102: Middle East and Africa VNA & PACS Market Volume Share (%), by Country 2024 & 2032
- Figure 103: South America VNA & PACS Market Revenue (Million), by Imaging Modality 2024 & 2032
- Figure 104: South America VNA & PACS Market Volume (K Unit), by Imaging Modality 2024 & 2032
- Figure 105: South America VNA & PACS Market Revenue Share (%), by Imaging Modality 2024 & 2032
- Figure 106: South America VNA & PACS Market Volume Share (%), by Imaging Modality 2024 & 2032
- Figure 107: South America VNA & PACS Market Revenue (Million), by Type 2024 & 2032
- Figure 108: South America VNA & PACS Market Volume (K Unit), by Type 2024 & 2032
- Figure 109: South America VNA & PACS Market Revenue Share (%), by Type 2024 & 2032
- Figure 110: South America VNA & PACS Market Volume Share (%), by Type 2024 & 2032
- Figure 111: South America VNA & PACS Market Revenue (Million), by Mode of Delivery 2024 & 2032
- Figure 112: South America VNA & PACS Market Volume (K Unit), by Mode of Delivery 2024 & 2032
- Figure 113: South America VNA & PACS Market Revenue Share (%), by Mode of Delivery 2024 & 2032
- Figure 114: South America VNA & PACS Market Volume Share (%), by Mode of Delivery 2024 & 2032
- Figure 115: South America VNA & PACS Market Revenue (Million), by Usage Model 2024 & 2032
- Figure 116: South America VNA & PACS Market Volume (K Unit), by Usage Model 2024 & 2032
- Figure 117: South America VNA & PACS Market Revenue Share (%), by Usage Model 2024 & 2032
- Figure 118: South America VNA & PACS Market Volume Share (%), by Usage Model 2024 & 2032
- Figure 119: South America VNA & PACS Market Revenue (Million), by Country 2024 & 2032
- Figure 120: South America VNA & PACS Market Volume (K Unit), by Country 2024 & 2032
- Figure 121: South America VNA & PACS Market Revenue Share (%), by Country 2024 & 2032
- Figure 122: South America VNA & PACS Market Volume Share (%), by Country 2024 & 2032
List of Tables
- Table 1: Global VNA & PACS Market Revenue Million Forecast, by Region 2019 & 2032
- Table 2: Global VNA & PACS Market Volume K Unit Forecast, by Region 2019 & 2032
- Table 3: Global VNA & PACS Market Revenue Million Forecast, by Imaging Modality 2019 & 2032
- Table 4: Global VNA & PACS Market Volume K Unit Forecast, by Imaging Modality 2019 & 2032
- Table 5: Global VNA & PACS Market Revenue Million Forecast, by Type 2019 & 2032
- Table 6: Global VNA & PACS Market Volume K Unit Forecast, by Type 2019 & 2032
- Table 7: Global VNA & PACS Market Revenue Million Forecast, by Mode of Delivery 2019 & 2032
- Table 8: Global VNA & PACS Market Volume K Unit Forecast, by Mode of Delivery 2019 & 2032
- Table 9: Global VNA & PACS Market Revenue Million Forecast, by Usage Model 2019 & 2032
- Table 10: Global VNA & PACS Market Volume K Unit Forecast, by Usage Model 2019 & 2032
- Table 11: Global VNA & PACS Market Revenue Million Forecast, by Region 2019 & 2032
- Table 12: Global VNA & PACS Market Volume K Unit Forecast, by Region 2019 & 2032
- Table 13: Global VNA & PACS Market Revenue Million Forecast, by Country 2019 & 2032
- Table 14: Global VNA & PACS Market Volume K Unit Forecast, by Country 2019 & 2032
- Table 15: United States VNA & PACS Market Revenue (Million) Forecast, by Application 2019 & 2032
- Table 16: United States VNA & PACS Market Volume (K Unit) Forecast, by Application 2019 & 2032
- Table 17: Canada VNA & PACS Market Revenue (Million) Forecast, by Application 2019 & 2032
- Table 18: Canada VNA & PACS Market Volume (K Unit) Forecast, by Application 2019 & 2032
- Table 19: Mexico VNA & PACS Market Revenue (Million) Forecast, by Application 2019 & 2032
- Table 20: Mexico VNA & PACS Market Volume (K Unit) Forecast, by Application 2019 & 2032
- Table 21: Global VNA & PACS Market Revenue Million Forecast, by Country 2019 & 2032
- Table 22: Global VNA & PACS Market Volume K Unit Forecast, by Country 2019 & 2032
- Table 23: Germany VNA & PACS Market Revenue (Million) Forecast, by Application 2019 & 2032
- Table 24: Germany VNA & PACS Market Volume (K Unit) Forecast, by Application 2019 & 2032
- Table 25: United Kingdom VNA & PACS Market Revenue (Million) Forecast, by Application 2019 & 2032
- Table 26: United Kingdom VNA & PACS Market Volume (K Unit) Forecast, by Application 2019 & 2032
- Table 27: France VNA & PACS Market Revenue (Million) Forecast, by Application 2019 & 2032
- Table 28: France VNA & PACS Market Volume (K Unit) Forecast, by Application 2019 & 2032
- Table 29: Italy VNA & PACS Market Revenue (Million) Forecast, by Application 2019 & 2032
- Table 30: Italy VNA & PACS Market Volume (K Unit) Forecast, by Application 2019 & 2032
- Table 31: Spain VNA & PACS Market Revenue (Million) Forecast, by Application 2019 & 2032
- Table 32: Spain VNA & PACS Market Volume (K Unit) Forecast, by Application 2019 & 2032
- Table 33: Rest of Europe VNA & PACS Market Revenue (Million) Forecast, by Application 2019 & 2032
- Table 34: Rest of Europe VNA & PACS Market Volume (K Unit) Forecast, by Application 2019 & 2032
- Table 35: Global VNA & PACS Market Revenue Million Forecast, by Country 2019 & 2032
- Table 36: Global VNA & PACS Market Volume K Unit Forecast, by Country 2019 & 2032
- Table 37: China VNA & PACS Market Revenue (Million) Forecast, by Application 2019 & 2032
- Table 38: China VNA & PACS Market Volume (K Unit) Forecast, by Application 2019 & 2032
- Table 39: Japan VNA & PACS Market Revenue (Million) Forecast, by Application 2019 & 2032
- Table 40: Japan VNA & PACS Market Volume (K Unit) Forecast, by Application 2019 & 2032
- Table 41: India VNA & PACS Market Revenue (Million) Forecast, by Application 2019 & 2032
- Table 42: India VNA & PACS Market Volume (K Unit) Forecast, by Application 2019 & 2032
- Table 43: Australia VNA & PACS Market Revenue (Million) Forecast, by Application 2019 & 2032
- Table 44: Australia VNA & PACS Market Volume (K Unit) Forecast, by Application 2019 & 2032
- Table 45: South Korea VNA & PACS Market Revenue (Million) Forecast, by Application 2019 & 2032
- Table 46: South Korea VNA & PACS Market Volume (K Unit) Forecast, by Application 2019 & 2032
- Table 47: Rest of Asia Pacific VNA & PACS Market Revenue (Million) Forecast, by Application 2019 & 2032
- Table 48: Rest of Asia Pacific VNA & PACS Market Volume (K Unit) Forecast, by Application 2019 & 2032
- Table 49: Global VNA & PACS Market Revenue Million Forecast, by Country 2019 & 2032
- Table 50: Global VNA & PACS Market Volume K Unit Forecast, by Country 2019 & 2032
- Table 51: GCC VNA & PACS Market Revenue (Million) Forecast, by Application 2019 & 2032
- Table 52: GCC VNA & PACS Market Volume (K Unit) Forecast, by Application 2019 & 2032
- Table 53: South Africa VNA & PACS Market Revenue (Million) Forecast, by Application 2019 & 2032
- Table 54: South Africa VNA & PACS Market Volume (K Unit) Forecast, by Application 2019 & 2032
- Table 55: Rest of Middle East and Africa VNA & PACS Market Revenue (Million) Forecast, by Application 2019 & 2032
- Table 56: Rest of Middle East and Africa VNA & PACS Market Volume (K Unit) Forecast, by Application 2019 & 2032
- Table 57: Global VNA & PACS Market Revenue Million Forecast, by Country 2019 & 2032
- Table 58: Global VNA & PACS Market Volume K Unit Forecast, by Country 2019 & 2032
- Table 59: Brazil VNA & PACS Market Revenue (Million) Forecast, by Application 2019 & 2032
- Table 60: Brazil VNA & PACS Market Volume (K Unit) Forecast, by Application 2019 & 2032
- Table 61: Argentina VNA & PACS Market Revenue (Million) Forecast, by Application 2019 & 2032
- Table 62: Argentina VNA & PACS Market Volume (K Unit) Forecast, by Application 2019 & 2032
- Table 63: Rest of South America VNA & PACS Market Revenue (Million) Forecast, by Application 2019 & 2032
- Table 64: Rest of South America VNA & PACS Market Volume (K Unit) Forecast, by Application 2019 & 2032
- Table 65: Global VNA & PACS Market Revenue Million Forecast, by Imaging Modality 2019 & 2032
- Table 66: Global VNA & PACS Market Volume K Unit Forecast, by Imaging Modality 2019 & 2032
- Table 67: Global VNA & PACS Market Revenue Million Forecast, by Type 2019 & 2032
- Table 68: Global VNA & PACS Market Volume K Unit Forecast, by Type 2019 & 2032
- Table 69: Global VNA & PACS Market Revenue Million Forecast, by Mode of Delivery 2019 & 2032
- Table 70: Global VNA & PACS Market Volume K Unit Forecast, by Mode of Delivery 2019 & 2032
- Table 71: Global VNA & PACS Market Revenue Million Forecast, by Usage Model 2019 & 2032
- Table 72: Global VNA & PACS Market Volume K Unit Forecast, by Usage Model 2019 & 2032
- Table 73: Global VNA & PACS Market Revenue Million Forecast, by Country 2019 & 2032
- Table 74: Global VNA & PACS Market Volume K Unit Forecast, by Country 2019 & 2032
- Table 75: United States VNA & PACS Market Revenue (Million) Forecast, by Application 2019 & 2032
- Table 76: United States VNA & PACS Market Volume (K Unit) Forecast, by Application 2019 & 2032
- Table 77: Canada VNA & PACS Market Revenue (Million) Forecast, by Application 2019 & 2032
- Table 78: Canada VNA & PACS Market Volume (K Unit) Forecast, by Application 2019 & 2032
- Table 79: Mexico VNA & PACS Market Revenue (Million) Forecast, by Application 2019 & 2032
- Table 80: Mexico VNA & PACS Market Volume (K Unit) Forecast, by Application 2019 & 2032
- Table 81: Global VNA & PACS Market Revenue Million Forecast, by Imaging Modality 2019 & 2032
- Table 82: Global VNA & PACS Market Volume K Unit Forecast, by Imaging Modality 2019 & 2032
- Table 83: Global VNA & PACS Market Revenue Million Forecast, by Type 2019 & 2032
- Table 84: Global VNA & PACS Market Volume K Unit Forecast, by Type 2019 & 2032
- Table 85: Global VNA & PACS Market Revenue Million Forecast, by Mode of Delivery 2019 & 2032
- Table 86: Global VNA & PACS Market Volume K Unit Forecast, by Mode of Delivery 2019 & 2032
- Table 87: Global VNA & PACS Market Revenue Million Forecast, by Usage Model 2019 & 2032
- Table 88: Global VNA & PACS Market Volume K Unit Forecast, by Usage Model 2019 & 2032
- Table 89: Global VNA & PACS Market Revenue Million Forecast, by Country 2019 & 2032
- Table 90: Global VNA & PACS Market Volume K Unit Forecast, by Country 2019 & 2032
- Table 91: Germany VNA & PACS Market Revenue (Million) Forecast, by Application 2019 & 2032
- Table 92: Germany VNA & PACS Market Volume (K Unit) Forecast, by Application 2019 & 2032
- Table 93: United Kingdom VNA & PACS Market Revenue (Million) Forecast, by Application 2019 & 2032
- Table 94: United Kingdom VNA & PACS Market Volume (K Unit) Forecast, by Application 2019 & 2032
- Table 95: France VNA & PACS Market Revenue (Million) Forecast, by Application 2019 & 2032
- Table 96: France VNA & PACS Market Volume (K Unit) Forecast, by Application 2019 & 2032
- Table 97: Italy VNA & PACS Market Revenue (Million) Forecast, by Application 2019 & 2032
- Table 98: Italy VNA & PACS Market Volume (K Unit) Forecast, by Application 2019 & 2032
- Table 99: Spain VNA & PACS Market Revenue (Million) Forecast, by Application 2019 & 2032
- Table 100: Spain VNA & PACS Market Volume (K Unit) Forecast, by Application 2019 & 2032
- Table 101: Rest of Europe VNA & PACS Market Revenue (Million) Forecast, by Application 2019 & 2032
- Table 102: Rest of Europe VNA & PACS Market Volume (K Unit) Forecast, by Application 2019 & 2032
- Table 103: Global VNA & PACS Market Revenue Million Forecast, by Imaging Modality 2019 & 2032
- Table 104: Global VNA & PACS Market Volume K Unit Forecast, by Imaging Modality 2019 & 2032
- Table 105: Global VNA & PACS Market Revenue Million Forecast, by Type 2019 & 2032
- Table 106: Global VNA & PACS Market Volume K Unit Forecast, by Type 2019 & 2032
- Table 107: Global VNA & PACS Market Revenue Million Forecast, by Mode of Delivery 2019 & 2032
- Table 108: Global VNA & PACS Market Volume K Unit Forecast, by Mode of Delivery 2019 & 2032
- Table 109: Global VNA & PACS Market Revenue Million Forecast, by Usage Model 2019 & 2032
- Table 110: Global VNA & PACS Market Volume K Unit Forecast, by Usage Model 2019 & 2032
- Table 111: Global VNA & PACS Market Revenue Million Forecast, by Country 2019 & 2032
- Table 112: Global VNA & PACS Market Volume K Unit Forecast, by Country 2019 & 2032
- Table 113: China VNA & PACS Market Revenue (Million) Forecast, by Application 2019 & 2032
- Table 114: China VNA & PACS Market Volume (K Unit) Forecast, by Application 2019 & 2032
- Table 115: Japan VNA & PACS Market Revenue (Million) Forecast, by Application 2019 & 2032
- Table 116: Japan VNA & PACS Market Volume (K Unit) Forecast, by Application 2019 & 2032
- Table 117: India VNA & PACS Market Revenue (Million) Forecast, by Application 2019 & 2032
- Table 118: India VNA & PACS Market Volume (K Unit) Forecast, by Application 2019 & 2032
- Table 119: Australia VNA & PACS Market Revenue (Million) Forecast, by Application 2019 & 2032
- Table 120: Australia VNA & PACS Market Volume (K Unit) Forecast, by Application 2019 & 2032
- Table 121: South Korea VNA & PACS Market Revenue (Million) Forecast, by Application 2019 & 2032
- Table 122: South Korea VNA & PACS Market Volume (K Unit) Forecast, by Application 2019 & 2032
- Table 123: Rest of Asia Pacific VNA & PACS Market Revenue (Million) Forecast, by Application 2019 & 2032
- Table 124: Rest of Asia Pacific VNA & PACS Market Volume (K Unit) Forecast, by Application 2019 & 2032
- Table 125: Global VNA & PACS Market Revenue Million Forecast, by Imaging Modality 2019 & 2032
- Table 126: Global VNA & PACS Market Volume K Unit Forecast, by Imaging Modality 2019 & 2032
- Table 127: Global VNA & PACS Market Revenue Million Forecast, by Type 2019 & 2032
- Table 128: Global VNA & PACS Market Volume K Unit Forecast, by Type 2019 & 2032
- Table 129: Global VNA & PACS Market Revenue Million Forecast, by Mode of Delivery 2019 & 2032
- Table 130: Global VNA & PACS Market Volume K Unit Forecast, by Mode of Delivery 2019 & 2032
- Table 131: Global VNA & PACS Market Revenue Million Forecast, by Usage Model 2019 & 2032
- Table 132: Global VNA & PACS Market Volume K Unit Forecast, by Usage Model 2019 & 2032
- Table 133: Global VNA & PACS Market Revenue Million Forecast, by Country 2019 & 2032
- Table 134: Global VNA & PACS Market Volume K Unit Forecast, by Country 2019 & 2032
- Table 135: GCC VNA & PACS Market Revenue (Million) Forecast, by Application 2019 & 2032
- Table 136: GCC VNA & PACS Market Volume (K Unit) Forecast, by Application 2019 & 2032
- Table 137: South Africa VNA & PACS Market Revenue (Million) Forecast, by Application 2019 & 2032
- Table 138: South Africa VNA & PACS Market Volume (K Unit) Forecast, by Application 2019 & 2032
- Table 139: Rest of Middle East and Africa VNA & PACS Market Revenue (Million) Forecast, by Application 2019 & 2032
- Table 140: Rest of Middle East and Africa VNA & PACS Market Volume (K Unit) Forecast, by Application 2019 & 2032
- Table 141: Global VNA & PACS Market Revenue Million Forecast, by Imaging Modality 2019 & 2032
- Table 142: Global VNA & PACS Market Volume K Unit Forecast, by Imaging Modality 2019 & 2032
- Table 143: Global VNA & PACS Market Revenue Million Forecast, by Type 2019 & 2032
- Table 144: Global VNA & PACS Market Volume K Unit Forecast, by Type 2019 & 2032
- Table 145: Global VNA & PACS Market Revenue Million Forecast, by Mode of Delivery 2019 & 2032
- Table 146: Global VNA & PACS Market Volume K Unit Forecast, by Mode of Delivery 2019 & 2032
- Table 147: Global VNA & PACS Market Revenue Million Forecast, by Usage Model 2019 & 2032
- Table 148: Global VNA & PACS Market Volume K Unit Forecast, by Usage Model 2019 & 2032
- Table 149: Global VNA & PACS Market Revenue Million Forecast, by Country 2019 & 2032
- Table 150: Global VNA & PACS Market Volume K Unit Forecast, by Country 2019 & 2032
- Table 151: Brazil VNA & PACS Market Revenue (Million) Forecast, by Application 2019 & 2032
- Table 152: Brazil VNA & PACS Market Volume (K Unit) Forecast, by Application 2019 & 2032
- Table 153: Argentina VNA & PACS Market Revenue (Million) Forecast, by Application 2019 & 2032
- Table 154: Argentina VNA & PACS Market Volume (K Unit) Forecast, by Application 2019 & 2032
- Table 155: Rest of South America VNA & PACS Market Revenue (Million) Forecast, by Application 2019 & 2032
- Table 156: Rest of South America VNA & PACS Market Volume (K Unit) Forecast, by Application 2019 & 2032
Frequently Asked Questions
1. What is the projected Compound Annual Growth Rate (CAGR) of the VNA & PACS Market?
The projected CAGR is approximately 5.13%.
2. Which companies are prominent players in the VNA & PACS Market?
Key companies in the market include IBM Corporation, GE Healthcare, Lexmark International Inc, FUJIFILM Holdings Corporation, Siemens Healthineers AG, Koninklijke Philips NV, Dell Technologies Inc, McKesson Corporation, Novarad Corporation, Agfa-Gevaert Group.
3. What are the main segments of the VNA & PACS Market?
The market segments include Imaging Modality, Type, Mode of Delivery, Usage Model.
4. Can you provide details about the market size?
The market size is estimated to be USD 3.89 Million as of 2022.
5. What are some drivers contributing to market growth?
Increasing Demand for the Universalization of Medical Image Archiving; Reducing Data Storage Costs; High-level Integration with Electronic Health Records (EHR) Industry; Compatibility of VNA with Older Data Archival Systems.
6. What are the notable trends driving market growth?
On-Site (Premise) Segment is Expected to Hold a Significant Share Over the Forecast Period.
7. Are there any restraints impacting market growth?
Availability of Long-Term Data Affecting the Decisions of Service Providers; Long Product Life Cycle Affecting New Sales.
8. Can you provide examples of recent developments in the market?
February 2023: Medical imaging company Avicenna.AI launched the AI solution CINA-iPE, a CE-marked AI tool that analyzes images from chest CT scans for the presence of incidental pulmonary embolism. CINA-iPE is the first tool in CINA Incidental, a new suite of medical imaging solutions from Avicenna.AI that detect unsuspected pathologies on CT scans.
9. What pricing options are available for accessing the report?
Pricing options include single-user, multi-user, and enterprise licenses priced at USD 4750, USD 5250, and USD 8750 respectively.
10. Is the market size provided in terms of value or volume?
The market size is provided in terms of value, measured in Million and volume, measured in K Unit.
11. Are there any specific market keywords associated with the report?
Yes, the market keyword associated with the report is "VNA & PACS Market," which aids in identifying and referencing the specific market segment covered.
12. How do I determine which pricing option suits my needs best?
The pricing options vary based on user requirements and access needs. Individual users may opt for single-user licenses, while businesses requiring broader access may choose multi-user or enterprise licenses for cost-effective access to the report.
13. Are there any additional resources or data provided in the VNA & PACS Market report?
While the report offers comprehensive insights, it's advisable to review the specific contents or supplementary materials provided to ascertain if additional resources or data are available.
14. How can I stay updated on further developments or reports in the VNA & PACS Market?
To stay informed about further developments, trends, and reports in the VNA & PACS Market, consider subscribing to industry newsletters, following relevant companies and organizations, or regularly checking reputable industry news sources and publications.
Methodology
Step 1 - Identification of Relevant Samples Size from Population Database


Step 2 - Approaches for Defining Global Market Size (Value, Volume* & Price*)

Note*: In applicable scenarios
Step 3 - Data Sources
Primary Research
- Web Analytics
- Survey Reports
- Research Institute
- Latest Research Reports
- Opinion Leaders
Secondary Research
- Annual Reports
- White Paper
- Latest Press Release
- Industry Association
- Paid Database
- Investor Presentations

Step 4 - Data Triangulation
Involves using different sources of information in order to increase the validity of a study
These sources are likely to be stakeholders in a program - participants, other researchers, program staff, other community members, and so on.
Then we put all data in single framework & apply various statistical tools to find out the dynamic on the market.
During the analysis stage, feedback from the stakeholder groups would be compared to determine areas of agreement as well as areas of divergence
