

Key Insights
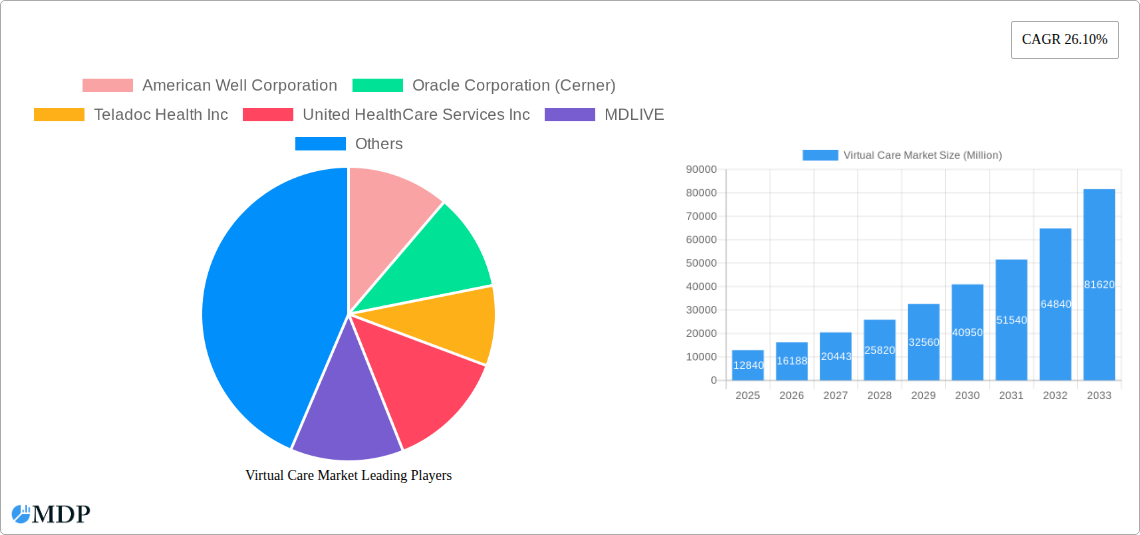
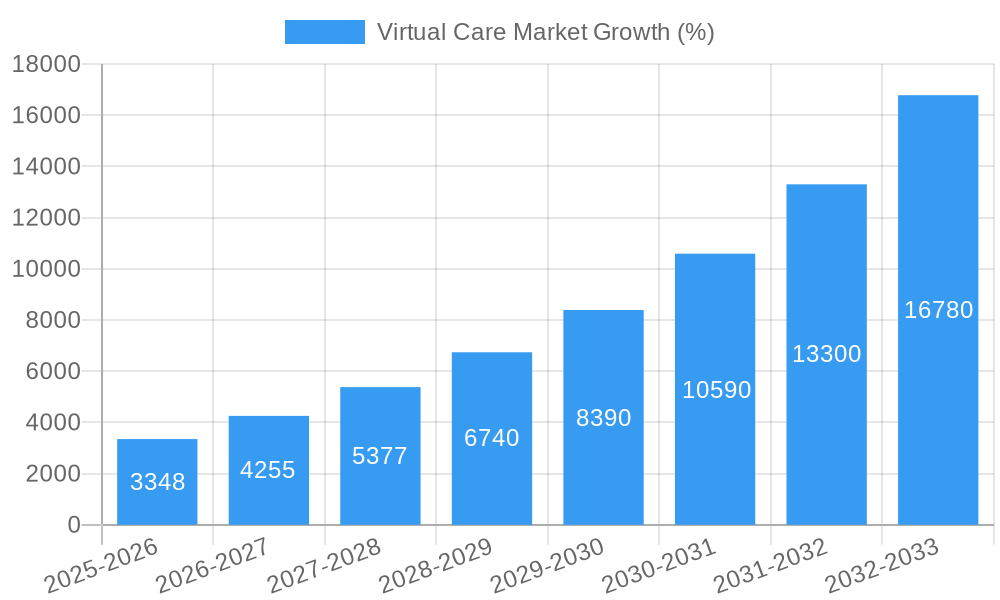
The global virtual care market is experiencing explosive growth, projected to reach a market size of $12.84 billion in 2025 and exhibiting a robust Compound Annual Growth Rate (CAGR) of 26.10%. This surge is driven by several key factors. The increasing prevalence of chronic diseases necessitates convenient and accessible healthcare solutions, which virtual care effectively provides. Furthermore, technological advancements in telehealth platforms, including enhanced video conferencing capabilities, sophisticated data analytics, and improved mobile integration, are fueling market expansion. The rising adoption of remote patient monitoring (RPM) devices further contributes to this trend, allowing for proactive health management and timely intervention. Cost-effectiveness, reduced hospital readmission rates, and improved patient satisfaction are also significant drivers, making virtual care an attractive option for both healthcare providers and patients.
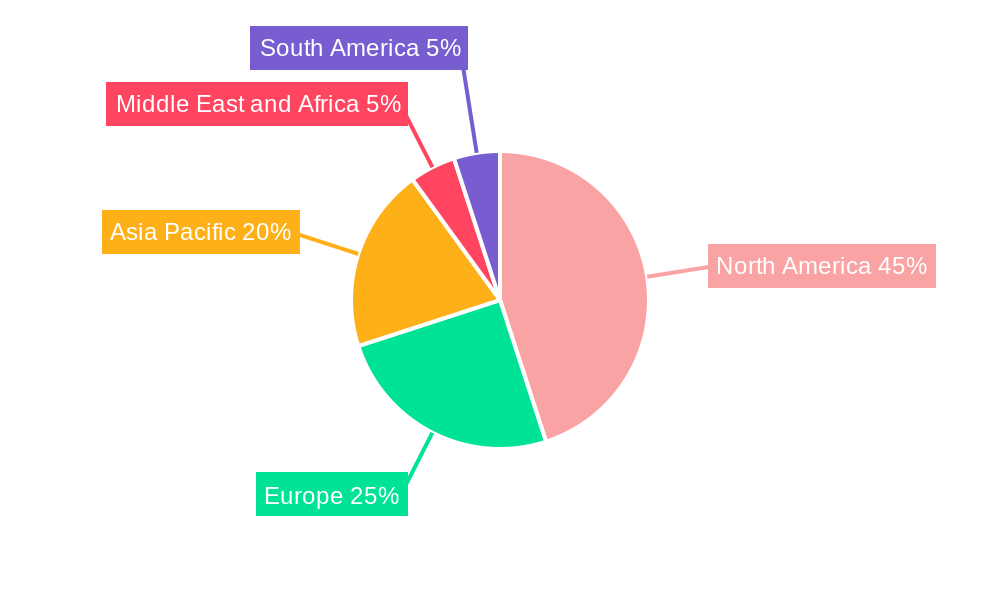
Segment-wise, the home healthcare end-user segment is expected to dominate due to its growing elderly population and preference for in-home care. Video-based virtual care is currently the most popular mode of delivery, but the increasing use of messaging and audio platforms for quick consultations and follow-ups indicates a shift towards diverse communication channels. Solutions, encompassing software and hardware platforms, currently hold a larger market share than services, though the service segment is poised for significant growth due to increasing demand for specialized virtual care services like remote diagnostics and therapeutic interventions. Geographically, North America currently holds the largest market share, largely due to the high adoption rates of telehealth technologies and robust healthcare infrastructure. However, Asia Pacific is anticipated to witness the fastest growth in the coming years, fueled by rapid technological advancements and expanding internet penetration. This expansion is predicted to continue throughout the forecast period (2025-2033), making virtual care a key player in the future of healthcare delivery.
Virtual Care Market: A Comprehensive Report (2019-2033)
This in-depth report provides a comprehensive analysis of the global Virtual Care Market, projecting robust growth from 2025 to 2033. Valued at xx Million in 2025, the market is poised for significant expansion, driven by technological advancements, increasing demand for convenient healthcare access, and favorable regulatory shifts. This report is essential for investors, healthcare providers, technology companies, and anyone seeking to understand the evolving landscape of virtual care.
Virtual Care Market Market Dynamics & Concentration
The Virtual Care market is characterized by a dynamic interplay of factors influencing its growth and concentration. Market concentration is currently moderate, with several key players holding significant market share, but a landscape ripe for further consolidation. The market is witnessing rapid innovation driven by advancements in telehealth technologies, artificial intelligence (AI), and big data analytics. These innovations enable improved remote patient monitoring, diagnostics, and treatment. Stringent regulatory frameworks vary across geographies, impacting market access and adoption rates. While traditional in-person care remains a significant competitor, the convenience and accessibility of virtual care are driving substitution. End-user trends point towards a growing preference for remote healthcare services, particularly among aging populations and those in remote areas. Furthermore, significant merger and acquisition (M&A) activity is reshaping the competitive landscape.
- Market Share: While precise figures are proprietary to the full report, the market is not overly concentrated, allowing for both established players and emerging companies to flourish. Data on precise market share for each company is included in the full report.
- M&A Activity: The report details a significant number of M&A deals in the past five years (xx deals). This trend signifies the strategic importance of virtual care and the consolidation within the sector.
Virtual Care Market Industry Trends & Analysis
The Virtual Care market is experiencing exponential growth, projected to achieve a Compound Annual Growth Rate (CAGR) of xx% during the forecast period (2025-2033). This growth is fueled by several key trends: rising healthcare costs, increasing adoption of smartphones and internet access, a growing elderly population with chronic conditions, and government initiatives promoting telehealth adoption. Technological disruptions, particularly in AI-powered diagnostics and remote patient monitoring, are dramatically enhancing the capabilities and effectiveness of virtual care solutions. Consumer preferences are shifting towards convenient and accessible healthcare options, driving the demand for virtual care services. The competitive dynamics are characterized by intense rivalry among established players and the emergence of innovative startups. Market penetration is expected to increase substantially, driven by improved affordability and user-friendliness of virtual care platforms. Further detail on market penetration rates for various segments is included in the full report.
Leading Markets & Segments in Virtual Care Market
The North American market currently holds a dominant position in the global virtual care market. Within this region, the United States is the largest segment.
By End Users:
- Home Healthcare: This segment is experiencing the highest growth rate, driven by the increasing preference for home-based care among elderly and chronically ill patients. Key drivers include an aging population and the preference for convenient, comfortable care at home.
- Hospitals: Hospitals are increasingly integrating virtual care into their service offerings to improve efficiency, reduce costs, and expand reach. Strong government support for telehealth initiatives in many countries drives this segment's growth.
- Others: This segment includes various healthcare settings, such as clinics, nursing homes, and rehabilitation centers, each with varying levels of virtual care adoption.
By Mode of Delivery:
- Video: Video consultations are the most widely adopted mode of delivery, offering a high level of engagement and interaction between healthcare providers and patients.
- Audio: Audio-only consultations are preferred for certain applications, particularly those focused on routine check-ins or simple health inquiries.
- Messaging: Messaging platforms provide a convenient way for patients and providers to communicate asynchronously, allowing for quick queries and follow-ups.
By Component:
- Solutions: This includes software and hardware solutions that enable virtual care delivery.
- Services: This encompasses various services, such as remote patient monitoring, virtual consultations, and chronic disease management.
Virtual Care Market Product Developments
Recent product innovations in the virtual care market include advanced remote patient monitoring devices that incorporate AI-powered analytics for early disease detection and improved chronic disease management. The integration of AI and machine learning into virtual care platforms enhances diagnostic capabilities and personalized treatment plans. These developments offer significant competitive advantages, allowing providers to offer more comprehensive and efficient care while improving patient outcomes and experience. New applications are constantly emerging, such as virtual mental health support and specialized virtual clinics focusing on niche areas of medicine. The market is adapting swiftly to deliver seamless, integrated care solutions across a broad range of applications.
Key Drivers of Virtual Care Market Growth
Several factors are driving the growth of the virtual care market. Technological advancements, including improvements in telecommunications infrastructure and the development of user-friendly telehealth platforms, are making virtual care more accessible and affordable. Favorable economic conditions in certain regions are increasing healthcare spending and investment in technology. Supportive government policies and regulations are promoting the adoption of telehealth and virtual care models. Examples include reimbursement policies that cover virtual care services and initiatives designed to expand access to telehealth in rural and underserved areas.
Challenges in the Virtual Care Market Market
The Virtual Care market faces significant challenges, including regulatory hurdles around data privacy and licensing requirements that vary by jurisdiction. Supply chain disruptions can impact the availability of necessary equipment and technology. Intense competition among established players and emerging startups puts pressure on pricing and profit margins, with a potential impact on market growth in the future of approximately xx%.
Emerging Opportunities in Virtual Care Market
Long-term growth opportunities abound in the Virtual Care market. Technological breakthroughs, such as the development of more sophisticated AI-powered diagnostic tools and the expansion of 5G networks, promise to enhance the capabilities and reach of virtual care. Strategic partnerships between healthcare providers, technology companies, and insurance payers can foster wider adoption and integration of virtual care services. The expansion into new markets and underserved populations presents significant opportunities for market growth.
Leading Players in the Virtual Care Market Sector
- American Well Corporation
- Oracle Corporation (Cerner)
- Teladoc Health Inc
- United HealthCare Services Inc
- MDLIVE
- Medocity Inc
- Amazon com Inc
- General Electric Company
- VirtualHealth
- CVS Health
Key Milestones in Virtual Care Market Industry
- May 2022: CVS Health launched CVS Health Virtual Primary Care, expanding access to virtual care services for its members.
- November 2021: TalktoMira, Inc. launched four new virtual care services through its Mira Health App, enhancing 24/7 access to virtual urgent care.
Strategic Outlook for Virtual Care Market Market
The future of the Virtual Care market is bright, with substantial growth potential driven by ongoing technological advancements, evolving consumer preferences, and supportive regulatory environments. Strategic opportunities include expanding into new geographic markets, developing innovative virtual care solutions tailored to specific patient needs, and forging strategic partnerships to broaden market reach and enhance service offerings. The market is poised for continued consolidation, with larger players acquiring smaller companies to expand their market share and service offerings. This will lead to a more integrated and efficient virtual care ecosystem in the coming years.
Virtual Care Market Segmentation
-
1. Mode of Delivery
- 1.1. Video
- 1.2. Audio
- 1.3. Messaging
-
2. Component
- 2.1. Solutions
- 2.2. Services
-
3. End Users
- 3.1. Home Healthcare
- 3.2. Hospitals
- 3.3. Others
Virtual Care Market Segmentation By Geography
-
1. North America
- 1.1. United States
- 1.2. Canada
- 1.3. Mexico
-
2. Europe
- 2.1. Germany
- 2.2. United Kingdom
- 2.3. France
- 2.4. Italy
- 2.5. Spain
- 2.6. Rest of Europe
-
3. Asia Pacific
- 3.1. China
- 3.2. Japan
- 3.3. India
- 3.4. Australia
- 3.5. South Korea
- 3.6. Rest of Asia Pacific
-
4. Middle East and Africa
- 4.1. GCC
- 4.2. South Africa
- 4.3. Rest of Middle East and Africa
-
5. South America
- 5.1. Brazil
- 5.2. Argentina
- 5.3. Rest of South America
Virtual Care Market REPORT HIGHLIGHTS
| Aspects | Details |
|---|---|
| Study Period | 2019-2033 |
| Base Year | 2024 |
| Estimated Year | 2025 |
| Forecast Period | 2025-2033 |
| Historical Period | 2019-2024 |
| Growth Rate | CAGR of 26.10% from 2019-2033 |
| Segmentation |
|
Table of Contents
- 1. Introduction
- 1.1. Research Scope
- 1.2. Market Segmentation
- 1.3. Research Methodology
- 1.4. Definitions and Assumptions
- 2. Executive Summary
- 2.1. Introduction
- 3. Market Dynamics
- 3.1. Introduction
- 3.2. Market Drivers
- 3.2.1. Increasing Number of Patients Adopting Virtual Care and Government Initiatives Towards Virtual Care Access; Advantages Of Virtual Care and New Service Launches by Market Players
- 3.3. Market Restrains
- 3.3.1. Lack of Physician Support and Hospital Integration Issues Due to Privacy Concerns
- 3.4. Market Trends
- 3.4.1. Home Healthcare Segment is Expected to Witness Significant Growth Over the Forecast Period
- 4. Market Factor Analysis
- 4.1. Porters Five Forces
- 4.2. Supply/Value Chain
- 4.3. PESTEL analysis
- 4.4. Market Entropy
- 4.5. Patent/Trademark Analysis
- 5. Global Virtual Care Market Analysis, Insights and Forecast, 2019-2031
- 5.1. Market Analysis, Insights and Forecast - by Mode of Delivery
- 5.1.1. Video
- 5.1.2. Audio
- 5.1.3. Messaging
- 5.2. Market Analysis, Insights and Forecast - by Component
- 5.2.1. Solutions
- 5.2.2. Services
- 5.3. Market Analysis, Insights and Forecast - by End Users
- 5.3.1. Home Healthcare
- 5.3.2. Hospitals
- 5.3.3. Others
- 5.4. Market Analysis, Insights and Forecast - by Region
- 5.4.1. North America
- 5.4.2. Europe
- 5.4.3. Asia Pacific
- 5.4.4. Middle East and Africa
- 5.4.5. South America
- 5.1. Market Analysis, Insights and Forecast - by Mode of Delivery
- 6. North America Virtual Care Market Analysis, Insights and Forecast, 2019-2031
- 6.1. Market Analysis, Insights and Forecast - by Mode of Delivery
- 6.1.1. Video
- 6.1.2. Audio
- 6.1.3. Messaging
- 6.2. Market Analysis, Insights and Forecast - by Component
- 6.2.1. Solutions
- 6.2.2. Services
- 6.3. Market Analysis, Insights and Forecast - by End Users
- 6.3.1. Home Healthcare
- 6.3.2. Hospitals
- 6.3.3. Others
- 6.1. Market Analysis, Insights and Forecast - by Mode of Delivery
- 7. Europe Virtual Care Market Analysis, Insights and Forecast, 2019-2031
- 7.1. Market Analysis, Insights and Forecast - by Mode of Delivery
- 7.1.1. Video
- 7.1.2. Audio
- 7.1.3. Messaging
- 7.2. Market Analysis, Insights and Forecast - by Component
- 7.2.1. Solutions
- 7.2.2. Services
- 7.3. Market Analysis, Insights and Forecast - by End Users
- 7.3.1. Home Healthcare
- 7.3.2. Hospitals
- 7.3.3. Others
- 7.1. Market Analysis, Insights and Forecast - by Mode of Delivery
- 8. Asia Pacific Virtual Care Market Analysis, Insights and Forecast, 2019-2031
- 8.1. Market Analysis, Insights and Forecast - by Mode of Delivery
- 8.1.1. Video
- 8.1.2. Audio
- 8.1.3. Messaging
- 8.2. Market Analysis, Insights and Forecast - by Component
- 8.2.1. Solutions
- 8.2.2. Services
- 8.3. Market Analysis, Insights and Forecast - by End Users
- 8.3.1. Home Healthcare
- 8.3.2. Hospitals
- 8.3.3. Others
- 8.1. Market Analysis, Insights and Forecast - by Mode of Delivery
- 9. Middle East and Africa Virtual Care Market Analysis, Insights and Forecast, 2019-2031
- 9.1. Market Analysis, Insights and Forecast - by Mode of Delivery
- 9.1.1. Video
- 9.1.2. Audio
- 9.1.3. Messaging
- 9.2. Market Analysis, Insights and Forecast - by Component
- 9.2.1. Solutions
- 9.2.2. Services
- 9.3. Market Analysis, Insights and Forecast - by End Users
- 9.3.1. Home Healthcare
- 9.3.2. Hospitals
- 9.3.3. Others
- 9.1. Market Analysis, Insights and Forecast - by Mode of Delivery
- 10. South America Virtual Care Market Analysis, Insights and Forecast, 2019-2031
- 10.1. Market Analysis, Insights and Forecast - by Mode of Delivery
- 10.1.1. Video
- 10.1.2. Audio
- 10.1.3. Messaging
- 10.2. Market Analysis, Insights and Forecast - by Component
- 10.2.1. Solutions
- 10.2.2. Services
- 10.3. Market Analysis, Insights and Forecast - by End Users
- 10.3.1. Home Healthcare
- 10.3.2. Hospitals
- 10.3.3. Others
- 10.1. Market Analysis, Insights and Forecast - by Mode of Delivery
- 11. North America Virtual Care Market Analysis, Insights and Forecast, 2019-2031
- 11.1. Market Analysis, Insights and Forecast - By Country/Sub-region
- 11.1.1 United States
- 11.1.2 Canada
- 11.1.3 Mexico
- 12. Europe Virtual Care Market Analysis, Insights and Forecast, 2019-2031
- 12.1. Market Analysis, Insights and Forecast - By Country/Sub-region
- 12.1.1 Germany
- 12.1.2 United Kingdom
- 12.1.3 France
- 12.1.4 Italy
- 12.1.5 Spain
- 12.1.6 Rest of Europe
- 13. Asia Pacific Virtual Care Market Analysis, Insights and Forecast, 2019-2031
- 13.1. Market Analysis, Insights and Forecast - By Country/Sub-region
- 13.1.1 China
- 13.1.2 Japan
- 13.1.3 India
- 13.1.4 Australia
- 13.1.5 South Korea
- 13.1.6 Rest of Asia Pacific
- 14. Middle East and Africa Virtual Care Market Analysis, Insights and Forecast, 2019-2031
- 14.1. Market Analysis, Insights and Forecast - By Country/Sub-region
- 14.1.1 GCC
- 14.1.2 South Africa
- 14.1.3 Rest of Middle East and Africa
- 15. South America Virtual Care Market Analysis, Insights and Forecast, 2019-2031
- 15.1. Market Analysis, Insights and Forecast - By Country/Sub-region
- 15.1.1 Brazil
- 15.1.2 Argentina
- 15.1.3 Rest of South America
- 16. Competitive Analysis
- 16.1. Global Market Share Analysis 2024
- 16.2. Company Profiles
- 16.2.1 American Well Corporation
- 16.2.1.1. Overview
- 16.2.1.2. Products
- 16.2.1.3. SWOT Analysis
- 16.2.1.4. Recent Developments
- 16.2.1.5. Financials (Based on Availability)
- 16.2.2 Oracle Corporation (Cerner)
- 16.2.2.1. Overview
- 16.2.2.2. Products
- 16.2.2.3. SWOT Analysis
- 16.2.2.4. Recent Developments
- 16.2.2.5. Financials (Based on Availability)
- 16.2.3 Teladoc Health Inc
- 16.2.3.1. Overview
- 16.2.3.2. Products
- 16.2.3.3. SWOT Analysis
- 16.2.3.4. Recent Developments
- 16.2.3.5. Financials (Based on Availability)
- 16.2.4 United HealthCare Services Inc
- 16.2.4.1. Overview
- 16.2.4.2. Products
- 16.2.4.3. SWOT Analysis
- 16.2.4.4. Recent Developments
- 16.2.4.5. Financials (Based on Availability)
- 16.2.5 MDLIVE
- 16.2.5.1. Overview
- 16.2.5.2. Products
- 16.2.5.3. SWOT Analysis
- 16.2.5.4. Recent Developments
- 16.2.5.5. Financials (Based on Availability)
- 16.2.6 Medocity Inc
- 16.2.6.1. Overview
- 16.2.6.2. Products
- 16.2.6.3. SWOT Analysis
- 16.2.6.4. Recent Developments
- 16.2.6.5. Financials (Based on Availability)
- 16.2.7 Amazon com Inc
- 16.2.7.1. Overview
- 16.2.7.2. Products
- 16.2.7.3. SWOT Analysis
- 16.2.7.4. Recent Developments
- 16.2.7.5. Financials (Based on Availability)
- 16.2.8 General Electric Company
- 16.2.8.1. Overview
- 16.2.8.2. Products
- 16.2.8.3. SWOT Analysis
- 16.2.8.4. Recent Developments
- 16.2.8.5. Financials (Based on Availability)
- 16.2.9 VirtualHealth
- 16.2.9.1. Overview
- 16.2.9.2. Products
- 16.2.9.3. SWOT Analysis
- 16.2.9.4. Recent Developments
- 16.2.9.5. Financials (Based on Availability)
- 16.2.10 CVS Health
- 16.2.10.1. Overview
- 16.2.10.2. Products
- 16.2.10.3. SWOT Analysis
- 16.2.10.4. Recent Developments
- 16.2.10.5. Financials (Based on Availability)
- 16.2.1 American Well Corporation
List of Figures
- Figure 1: Global Virtual Care Market Revenue Breakdown (Million, %) by Region 2024 & 2032
- Figure 2: Global Virtual Care Market Volume Breakdown (K Unit, %) by Region 2024 & 2032
- Figure 3: North America Virtual Care Market Revenue (Million), by Country 2024 & 2032
- Figure 4: North America Virtual Care Market Volume (K Unit), by Country 2024 & 2032
- Figure 5: North America Virtual Care Market Revenue Share (%), by Country 2024 & 2032
- Figure 6: North America Virtual Care Market Volume Share (%), by Country 2024 & 2032
- Figure 7: Europe Virtual Care Market Revenue (Million), by Country 2024 & 2032
- Figure 8: Europe Virtual Care Market Volume (K Unit), by Country 2024 & 2032
- Figure 9: Europe Virtual Care Market Revenue Share (%), by Country 2024 & 2032
- Figure 10: Europe Virtual Care Market Volume Share (%), by Country 2024 & 2032
- Figure 11: Asia Pacific Virtual Care Market Revenue (Million), by Country 2024 & 2032
- Figure 12: Asia Pacific Virtual Care Market Volume (K Unit), by Country 2024 & 2032
- Figure 13: Asia Pacific Virtual Care Market Revenue Share (%), by Country 2024 & 2032
- Figure 14: Asia Pacific Virtual Care Market Volume Share (%), by Country 2024 & 2032
- Figure 15: Middle East and Africa Virtual Care Market Revenue (Million), by Country 2024 & 2032
- Figure 16: Middle East and Africa Virtual Care Market Volume (K Unit), by Country 2024 & 2032
- Figure 17: Middle East and Africa Virtual Care Market Revenue Share (%), by Country 2024 & 2032
- Figure 18: Middle East and Africa Virtual Care Market Volume Share (%), by Country 2024 & 2032
- Figure 19: South America Virtual Care Market Revenue (Million), by Country 2024 & 2032
- Figure 20: South America Virtual Care Market Volume (K Unit), by Country 2024 & 2032
- Figure 21: South America Virtual Care Market Revenue Share (%), by Country 2024 & 2032
- Figure 22: South America Virtual Care Market Volume Share (%), by Country 2024 & 2032
- Figure 23: North America Virtual Care Market Revenue (Million), by Mode of Delivery 2024 & 2032
- Figure 24: North America Virtual Care Market Volume (K Unit), by Mode of Delivery 2024 & 2032
- Figure 25: North America Virtual Care Market Revenue Share (%), by Mode of Delivery 2024 & 2032
- Figure 26: North America Virtual Care Market Volume Share (%), by Mode of Delivery 2024 & 2032
- Figure 27: North America Virtual Care Market Revenue (Million), by Component 2024 & 2032
- Figure 28: North America Virtual Care Market Volume (K Unit), by Component 2024 & 2032
- Figure 29: North America Virtual Care Market Revenue Share (%), by Component 2024 & 2032
- Figure 30: North America Virtual Care Market Volume Share (%), by Component 2024 & 2032
- Figure 31: North America Virtual Care Market Revenue (Million), by End Users 2024 & 2032
- Figure 32: North America Virtual Care Market Volume (K Unit), by End Users 2024 & 2032
- Figure 33: North America Virtual Care Market Revenue Share (%), by End Users 2024 & 2032
- Figure 34: North America Virtual Care Market Volume Share (%), by End Users 2024 & 2032
- Figure 35: North America Virtual Care Market Revenue (Million), by Country 2024 & 2032
- Figure 36: North America Virtual Care Market Volume (K Unit), by Country 2024 & 2032
- Figure 37: North America Virtual Care Market Revenue Share (%), by Country 2024 & 2032
- Figure 38: North America Virtual Care Market Volume Share (%), by Country 2024 & 2032
- Figure 39: Europe Virtual Care Market Revenue (Million), by Mode of Delivery 2024 & 2032
- Figure 40: Europe Virtual Care Market Volume (K Unit), by Mode of Delivery 2024 & 2032
- Figure 41: Europe Virtual Care Market Revenue Share (%), by Mode of Delivery 2024 & 2032
- Figure 42: Europe Virtual Care Market Volume Share (%), by Mode of Delivery 2024 & 2032
- Figure 43: Europe Virtual Care Market Revenue (Million), by Component 2024 & 2032
- Figure 44: Europe Virtual Care Market Volume (K Unit), by Component 2024 & 2032
- Figure 45: Europe Virtual Care Market Revenue Share (%), by Component 2024 & 2032
- Figure 46: Europe Virtual Care Market Volume Share (%), by Component 2024 & 2032
- Figure 47: Europe Virtual Care Market Revenue (Million), by End Users 2024 & 2032
- Figure 48: Europe Virtual Care Market Volume (K Unit), by End Users 2024 & 2032
- Figure 49: Europe Virtual Care Market Revenue Share (%), by End Users 2024 & 2032
- Figure 50: Europe Virtual Care Market Volume Share (%), by End Users 2024 & 2032
- Figure 51: Europe Virtual Care Market Revenue (Million), by Country 2024 & 2032
- Figure 52: Europe Virtual Care Market Volume (K Unit), by Country 2024 & 2032
- Figure 53: Europe Virtual Care Market Revenue Share (%), by Country 2024 & 2032
- Figure 54: Europe Virtual Care Market Volume Share (%), by Country 2024 & 2032
- Figure 55: Asia Pacific Virtual Care Market Revenue (Million), by Mode of Delivery 2024 & 2032
- Figure 56: Asia Pacific Virtual Care Market Volume (K Unit), by Mode of Delivery 2024 & 2032
- Figure 57: Asia Pacific Virtual Care Market Revenue Share (%), by Mode of Delivery 2024 & 2032
- Figure 58: Asia Pacific Virtual Care Market Volume Share (%), by Mode of Delivery 2024 & 2032
- Figure 59: Asia Pacific Virtual Care Market Revenue (Million), by Component 2024 & 2032
- Figure 60: Asia Pacific Virtual Care Market Volume (K Unit), by Component 2024 & 2032
- Figure 61: Asia Pacific Virtual Care Market Revenue Share (%), by Component 2024 & 2032
- Figure 62: Asia Pacific Virtual Care Market Volume Share (%), by Component 2024 & 2032
- Figure 63: Asia Pacific Virtual Care Market Revenue (Million), by End Users 2024 & 2032
- Figure 64: Asia Pacific Virtual Care Market Volume (K Unit), by End Users 2024 & 2032
- Figure 65: Asia Pacific Virtual Care Market Revenue Share (%), by End Users 2024 & 2032
- Figure 66: Asia Pacific Virtual Care Market Volume Share (%), by End Users 2024 & 2032
- Figure 67: Asia Pacific Virtual Care Market Revenue (Million), by Country 2024 & 2032
- Figure 68: Asia Pacific Virtual Care Market Volume (K Unit), by Country 2024 & 2032
- Figure 69: Asia Pacific Virtual Care Market Revenue Share (%), by Country 2024 & 2032
- Figure 70: Asia Pacific Virtual Care Market Volume Share (%), by Country 2024 & 2032
- Figure 71: Middle East and Africa Virtual Care Market Revenue (Million), by Mode of Delivery 2024 & 2032
- Figure 72: Middle East and Africa Virtual Care Market Volume (K Unit), by Mode of Delivery 2024 & 2032
- Figure 73: Middle East and Africa Virtual Care Market Revenue Share (%), by Mode of Delivery 2024 & 2032
- Figure 74: Middle East and Africa Virtual Care Market Volume Share (%), by Mode of Delivery 2024 & 2032
- Figure 75: Middle East and Africa Virtual Care Market Revenue (Million), by Component 2024 & 2032
- Figure 76: Middle East and Africa Virtual Care Market Volume (K Unit), by Component 2024 & 2032
- Figure 77: Middle East and Africa Virtual Care Market Revenue Share (%), by Component 2024 & 2032
- Figure 78: Middle East and Africa Virtual Care Market Volume Share (%), by Component 2024 & 2032
- Figure 79: Middle East and Africa Virtual Care Market Revenue (Million), by End Users 2024 & 2032
- Figure 80: Middle East and Africa Virtual Care Market Volume (K Unit), by End Users 2024 & 2032
- Figure 81: Middle East and Africa Virtual Care Market Revenue Share (%), by End Users 2024 & 2032
- Figure 82: Middle East and Africa Virtual Care Market Volume Share (%), by End Users 2024 & 2032
- Figure 83: Middle East and Africa Virtual Care Market Revenue (Million), by Country 2024 & 2032
- Figure 84: Middle East and Africa Virtual Care Market Volume (K Unit), by Country 2024 & 2032
- Figure 85: Middle East and Africa Virtual Care Market Revenue Share (%), by Country 2024 & 2032
- Figure 86: Middle East and Africa Virtual Care Market Volume Share (%), by Country 2024 & 2032
- Figure 87: South America Virtual Care Market Revenue (Million), by Mode of Delivery 2024 & 2032
- Figure 88: South America Virtual Care Market Volume (K Unit), by Mode of Delivery 2024 & 2032
- Figure 89: South America Virtual Care Market Revenue Share (%), by Mode of Delivery 2024 & 2032
- Figure 90: South America Virtual Care Market Volume Share (%), by Mode of Delivery 2024 & 2032
- Figure 91: South America Virtual Care Market Revenue (Million), by Component 2024 & 2032
- Figure 92: South America Virtual Care Market Volume (K Unit), by Component 2024 & 2032
- Figure 93: South America Virtual Care Market Revenue Share (%), by Component 2024 & 2032
- Figure 94: South America Virtual Care Market Volume Share (%), by Component 2024 & 2032
- Figure 95: South America Virtual Care Market Revenue (Million), by End Users 2024 & 2032
- Figure 96: South America Virtual Care Market Volume (K Unit), by End Users 2024 & 2032
- Figure 97: South America Virtual Care Market Revenue Share (%), by End Users 2024 & 2032
- Figure 98: South America Virtual Care Market Volume Share (%), by End Users 2024 & 2032
- Figure 99: South America Virtual Care Market Revenue (Million), by Country 2024 & 2032
- Figure 100: South America Virtual Care Market Volume (K Unit), by Country 2024 & 2032
- Figure 101: South America Virtual Care Market Revenue Share (%), by Country 2024 & 2032
- Figure 102: South America Virtual Care Market Volume Share (%), by Country 2024 & 2032
List of Tables
- Table 1: Global Virtual Care Market Revenue Million Forecast, by Region 2019 & 2032
- Table 2: Global Virtual Care Market Volume K Unit Forecast, by Region 2019 & 2032
- Table 3: Global Virtual Care Market Revenue Million Forecast, by Mode of Delivery 2019 & 2032
- Table 4: Global Virtual Care Market Volume K Unit Forecast, by Mode of Delivery 2019 & 2032
- Table 5: Global Virtual Care Market Revenue Million Forecast, by Component 2019 & 2032
- Table 6: Global Virtual Care Market Volume K Unit Forecast, by Component 2019 & 2032
- Table 7: Global Virtual Care Market Revenue Million Forecast, by End Users 2019 & 2032
- Table 8: Global Virtual Care Market Volume K Unit Forecast, by End Users 2019 & 2032
- Table 9: Global Virtual Care Market Revenue Million Forecast, by Region 2019 & 2032
- Table 10: Global Virtual Care Market Volume K Unit Forecast, by Region 2019 & 2032
- Table 11: Global Virtual Care Market Revenue Million Forecast, by Country 2019 & 2032
- Table 12: Global Virtual Care Market Volume K Unit Forecast, by Country 2019 & 2032
- Table 13: United States Virtual Care Market Revenue (Million) Forecast, by Application 2019 & 2032
- Table 14: United States Virtual Care Market Volume (K Unit) Forecast, by Application 2019 & 2032
- Table 15: Canada Virtual Care Market Revenue (Million) Forecast, by Application 2019 & 2032
- Table 16: Canada Virtual Care Market Volume (K Unit) Forecast, by Application 2019 & 2032
- Table 17: Mexico Virtual Care Market Revenue (Million) Forecast, by Application 2019 & 2032
- Table 18: Mexico Virtual Care Market Volume (K Unit) Forecast, by Application 2019 & 2032
- Table 19: Global Virtual Care Market Revenue Million Forecast, by Country 2019 & 2032
- Table 20: Global Virtual Care Market Volume K Unit Forecast, by Country 2019 & 2032
- Table 21: Germany Virtual Care Market Revenue (Million) Forecast, by Application 2019 & 2032
- Table 22: Germany Virtual Care Market Volume (K Unit) Forecast, by Application 2019 & 2032
- Table 23: United Kingdom Virtual Care Market Revenue (Million) Forecast, by Application 2019 & 2032
- Table 24: United Kingdom Virtual Care Market Volume (K Unit) Forecast, by Application 2019 & 2032
- Table 25: France Virtual Care Market Revenue (Million) Forecast, by Application 2019 & 2032
- Table 26: France Virtual Care Market Volume (K Unit) Forecast, by Application 2019 & 2032
- Table 27: Italy Virtual Care Market Revenue (Million) Forecast, by Application 2019 & 2032
- Table 28: Italy Virtual Care Market Volume (K Unit) Forecast, by Application 2019 & 2032
- Table 29: Spain Virtual Care Market Revenue (Million) Forecast, by Application 2019 & 2032
- Table 30: Spain Virtual Care Market Volume (K Unit) Forecast, by Application 2019 & 2032
- Table 31: Rest of Europe Virtual Care Market Revenue (Million) Forecast, by Application 2019 & 2032
- Table 32: Rest of Europe Virtual Care Market Volume (K Unit) Forecast, by Application 2019 & 2032
- Table 33: Global Virtual Care Market Revenue Million Forecast, by Country 2019 & 2032
- Table 34: Global Virtual Care Market Volume K Unit Forecast, by Country 2019 & 2032
- Table 35: China Virtual Care Market Revenue (Million) Forecast, by Application 2019 & 2032
- Table 36: China Virtual Care Market Volume (K Unit) Forecast, by Application 2019 & 2032
- Table 37: Japan Virtual Care Market Revenue (Million) Forecast, by Application 2019 & 2032
- Table 38: Japan Virtual Care Market Volume (K Unit) Forecast, by Application 2019 & 2032
- Table 39: India Virtual Care Market Revenue (Million) Forecast, by Application 2019 & 2032
- Table 40: India Virtual Care Market Volume (K Unit) Forecast, by Application 2019 & 2032
- Table 41: Australia Virtual Care Market Revenue (Million) Forecast, by Application 2019 & 2032
- Table 42: Australia Virtual Care Market Volume (K Unit) Forecast, by Application 2019 & 2032
- Table 43: South Korea Virtual Care Market Revenue (Million) Forecast, by Application 2019 & 2032
- Table 44: South Korea Virtual Care Market Volume (K Unit) Forecast, by Application 2019 & 2032
- Table 45: Rest of Asia Pacific Virtual Care Market Revenue (Million) Forecast, by Application 2019 & 2032
- Table 46: Rest of Asia Pacific Virtual Care Market Volume (K Unit) Forecast, by Application 2019 & 2032
- Table 47: Global Virtual Care Market Revenue Million Forecast, by Country 2019 & 2032
- Table 48: Global Virtual Care Market Volume K Unit Forecast, by Country 2019 & 2032
- Table 49: GCC Virtual Care Market Revenue (Million) Forecast, by Application 2019 & 2032
- Table 50: GCC Virtual Care Market Volume (K Unit) Forecast, by Application 2019 & 2032
- Table 51: South Africa Virtual Care Market Revenue (Million) Forecast, by Application 2019 & 2032
- Table 52: South Africa Virtual Care Market Volume (K Unit) Forecast, by Application 2019 & 2032
- Table 53: Rest of Middle East and Africa Virtual Care Market Revenue (Million) Forecast, by Application 2019 & 2032
- Table 54: Rest of Middle East and Africa Virtual Care Market Volume (K Unit) Forecast, by Application 2019 & 2032
- Table 55: Global Virtual Care Market Revenue Million Forecast, by Country 2019 & 2032
- Table 56: Global Virtual Care Market Volume K Unit Forecast, by Country 2019 & 2032
- Table 57: Brazil Virtual Care Market Revenue (Million) Forecast, by Application 2019 & 2032
- Table 58: Brazil Virtual Care Market Volume (K Unit) Forecast, by Application 2019 & 2032
- Table 59: Argentina Virtual Care Market Revenue (Million) Forecast, by Application 2019 & 2032
- Table 60: Argentina Virtual Care Market Volume (K Unit) Forecast, by Application 2019 & 2032
- Table 61: Rest of South America Virtual Care Market Revenue (Million) Forecast, by Application 2019 & 2032
- Table 62: Rest of South America Virtual Care Market Volume (K Unit) Forecast, by Application 2019 & 2032
- Table 63: Global Virtual Care Market Revenue Million Forecast, by Mode of Delivery 2019 & 2032
- Table 64: Global Virtual Care Market Volume K Unit Forecast, by Mode of Delivery 2019 & 2032
- Table 65: Global Virtual Care Market Revenue Million Forecast, by Component 2019 & 2032
- Table 66: Global Virtual Care Market Volume K Unit Forecast, by Component 2019 & 2032
- Table 67: Global Virtual Care Market Revenue Million Forecast, by End Users 2019 & 2032
- Table 68: Global Virtual Care Market Volume K Unit Forecast, by End Users 2019 & 2032
- Table 69: Global Virtual Care Market Revenue Million Forecast, by Country 2019 & 2032
- Table 70: Global Virtual Care Market Volume K Unit Forecast, by Country 2019 & 2032
- Table 71: United States Virtual Care Market Revenue (Million) Forecast, by Application 2019 & 2032
- Table 72: United States Virtual Care Market Volume (K Unit) Forecast, by Application 2019 & 2032
- Table 73: Canada Virtual Care Market Revenue (Million) Forecast, by Application 2019 & 2032
- Table 74: Canada Virtual Care Market Volume (K Unit) Forecast, by Application 2019 & 2032
- Table 75: Mexico Virtual Care Market Revenue (Million) Forecast, by Application 2019 & 2032
- Table 76: Mexico Virtual Care Market Volume (K Unit) Forecast, by Application 2019 & 2032
- Table 77: Global Virtual Care Market Revenue Million Forecast, by Mode of Delivery 2019 & 2032
- Table 78: Global Virtual Care Market Volume K Unit Forecast, by Mode of Delivery 2019 & 2032
- Table 79: Global Virtual Care Market Revenue Million Forecast, by Component 2019 & 2032
- Table 80: Global Virtual Care Market Volume K Unit Forecast, by Component 2019 & 2032
- Table 81: Global Virtual Care Market Revenue Million Forecast, by End Users 2019 & 2032
- Table 82: Global Virtual Care Market Volume K Unit Forecast, by End Users 2019 & 2032
- Table 83: Global Virtual Care Market Revenue Million Forecast, by Country 2019 & 2032
- Table 84: Global Virtual Care Market Volume K Unit Forecast, by Country 2019 & 2032
- Table 85: Germany Virtual Care Market Revenue (Million) Forecast, by Application 2019 & 2032
- Table 86: Germany Virtual Care Market Volume (K Unit) Forecast, by Application 2019 & 2032
- Table 87: United Kingdom Virtual Care Market Revenue (Million) Forecast, by Application 2019 & 2032
- Table 88: United Kingdom Virtual Care Market Volume (K Unit) Forecast, by Application 2019 & 2032
- Table 89: France Virtual Care Market Revenue (Million) Forecast, by Application 2019 & 2032
- Table 90: France Virtual Care Market Volume (K Unit) Forecast, by Application 2019 & 2032
- Table 91: Italy Virtual Care Market Revenue (Million) Forecast, by Application 2019 & 2032
- Table 92: Italy Virtual Care Market Volume (K Unit) Forecast, by Application 2019 & 2032
- Table 93: Spain Virtual Care Market Revenue (Million) Forecast, by Application 2019 & 2032
- Table 94: Spain Virtual Care Market Volume (K Unit) Forecast, by Application 2019 & 2032
- Table 95: Rest of Europe Virtual Care Market Revenue (Million) Forecast, by Application 2019 & 2032
- Table 96: Rest of Europe Virtual Care Market Volume (K Unit) Forecast, by Application 2019 & 2032
- Table 97: Global Virtual Care Market Revenue Million Forecast, by Mode of Delivery 2019 & 2032
- Table 98: Global Virtual Care Market Volume K Unit Forecast, by Mode of Delivery 2019 & 2032
- Table 99: Global Virtual Care Market Revenue Million Forecast, by Component 2019 & 2032
- Table 100: Global Virtual Care Market Volume K Unit Forecast, by Component 2019 & 2032
- Table 101: Global Virtual Care Market Revenue Million Forecast, by End Users 2019 & 2032
- Table 102: Global Virtual Care Market Volume K Unit Forecast, by End Users 2019 & 2032
- Table 103: Global Virtual Care Market Revenue Million Forecast, by Country 2019 & 2032
- Table 104: Global Virtual Care Market Volume K Unit Forecast, by Country 2019 & 2032
- Table 105: China Virtual Care Market Revenue (Million) Forecast, by Application 2019 & 2032
- Table 106: China Virtual Care Market Volume (K Unit) Forecast, by Application 2019 & 2032
- Table 107: Japan Virtual Care Market Revenue (Million) Forecast, by Application 2019 & 2032
- Table 108: Japan Virtual Care Market Volume (K Unit) Forecast, by Application 2019 & 2032
- Table 109: India Virtual Care Market Revenue (Million) Forecast, by Application 2019 & 2032
- Table 110: India Virtual Care Market Volume (K Unit) Forecast, by Application 2019 & 2032
- Table 111: Australia Virtual Care Market Revenue (Million) Forecast, by Application 2019 & 2032
- Table 112: Australia Virtual Care Market Volume (K Unit) Forecast, by Application 2019 & 2032
- Table 113: South Korea Virtual Care Market Revenue (Million) Forecast, by Application 2019 & 2032
- Table 114: South Korea Virtual Care Market Volume (K Unit) Forecast, by Application 2019 & 2032
- Table 115: Rest of Asia Pacific Virtual Care Market Revenue (Million) Forecast, by Application 2019 & 2032
- Table 116: Rest of Asia Pacific Virtual Care Market Volume (K Unit) Forecast, by Application 2019 & 2032
- Table 117: Global Virtual Care Market Revenue Million Forecast, by Mode of Delivery 2019 & 2032
- Table 118: Global Virtual Care Market Volume K Unit Forecast, by Mode of Delivery 2019 & 2032
- Table 119: Global Virtual Care Market Revenue Million Forecast, by Component 2019 & 2032
- Table 120: Global Virtual Care Market Volume K Unit Forecast, by Component 2019 & 2032
- Table 121: Global Virtual Care Market Revenue Million Forecast, by End Users 2019 & 2032
- Table 122: Global Virtual Care Market Volume K Unit Forecast, by End Users 2019 & 2032
- Table 123: Global Virtual Care Market Revenue Million Forecast, by Country 2019 & 2032
- Table 124: Global Virtual Care Market Volume K Unit Forecast, by Country 2019 & 2032
- Table 125: GCC Virtual Care Market Revenue (Million) Forecast, by Application 2019 & 2032
- Table 126: GCC Virtual Care Market Volume (K Unit) Forecast, by Application 2019 & 2032
- Table 127: South Africa Virtual Care Market Revenue (Million) Forecast, by Application 2019 & 2032
- Table 128: South Africa Virtual Care Market Volume (K Unit) Forecast, by Application 2019 & 2032
- Table 129: Rest of Middle East and Africa Virtual Care Market Revenue (Million) Forecast, by Application 2019 & 2032
- Table 130: Rest of Middle East and Africa Virtual Care Market Volume (K Unit) Forecast, by Application 2019 & 2032
- Table 131: Global Virtual Care Market Revenue Million Forecast, by Mode of Delivery 2019 & 2032
- Table 132: Global Virtual Care Market Volume K Unit Forecast, by Mode of Delivery 2019 & 2032
- Table 133: Global Virtual Care Market Revenue Million Forecast, by Component 2019 & 2032
- Table 134: Global Virtual Care Market Volume K Unit Forecast, by Component 2019 & 2032
- Table 135: Global Virtual Care Market Revenue Million Forecast, by End Users 2019 & 2032
- Table 136: Global Virtual Care Market Volume K Unit Forecast, by End Users 2019 & 2032
- Table 137: Global Virtual Care Market Revenue Million Forecast, by Country 2019 & 2032
- Table 138: Global Virtual Care Market Volume K Unit Forecast, by Country 2019 & 2032
- Table 139: Brazil Virtual Care Market Revenue (Million) Forecast, by Application 2019 & 2032
- Table 140: Brazil Virtual Care Market Volume (K Unit) Forecast, by Application 2019 & 2032
- Table 141: Argentina Virtual Care Market Revenue (Million) Forecast, by Application 2019 & 2032
- Table 142: Argentina Virtual Care Market Volume (K Unit) Forecast, by Application 2019 & 2032
- Table 143: Rest of South America Virtual Care Market Revenue (Million) Forecast, by Application 2019 & 2032
- Table 144: Rest of South America Virtual Care Market Volume (K Unit) Forecast, by Application 2019 & 2032
Frequently Asked Questions
1. What is the projected Compound Annual Growth Rate (CAGR) of the Virtual Care Market?
The projected CAGR is approximately 26.10%.
2. Which companies are prominent players in the Virtual Care Market?
Key companies in the market include American Well Corporation, Oracle Corporation (Cerner), Teladoc Health Inc, United HealthCare Services Inc, MDLIVE, Medocity Inc, Amazon com Inc, General Electric Company, VirtualHealth, CVS Health.
3. What are the main segments of the Virtual Care Market?
The market segments include Mode of Delivery, Component, End Users.
4. Can you provide details about the market size?
The market size is estimated to be USD 12.84 Million as of 2022.
5. What are some drivers contributing to market growth?
Increasing Number of Patients Adopting Virtual Care and Government Initiatives Towards Virtual Care Access; Advantages Of Virtual Care and New Service Launches by Market Players.
6. What are the notable trends driving market growth?
Home Healthcare Segment is Expected to Witness Significant Growth Over the Forecast Period.
7. Are there any restraints impacting market growth?
Lack of Physician Support and Hospital Integration Issues Due to Privacy Concerns.
8. Can you provide examples of recent developments in the market?
In May 2022 CVS Health launched CVS Health Virtual Primary Care for its CVS Caremark members. The CVS Health Virtual Primary Care is a telehealth service that gives members an on-demand virtual care link to primary care providers, as well as urgent care, chronic care management, and behavioral care services, along with other services.
9. What pricing options are available for accessing the report?
Pricing options include single-user, multi-user, and enterprise licenses priced at USD 4750, USD 5250, and USD 8750 respectively.
10. Is the market size provided in terms of value or volume?
The market size is provided in terms of value, measured in Million and volume, measured in K Unit.
11. Are there any specific market keywords associated with the report?
Yes, the market keyword associated with the report is "Virtual Care Market," which aids in identifying and referencing the specific market segment covered.
12. How do I determine which pricing option suits my needs best?
The pricing options vary based on user requirements and access needs. Individual users may opt for single-user licenses, while businesses requiring broader access may choose multi-user or enterprise licenses for cost-effective access to the report.
13. Are there any additional resources or data provided in the Virtual Care Market report?
While the report offers comprehensive insights, it's advisable to review the specific contents or supplementary materials provided to ascertain if additional resources or data are available.
14. How can I stay updated on further developments or reports in the Virtual Care Market?
To stay informed about further developments, trends, and reports in the Virtual Care Market, consider subscribing to industry newsletters, following relevant companies and organizations, or regularly checking reputable industry news sources and publications.
Methodology
Step 1 - Identification of Relevant Samples Size from Population Database


Step 2 - Approaches for Defining Global Market Size (Value, Volume* & Price*)

Note*: In applicable scenarios
Step 3 - Data Sources
Primary Research
- Web Analytics
- Survey Reports
- Research Institute
- Latest Research Reports
- Opinion Leaders
Secondary Research
- Annual Reports
- White Paper
- Latest Press Release
- Industry Association
- Paid Database
- Investor Presentations

Step 4 - Data Triangulation
Involves using different sources of information in order to increase the validity of a study
These sources are likely to be stakeholders in a program - participants, other researchers, program staff, other community members, and so on.
Then we put all data in single framework & apply various statistical tools to find out the dynamic on the market.
During the analysis stage, feedback from the stakeholder groups would be compared to determine areas of agreement as well as areas of divergence
