

Key Insights
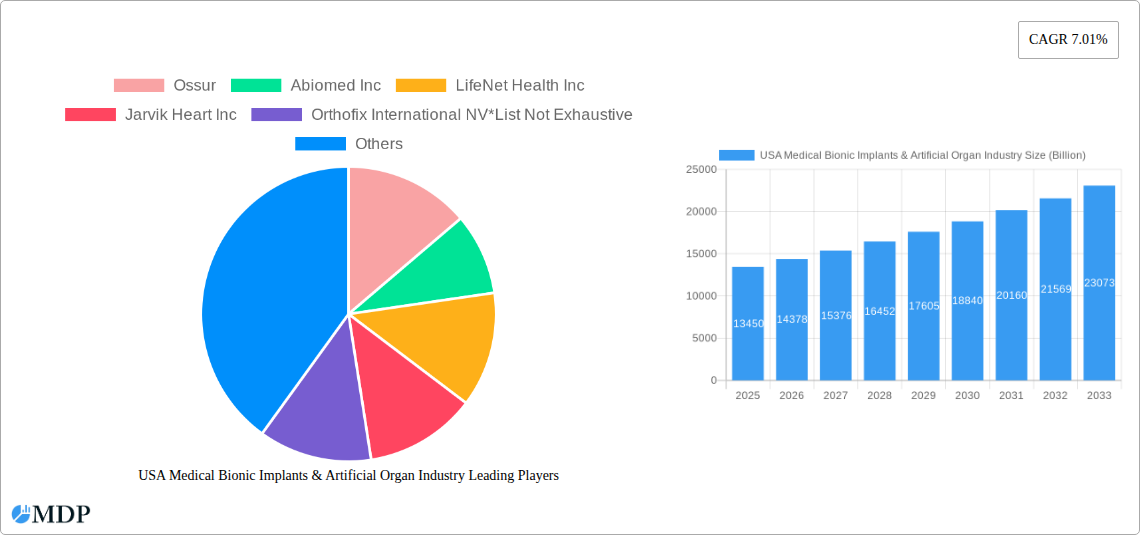
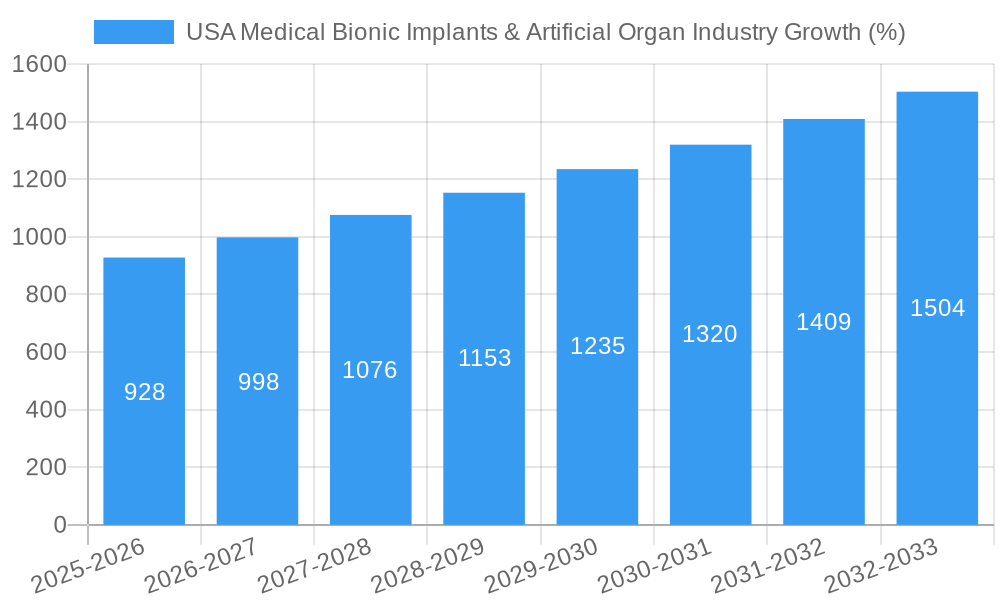
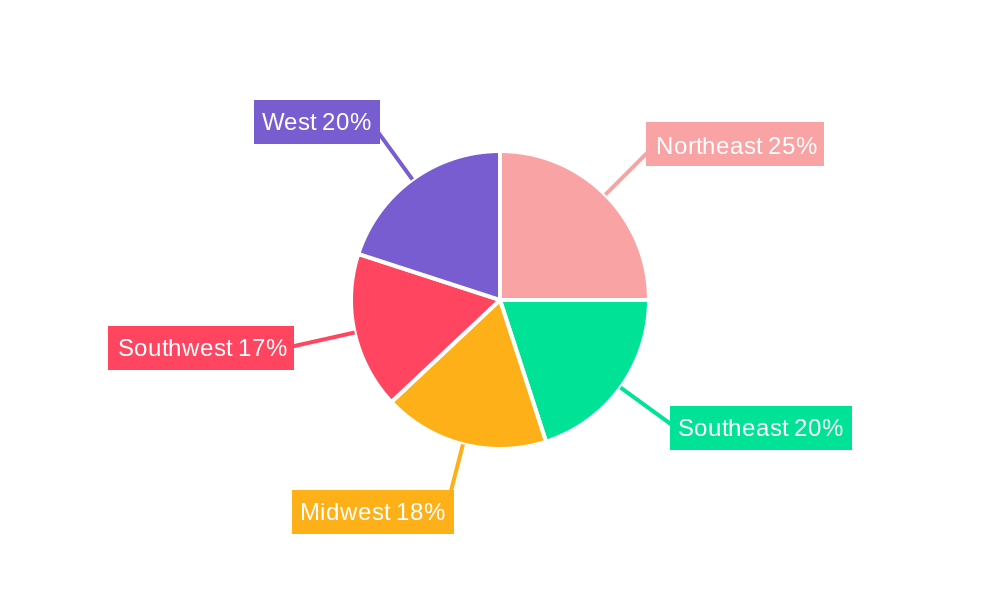
The U.S. medical bionic implants and artificial organ industry is a rapidly expanding market, projected to reach $13.45 billion in 2025 and maintain a robust Compound Annual Growth Rate (CAGR) of 7.01% from 2025 to 2033. This growth is fueled by several key drivers. An aging population experiencing increased prevalence of chronic diseases requiring organ replacement or functional augmentation significantly contributes to market expansion. Technological advancements in biomaterials, miniaturization, and improved surgical techniques are leading to more effective and less invasive procedures, further boosting market adoption. Rising healthcare expenditure and increased insurance coverage for advanced medical devices also play a crucial role. The market is segmented into artificial organs (such as artificial hearts, kidneys, and livers) and other bionic devices (like prosthetic limbs and cochlear implants). Artificial organs currently represent a larger market share due to the significant unmet medical needs in organ transplantation. However, advancements in bionics, especially in areas like neuroprosthetics and exoskeletons, are projected to drive substantial growth in this segment over the forecast period. Competition is fierce, with established players like Medtronic, Boston Scientific, and Ossur competing alongside emerging companies specializing in innovative technologies. Regional variations exist, with the Northeast, West, and Southeast regions exhibiting relatively higher market penetration due to factors such as higher concentrations of medical facilities and specialized healthcare professionals.
Regulatory hurdles and high costs associated with development, manufacturing, and implantation of these complex devices present significant market restraints. Furthermore, potential challenges related to device longevity, biocompatibility, and immune rejection remain key factors impacting market growth. Overcoming these challenges through continued research and development, coupled with initiatives to enhance affordability and access, will be critical for sustained market expansion. The industry is expected to witness significant innovation in areas such as personalized medicine, AI-driven diagnostics, and advanced materials science, further shaping the market landscape in the coming years. The increasing focus on minimally invasive procedures and remote patient monitoring will also contribute to market growth by improving patient outcomes and reducing healthcare costs.
USA Medical Bionic Implants & Artificial Organ Industry: A Comprehensive Market Report (2019-2033)
This comprehensive report provides an in-depth analysis of the burgeoning USA medical bionic implants and artificial organ industry, projecting a market valuation exceeding $XX Billion by 2033. The study covers the period 2019-2033, with 2025 serving as the base and estimated year. It offers crucial insights for industry stakeholders, investors, and researchers seeking a clear understanding of market dynamics, growth drivers, and future opportunities. This report leverages extensive data analysis and expert opinions to deliver actionable intelligence, forecasting market trends to 2033. Key players like Ossur, Abiomed Inc, LifeNet Health Inc, Jarvik Heart Inc, Orthofix International NV, Edward Lifesciences Corporation, Boston Scientific Corporation, Berlin Heart GmbH, Medtronic plc, and Ekso Bionics Holdings, Inc. are profiled, along with an analysis of market segments encompassing artificial organs and bionics.
USA Medical Bionic Implants & Artificial Organ Industry Market Dynamics & Concentration
The USA medical bionic implants and artificial organ market exhibits moderate concentration, with a few dominant players holding significant market share. Market share data for 2024 reveals that Medtronic plc holds approximately 25%, followed by Boston Scientific Corporation at 18%, and Abiomed Inc at 12%. The remaining share is distributed among numerous smaller companies and emerging players. Innovation is a key driver, fueled by advancements in materials science, biocompatibility, and minimally invasive surgical techniques. The regulatory landscape, particularly FDA approvals, significantly impacts market entry and growth. Product substitutes, such as improved pharmacological treatments, create competitive pressures. End-user trends, focusing on improved quality of life and longevity, are driving demand. Mergers and acquisitions (M&A) activity has been moderate, with approximately 5-7 significant deals annually in recent years, indicating consolidation within the sector.
- Market Share Concentration: Highlighted above
- Innovation Drivers: Advancements in materials science, biocompatibility, and minimally invasive surgery.
- Regulatory Framework: FDA approval processes heavily influence market entry.
- Product Substitutes: Pharmacological advancements provide alternative treatment options.
- End-User Trends: Increasing demand driven by improved quality of life and longevity expectations.
- M&A Activity: Approximately 5-7 major deals per year, indicating consolidation.
USA Medical Bionic Implants & Artificial Organ Industry Industry Trends & Analysis
The USA medical bionic implants and artificial organ industry is experiencing robust growth, driven by several key factors. Technological advancements, such as the development of biocompatible materials and improved surgical techniques, are expanding the range of available treatments. The aging population and increasing prevalence of chronic diseases are fueling demand for bionic implants and artificial organs. Consumer preference is shifting toward minimally invasive procedures and personalized medicine, placing pressure on companies to innovate. Intense competition among established players and emerging companies is driving innovation and price reductions, making these advanced technologies more accessible. The market is projected to grow at a Compound Annual Growth Rate (CAGR) of xx% during the forecast period (2025-2033), achieving a market value of $XX Billion by 2033. Market penetration for specific bionic implants varies, with high-demand areas experiencing faster growth.
Leading Markets & Segments in USA Medical Bionic Implants & Artificial Organ Industry
The dominant segment within the USA market is artificial organs, primarily driven by the growing prevalence of organ failure and the limitations of organ donation. Bionics, while a smaller segment currently, shows strong growth potential due to technological advancements in prosthetics and neural interfaces. Geographically, the largest market is concentrated in densely populated states with advanced healthcare infrastructure like California, New York, and Florida.
- Key Drivers for Artificial Organs Segment:
- High prevalence of organ failure.
- Shortage of organ donors.
- Advancements in biocompatible materials and surgical techniques.
- Key Drivers for Bionics Segment:
- Technological advancements in prosthetics and neural interfaces.
- Improved functionality and aesthetics of bionic devices.
- Rising demand from individuals with disabilities.
- Geographic Dominance: California, New York, and Florida lead due to high population density, established healthcare infrastructure, and research activity.
USA Medical Bionic Implants & Artificial Organ Industry Product Developments
Recent product innovations focus on improved biocompatibility, miniaturization, and enhanced functionality. Companies are developing smarter implants with integrated sensors and wireless connectivity for remote monitoring and personalized treatment. The emphasis is on creating devices that seamlessly integrate with the human body, minimizing invasiveness and maximizing patient comfort. This improves market fit by addressing patient needs for better long-term outcomes and higher quality of life.
Key Drivers of USA Medical Bionic Implants & Artificial Organ Industry Growth
Several factors are driving market growth: the aging population necessitates more advanced medical solutions; technological advancements are continuously improving the efficacy and safety of these devices; and increased government funding and private investment are supporting research and development. Favorable reimbursement policies and insurance coverage also contribute to accessibility.
Challenges in the USA Medical Bionic Implants & Artificial Organ Industry Market
Significant challenges include stringent regulatory pathways for approval, leading to delays in product launch and high development costs. Supply chain disruptions and the need for specialized manufacturing capabilities also pose obstacles. Competition is intense, particularly from established players with extensive market reach and resources. The high cost of these technologies limits accessibility for a significant portion of the population. This restricts market growth by lowering overall demand.
Emerging Opportunities in USA Medical Bionic Implants & Artificial Organ Industry
Long-term growth is fueled by potential breakthroughs in regenerative medicine and 3D bioprinting, which could revolutionize artificial organ production. Strategic partnerships between companies and research institutions are accelerating innovation. Expansion into emerging markets and telehealth applications will further broaden market reach and accessibility.
Leading Players in the USA Medical Bionic Implants & Artificial Organ Industry Sector
- Ossur
- Abiomed Inc
- LifeNet Health Inc
- Jarvik Heart Inc
- Orthofix International NV
- Edward Lifesciences Corporation
- Boston Scientific Corporation
- Berlin Heart GmbH
- Medtronic plc
- Ekso Bionics Holdings, Inc
Key Milestones in USA Medical Bionic Implants & Artificial Organ Industry Industry
- 2021: FDA approval of a new generation of biocompatible heart valve.
- 2022: Partnership between a major medical device company and a biotech firm to develop a bio-printed liver.
- 2023: Launch of a novel bionic arm with advanced sensory feedback.
- 2024: Successful clinical trial demonstrating the efficacy of a new artificial kidney.
Strategic Outlook for USA Medical Bionic Implants & Artificial Organ Industry Market
The future of the USA medical bionic implants and artificial organ industry is bright. Continued technological advancements, coupled with increasing awareness and demand, will drive significant growth. Strategic investments in research and development, coupled with strategic partnerships and market expansion, will be crucial for companies to capitalize on the substantial market potential. The focus on personalized medicine and improved integration with the human body will shape future product innovations.
USA Medical Bionic Implants & Artificial Organ Industry Segmentation
-
1. Product
-
1.1. Artificial Organs
- 1.1.1. Artificial Heart
- 1.1.2. Artificial Kidney
- 1.1.3. Cochlear Implants
- 1.1.4. Others
-
1.2. Bionics
- 1.2.1. Vision Bionics
- 1.2.2. Ear Bionics
- 1.2.3. Orthopedic Bionic
- 1.2.4. Cardiac Bionics
-
1.1. Artificial Organs
USA Medical Bionic Implants & Artificial Organ Industry Segmentation By Geography
-
1. North America
- 1.1. United States
- 1.2. Canada
- 1.3. Mexico
-
2. South America
- 2.1. Brazil
- 2.2. Argentina
- 2.3. Rest of South America
-
3. Europe
- 3.1. United Kingdom
- 3.2. Germany
- 3.3. France
- 3.4. Italy
- 3.5. Spain
- 3.6. Russia
- 3.7. Benelux
- 3.8. Nordics
- 3.9. Rest of Europe
-
4. Middle East & Africa
- 4.1. Turkey
- 4.2. Israel
- 4.3. GCC
- 4.4. North Africa
- 4.5. South Africa
- 4.6. Rest of Middle East & Africa
-
5. Asia Pacific
- 5.1. China
- 5.2. India
- 5.3. Japan
- 5.4. South Korea
- 5.5. ASEAN
- 5.6. Oceania
- 5.7. Rest of Asia Pacific
USA Medical Bionic Implants & Artificial Organ Industry REPORT HIGHLIGHTS
| Aspects | Details |
|---|---|
| Study Period | 2019-2033 |
| Base Year | 2024 |
| Estimated Year | 2025 |
| Forecast Period | 2025-2033 |
| Historical Period | 2019-2024 |
| Growth Rate | CAGR of 7.01% from 2019-2033 |
| Segmentation |
|
Table of Contents
- 1. Introduction
- 1.1. Research Scope
- 1.2. Market Segmentation
- 1.3. Research Methodology
- 1.4. Definitions and Assumptions
- 2. Executive Summary
- 2.1. Introduction
- 3. Market Dynamics
- 3.1. Introduction
- 3.2. Market Drivers
- 3.2.1. Increased Incidence of Disabilities and Organ Failures; Technological Advancements Leading to Enhanced Applications
- 3.3. Market Restrains
- 3.3.1. Expensive Procedures; Fear of Device Malfunction and its Consequences
- 3.4. Market Trends
- 3.4.1. Cardiac Bionics Segment is Expected to Have a Highest Growth Rate in the Forecast Period
- 4. Market Factor Analysis
- 4.1. Porters Five Forces
- 4.2. Supply/Value Chain
- 4.3. PESTEL analysis
- 4.4. Market Entropy
- 4.5. Patent/Trademark Analysis
- 5. Global USA Medical Bionic Implants & Artificial Organ Industry Analysis, Insights and Forecast, 2019-2031
- 5.1. Market Analysis, Insights and Forecast - by Product
- 5.1.1. Artificial Organs
- 5.1.1.1. Artificial Heart
- 5.1.1.2. Artificial Kidney
- 5.1.1.3. Cochlear Implants
- 5.1.1.4. Others
- 5.1.2. Bionics
- 5.1.2.1. Vision Bionics
- 5.1.2.2. Ear Bionics
- 5.1.2.3. Orthopedic Bionic
- 5.1.2.4. Cardiac Bionics
- 5.1.1. Artificial Organs
- 5.2. Market Analysis, Insights and Forecast - by Region
- 5.2.1. North America
- 5.2.2. South America
- 5.2.3. Europe
- 5.2.4. Middle East & Africa
- 5.2.5. Asia Pacific
- 5.1. Market Analysis, Insights and Forecast - by Product
- 6. North America USA Medical Bionic Implants & Artificial Organ Industry Analysis, Insights and Forecast, 2019-2031
- 6.1. Market Analysis, Insights and Forecast - by Product
- 6.1.1. Artificial Organs
- 6.1.1.1. Artificial Heart
- 6.1.1.2. Artificial Kidney
- 6.1.1.3. Cochlear Implants
- 6.1.1.4. Others
- 6.1.2. Bionics
- 6.1.2.1. Vision Bionics
- 6.1.2.2. Ear Bionics
- 6.1.2.3. Orthopedic Bionic
- 6.1.2.4. Cardiac Bionics
- 6.1.1. Artificial Organs
- 6.1. Market Analysis, Insights and Forecast - by Product
- 7. South America USA Medical Bionic Implants & Artificial Organ Industry Analysis, Insights and Forecast, 2019-2031
- 7.1. Market Analysis, Insights and Forecast - by Product
- 7.1.1. Artificial Organs
- 7.1.1.1. Artificial Heart
- 7.1.1.2. Artificial Kidney
- 7.1.1.3. Cochlear Implants
- 7.1.1.4. Others
- 7.1.2. Bionics
- 7.1.2.1. Vision Bionics
- 7.1.2.2. Ear Bionics
- 7.1.2.3. Orthopedic Bionic
- 7.1.2.4. Cardiac Bionics
- 7.1.1. Artificial Organs
- 7.1. Market Analysis, Insights and Forecast - by Product
- 8. Europe USA Medical Bionic Implants & Artificial Organ Industry Analysis, Insights and Forecast, 2019-2031
- 8.1. Market Analysis, Insights and Forecast - by Product
- 8.1.1. Artificial Organs
- 8.1.1.1. Artificial Heart
- 8.1.1.2. Artificial Kidney
- 8.1.1.3. Cochlear Implants
- 8.1.1.4. Others
- 8.1.2. Bionics
- 8.1.2.1. Vision Bionics
- 8.1.2.2. Ear Bionics
- 8.1.2.3. Orthopedic Bionic
- 8.1.2.4. Cardiac Bionics
- 8.1.1. Artificial Organs
- 8.1. Market Analysis, Insights and Forecast - by Product
- 9. Middle East & Africa USA Medical Bionic Implants & Artificial Organ Industry Analysis, Insights and Forecast, 2019-2031
- 9.1. Market Analysis, Insights and Forecast - by Product
- 9.1.1. Artificial Organs
- 9.1.1.1. Artificial Heart
- 9.1.1.2. Artificial Kidney
- 9.1.1.3. Cochlear Implants
- 9.1.1.4. Others
- 9.1.2. Bionics
- 9.1.2.1. Vision Bionics
- 9.1.2.2. Ear Bionics
- 9.1.2.3. Orthopedic Bionic
- 9.1.2.4. Cardiac Bionics
- 9.1.1. Artificial Organs
- 9.1. Market Analysis, Insights and Forecast - by Product
- 10. Asia Pacific USA Medical Bionic Implants & Artificial Organ Industry Analysis, Insights and Forecast, 2019-2031
- 10.1. Market Analysis, Insights and Forecast - by Product
- 10.1.1. Artificial Organs
- 10.1.1.1. Artificial Heart
- 10.1.1.2. Artificial Kidney
- 10.1.1.3. Cochlear Implants
- 10.1.1.4. Others
- 10.1.2. Bionics
- 10.1.2.1. Vision Bionics
- 10.1.2.2. Ear Bionics
- 10.1.2.3. Orthopedic Bionic
- 10.1.2.4. Cardiac Bionics
- 10.1.1. Artificial Organs
- 10.1. Market Analysis, Insights and Forecast - by Product
- 11. Northeast USA Medical Bionic Implants & Artificial Organ Industry Analysis, Insights and Forecast, 2019-2031
- 12. Southeast USA Medical Bionic Implants & Artificial Organ Industry Analysis, Insights and Forecast, 2019-2031
- 13. Midwest USA Medical Bionic Implants & Artificial Organ Industry Analysis, Insights and Forecast, 2019-2031
- 14. Southwest USA Medical Bionic Implants & Artificial Organ Industry Analysis, Insights and Forecast, 2019-2031
- 15. West USA Medical Bionic Implants & Artificial Organ Industry Analysis, Insights and Forecast, 2019-2031
- 16. Competitive Analysis
- 16.1. Global Market Share Analysis 2024
- 16.2. Company Profiles
- 16.2.1 Ossur
- 16.2.1.1. Overview
- 16.2.1.2. Products
- 16.2.1.3. SWOT Analysis
- 16.2.1.4. Recent Developments
- 16.2.1.5. Financials (Based on Availability)
- 16.2.2 Abiomed Inc
- 16.2.2.1. Overview
- 16.2.2.2. Products
- 16.2.2.3. SWOT Analysis
- 16.2.2.4. Recent Developments
- 16.2.2.5. Financials (Based on Availability)
- 16.2.3 LifeNet Health Inc
- 16.2.3.1. Overview
- 16.2.3.2. Products
- 16.2.3.3. SWOT Analysis
- 16.2.3.4. Recent Developments
- 16.2.3.5. Financials (Based on Availability)
- 16.2.4 Jarvik Heart Inc
- 16.2.4.1. Overview
- 16.2.4.2. Products
- 16.2.4.3. SWOT Analysis
- 16.2.4.4. Recent Developments
- 16.2.4.5. Financials (Based on Availability)
- 16.2.5 Orthofix International NV*List Not Exhaustive
- 16.2.5.1. Overview
- 16.2.5.2. Products
- 16.2.5.3. SWOT Analysis
- 16.2.5.4. Recent Developments
- 16.2.5.5. Financials (Based on Availability)
- 16.2.6 Edward Lifesciences Corporation
- 16.2.6.1. Overview
- 16.2.6.2. Products
- 16.2.6.3. SWOT Analysis
- 16.2.6.4. Recent Developments
- 16.2.6.5. Financials (Based on Availability)
- 16.2.7 Boston Scientific Corporation
- 16.2.7.1. Overview
- 16.2.7.2. Products
- 16.2.7.3. SWOT Analysis
- 16.2.7.4. Recent Developments
- 16.2.7.5. Financials (Based on Availability)
- 16.2.8 Berlin Heart GmbH
- 16.2.8.1. Overview
- 16.2.8.2. Products
- 16.2.8.3. SWOT Analysis
- 16.2.8.4. Recent Developments
- 16.2.8.5. Financials (Based on Availability)
- 16.2.9 Medtronic plc
- 16.2.9.1. Overview
- 16.2.9.2. Products
- 16.2.9.3. SWOT Analysis
- 16.2.9.4. Recent Developments
- 16.2.9.5. Financials (Based on Availability)
- 16.2.10 Ekso Bionics Holdings Inc
- 16.2.10.1. Overview
- 16.2.10.2. Products
- 16.2.10.3. SWOT Analysis
- 16.2.10.4. Recent Developments
- 16.2.10.5. Financials (Based on Availability)
- 16.2.1 Ossur
List of Figures
- Figure 1: Global USA Medical Bionic Implants & Artificial Organ Industry Revenue Breakdown (Billion, %) by Region 2024 & 2032
- Figure 2: Global USA Medical Bionic Implants & Artificial Organ Industry Volume Breakdown (Piece, %) by Region 2024 & 2032
- Figure 3: United states USA Medical Bionic Implants & Artificial Organ Industry Revenue (Billion), by Country 2024 & 2032
- Figure 4: United states USA Medical Bionic Implants & Artificial Organ Industry Volume (Piece), by Country 2024 & 2032
- Figure 5: United states USA Medical Bionic Implants & Artificial Organ Industry Revenue Share (%), by Country 2024 & 2032
- Figure 6: United states USA Medical Bionic Implants & Artificial Organ Industry Volume Share (%), by Country 2024 & 2032
- Figure 7: North America USA Medical Bionic Implants & Artificial Organ Industry Revenue (Billion), by Product 2024 & 2032
- Figure 8: North America USA Medical Bionic Implants & Artificial Organ Industry Volume (Piece), by Product 2024 & 2032
- Figure 9: North America USA Medical Bionic Implants & Artificial Organ Industry Revenue Share (%), by Product 2024 & 2032
- Figure 10: North America USA Medical Bionic Implants & Artificial Organ Industry Volume Share (%), by Product 2024 & 2032
- Figure 11: North America USA Medical Bionic Implants & Artificial Organ Industry Revenue (Billion), by Country 2024 & 2032
- Figure 12: North America USA Medical Bionic Implants & Artificial Organ Industry Volume (Piece), by Country 2024 & 2032
- Figure 13: North America USA Medical Bionic Implants & Artificial Organ Industry Revenue Share (%), by Country 2024 & 2032
- Figure 14: North America USA Medical Bionic Implants & Artificial Organ Industry Volume Share (%), by Country 2024 & 2032
- Figure 15: South America USA Medical Bionic Implants & Artificial Organ Industry Revenue (Billion), by Product 2024 & 2032
- Figure 16: South America USA Medical Bionic Implants & Artificial Organ Industry Volume (Piece), by Product 2024 & 2032
- Figure 17: South America USA Medical Bionic Implants & Artificial Organ Industry Revenue Share (%), by Product 2024 & 2032
- Figure 18: South America USA Medical Bionic Implants & Artificial Organ Industry Volume Share (%), by Product 2024 & 2032
- Figure 19: South America USA Medical Bionic Implants & Artificial Organ Industry Revenue (Billion), by Country 2024 & 2032
- Figure 20: South America USA Medical Bionic Implants & Artificial Organ Industry Volume (Piece), by Country 2024 & 2032
- Figure 21: South America USA Medical Bionic Implants & Artificial Organ Industry Revenue Share (%), by Country 2024 & 2032
- Figure 22: South America USA Medical Bionic Implants & Artificial Organ Industry Volume Share (%), by Country 2024 & 2032
- Figure 23: Europe USA Medical Bionic Implants & Artificial Organ Industry Revenue (Billion), by Product 2024 & 2032
- Figure 24: Europe USA Medical Bionic Implants & Artificial Organ Industry Volume (Piece), by Product 2024 & 2032
- Figure 25: Europe USA Medical Bionic Implants & Artificial Organ Industry Revenue Share (%), by Product 2024 & 2032
- Figure 26: Europe USA Medical Bionic Implants & Artificial Organ Industry Volume Share (%), by Product 2024 & 2032
- Figure 27: Europe USA Medical Bionic Implants & Artificial Organ Industry Revenue (Billion), by Country 2024 & 2032
- Figure 28: Europe USA Medical Bionic Implants & Artificial Organ Industry Volume (Piece), by Country 2024 & 2032
- Figure 29: Europe USA Medical Bionic Implants & Artificial Organ Industry Revenue Share (%), by Country 2024 & 2032
- Figure 30: Europe USA Medical Bionic Implants & Artificial Organ Industry Volume Share (%), by Country 2024 & 2032
- Figure 31: Middle East & Africa USA Medical Bionic Implants & Artificial Organ Industry Revenue (Billion), by Product 2024 & 2032
- Figure 32: Middle East & Africa USA Medical Bionic Implants & Artificial Organ Industry Volume (Piece), by Product 2024 & 2032
- Figure 33: Middle East & Africa USA Medical Bionic Implants & Artificial Organ Industry Revenue Share (%), by Product 2024 & 2032
- Figure 34: Middle East & Africa USA Medical Bionic Implants & Artificial Organ Industry Volume Share (%), by Product 2024 & 2032
- Figure 35: Middle East & Africa USA Medical Bionic Implants & Artificial Organ Industry Revenue (Billion), by Country 2024 & 2032
- Figure 36: Middle East & Africa USA Medical Bionic Implants & Artificial Organ Industry Volume (Piece), by Country 2024 & 2032
- Figure 37: Middle East & Africa USA Medical Bionic Implants & Artificial Organ Industry Revenue Share (%), by Country 2024 & 2032
- Figure 38: Middle East & Africa USA Medical Bionic Implants & Artificial Organ Industry Volume Share (%), by Country 2024 & 2032
- Figure 39: Asia Pacific USA Medical Bionic Implants & Artificial Organ Industry Revenue (Billion), by Product 2024 & 2032
- Figure 40: Asia Pacific USA Medical Bionic Implants & Artificial Organ Industry Volume (Piece), by Product 2024 & 2032
- Figure 41: Asia Pacific USA Medical Bionic Implants & Artificial Organ Industry Revenue Share (%), by Product 2024 & 2032
- Figure 42: Asia Pacific USA Medical Bionic Implants & Artificial Organ Industry Volume Share (%), by Product 2024 & 2032
- Figure 43: Asia Pacific USA Medical Bionic Implants & Artificial Organ Industry Revenue (Billion), by Country 2024 & 2032
- Figure 44: Asia Pacific USA Medical Bionic Implants & Artificial Organ Industry Volume (Piece), by Country 2024 & 2032
- Figure 45: Asia Pacific USA Medical Bionic Implants & Artificial Organ Industry Revenue Share (%), by Country 2024 & 2032
- Figure 46: Asia Pacific USA Medical Bionic Implants & Artificial Organ Industry Volume Share (%), by Country 2024 & 2032
List of Tables
- Table 1: Global USA Medical Bionic Implants & Artificial Organ Industry Revenue Billion Forecast, by Region 2019 & 2032
- Table 2: Global USA Medical Bionic Implants & Artificial Organ Industry Volume Piece Forecast, by Region 2019 & 2032
- Table 3: Global USA Medical Bionic Implants & Artificial Organ Industry Revenue Billion Forecast, by Product 2019 & 2032
- Table 4: Global USA Medical Bionic Implants & Artificial Organ Industry Volume Piece Forecast, by Product 2019 & 2032
- Table 5: Global USA Medical Bionic Implants & Artificial Organ Industry Revenue Billion Forecast, by Region 2019 & 2032
- Table 6: Global USA Medical Bionic Implants & Artificial Organ Industry Volume Piece Forecast, by Region 2019 & 2032
- Table 7: Global USA Medical Bionic Implants & Artificial Organ Industry Revenue Billion Forecast, by Country 2019 & 2032
- Table 8: Global USA Medical Bionic Implants & Artificial Organ Industry Volume Piece Forecast, by Country 2019 & 2032
- Table 9: Northeast USA Medical Bionic Implants & Artificial Organ Industry Revenue (Billion) Forecast, by Application 2019 & 2032
- Table 10: Northeast USA Medical Bionic Implants & Artificial Organ Industry Volume (Piece) Forecast, by Application 2019 & 2032
- Table 11: Southeast USA Medical Bionic Implants & Artificial Organ Industry Revenue (Billion) Forecast, by Application 2019 & 2032
- Table 12: Southeast USA Medical Bionic Implants & Artificial Organ Industry Volume (Piece) Forecast, by Application 2019 & 2032
- Table 13: Midwest USA Medical Bionic Implants & Artificial Organ Industry Revenue (Billion) Forecast, by Application 2019 & 2032
- Table 14: Midwest USA Medical Bionic Implants & Artificial Organ Industry Volume (Piece) Forecast, by Application 2019 & 2032
- Table 15: Southwest USA Medical Bionic Implants & Artificial Organ Industry Revenue (Billion) Forecast, by Application 2019 & 2032
- Table 16: Southwest USA Medical Bionic Implants & Artificial Organ Industry Volume (Piece) Forecast, by Application 2019 & 2032
- Table 17: West USA Medical Bionic Implants & Artificial Organ Industry Revenue (Billion) Forecast, by Application 2019 & 2032
- Table 18: West USA Medical Bionic Implants & Artificial Organ Industry Volume (Piece) Forecast, by Application 2019 & 2032
- Table 19: Global USA Medical Bionic Implants & Artificial Organ Industry Revenue Billion Forecast, by Product 2019 & 2032
- Table 20: Global USA Medical Bionic Implants & Artificial Organ Industry Volume Piece Forecast, by Product 2019 & 2032
- Table 21: Global USA Medical Bionic Implants & Artificial Organ Industry Revenue Billion Forecast, by Country 2019 & 2032
- Table 22: Global USA Medical Bionic Implants & Artificial Organ Industry Volume Piece Forecast, by Country 2019 & 2032
- Table 23: United States USA Medical Bionic Implants & Artificial Organ Industry Revenue (Billion) Forecast, by Application 2019 & 2032
- Table 24: United States USA Medical Bionic Implants & Artificial Organ Industry Volume (Piece) Forecast, by Application 2019 & 2032
- Table 25: Canada USA Medical Bionic Implants & Artificial Organ Industry Revenue (Billion) Forecast, by Application 2019 & 2032
- Table 26: Canada USA Medical Bionic Implants & Artificial Organ Industry Volume (Piece) Forecast, by Application 2019 & 2032
- Table 27: Mexico USA Medical Bionic Implants & Artificial Organ Industry Revenue (Billion) Forecast, by Application 2019 & 2032
- Table 28: Mexico USA Medical Bionic Implants & Artificial Organ Industry Volume (Piece) Forecast, by Application 2019 & 2032
- Table 29: Global USA Medical Bionic Implants & Artificial Organ Industry Revenue Billion Forecast, by Product 2019 & 2032
- Table 30: Global USA Medical Bionic Implants & Artificial Organ Industry Volume Piece Forecast, by Product 2019 & 2032
- Table 31: Global USA Medical Bionic Implants & Artificial Organ Industry Revenue Billion Forecast, by Country 2019 & 2032
- Table 32: Global USA Medical Bionic Implants & Artificial Organ Industry Volume Piece Forecast, by Country 2019 & 2032
- Table 33: Brazil USA Medical Bionic Implants & Artificial Organ Industry Revenue (Billion) Forecast, by Application 2019 & 2032
- Table 34: Brazil USA Medical Bionic Implants & Artificial Organ Industry Volume (Piece) Forecast, by Application 2019 & 2032
- Table 35: Argentina USA Medical Bionic Implants & Artificial Organ Industry Revenue (Billion) Forecast, by Application 2019 & 2032
- Table 36: Argentina USA Medical Bionic Implants & Artificial Organ Industry Volume (Piece) Forecast, by Application 2019 & 2032
- Table 37: Rest of South America USA Medical Bionic Implants & Artificial Organ Industry Revenue (Billion) Forecast, by Application 2019 & 2032
- Table 38: Rest of South America USA Medical Bionic Implants & Artificial Organ Industry Volume (Piece) Forecast, by Application 2019 & 2032
- Table 39: Global USA Medical Bionic Implants & Artificial Organ Industry Revenue Billion Forecast, by Product 2019 & 2032
- Table 40: Global USA Medical Bionic Implants & Artificial Organ Industry Volume Piece Forecast, by Product 2019 & 2032
- Table 41: Global USA Medical Bionic Implants & Artificial Organ Industry Revenue Billion Forecast, by Country 2019 & 2032
- Table 42: Global USA Medical Bionic Implants & Artificial Organ Industry Volume Piece Forecast, by Country 2019 & 2032
- Table 43: United Kingdom USA Medical Bionic Implants & Artificial Organ Industry Revenue (Billion) Forecast, by Application 2019 & 2032
- Table 44: United Kingdom USA Medical Bionic Implants & Artificial Organ Industry Volume (Piece) Forecast, by Application 2019 & 2032
- Table 45: Germany USA Medical Bionic Implants & Artificial Organ Industry Revenue (Billion) Forecast, by Application 2019 & 2032
- Table 46: Germany USA Medical Bionic Implants & Artificial Organ Industry Volume (Piece) Forecast, by Application 2019 & 2032
- Table 47: France USA Medical Bionic Implants & Artificial Organ Industry Revenue (Billion) Forecast, by Application 2019 & 2032
- Table 48: France USA Medical Bionic Implants & Artificial Organ Industry Volume (Piece) Forecast, by Application 2019 & 2032
- Table 49: Italy USA Medical Bionic Implants & Artificial Organ Industry Revenue (Billion) Forecast, by Application 2019 & 2032
- Table 50: Italy USA Medical Bionic Implants & Artificial Organ Industry Volume (Piece) Forecast, by Application 2019 & 2032
- Table 51: Spain USA Medical Bionic Implants & Artificial Organ Industry Revenue (Billion) Forecast, by Application 2019 & 2032
- Table 52: Spain USA Medical Bionic Implants & Artificial Organ Industry Volume (Piece) Forecast, by Application 2019 & 2032
- Table 53: Russia USA Medical Bionic Implants & Artificial Organ Industry Revenue (Billion) Forecast, by Application 2019 & 2032
- Table 54: Russia USA Medical Bionic Implants & Artificial Organ Industry Volume (Piece) Forecast, by Application 2019 & 2032
- Table 55: Benelux USA Medical Bionic Implants & Artificial Organ Industry Revenue (Billion) Forecast, by Application 2019 & 2032
- Table 56: Benelux USA Medical Bionic Implants & Artificial Organ Industry Volume (Piece) Forecast, by Application 2019 & 2032
- Table 57: Nordics USA Medical Bionic Implants & Artificial Organ Industry Revenue (Billion) Forecast, by Application 2019 & 2032
- Table 58: Nordics USA Medical Bionic Implants & Artificial Organ Industry Volume (Piece) Forecast, by Application 2019 & 2032
- Table 59: Rest of Europe USA Medical Bionic Implants & Artificial Organ Industry Revenue (Billion) Forecast, by Application 2019 & 2032
- Table 60: Rest of Europe USA Medical Bionic Implants & Artificial Organ Industry Volume (Piece) Forecast, by Application 2019 & 2032
- Table 61: Global USA Medical Bionic Implants & Artificial Organ Industry Revenue Billion Forecast, by Product 2019 & 2032
- Table 62: Global USA Medical Bionic Implants & Artificial Organ Industry Volume Piece Forecast, by Product 2019 & 2032
- Table 63: Global USA Medical Bionic Implants & Artificial Organ Industry Revenue Billion Forecast, by Country 2019 & 2032
- Table 64: Global USA Medical Bionic Implants & Artificial Organ Industry Volume Piece Forecast, by Country 2019 & 2032
- Table 65: Turkey USA Medical Bionic Implants & Artificial Organ Industry Revenue (Billion) Forecast, by Application 2019 & 2032
- Table 66: Turkey USA Medical Bionic Implants & Artificial Organ Industry Volume (Piece) Forecast, by Application 2019 & 2032
- Table 67: Israel USA Medical Bionic Implants & Artificial Organ Industry Revenue (Billion) Forecast, by Application 2019 & 2032
- Table 68: Israel USA Medical Bionic Implants & Artificial Organ Industry Volume (Piece) Forecast, by Application 2019 & 2032
- Table 69: GCC USA Medical Bionic Implants & Artificial Organ Industry Revenue (Billion) Forecast, by Application 2019 & 2032
- Table 70: GCC USA Medical Bionic Implants & Artificial Organ Industry Volume (Piece) Forecast, by Application 2019 & 2032
- Table 71: North Africa USA Medical Bionic Implants & Artificial Organ Industry Revenue (Billion) Forecast, by Application 2019 & 2032
- Table 72: North Africa USA Medical Bionic Implants & Artificial Organ Industry Volume (Piece) Forecast, by Application 2019 & 2032
- Table 73: South Africa USA Medical Bionic Implants & Artificial Organ Industry Revenue (Billion) Forecast, by Application 2019 & 2032
- Table 74: South Africa USA Medical Bionic Implants & Artificial Organ Industry Volume (Piece) Forecast, by Application 2019 & 2032
- Table 75: Rest of Middle East & Africa USA Medical Bionic Implants & Artificial Organ Industry Revenue (Billion) Forecast, by Application 2019 & 2032
- Table 76: Rest of Middle East & Africa USA Medical Bionic Implants & Artificial Organ Industry Volume (Piece) Forecast, by Application 2019 & 2032
- Table 77: Global USA Medical Bionic Implants & Artificial Organ Industry Revenue Billion Forecast, by Product 2019 & 2032
- Table 78: Global USA Medical Bionic Implants & Artificial Organ Industry Volume Piece Forecast, by Product 2019 & 2032
- Table 79: Global USA Medical Bionic Implants & Artificial Organ Industry Revenue Billion Forecast, by Country 2019 & 2032
- Table 80: Global USA Medical Bionic Implants & Artificial Organ Industry Volume Piece Forecast, by Country 2019 & 2032
- Table 81: China USA Medical Bionic Implants & Artificial Organ Industry Revenue (Billion) Forecast, by Application 2019 & 2032
- Table 82: China USA Medical Bionic Implants & Artificial Organ Industry Volume (Piece) Forecast, by Application 2019 & 2032
- Table 83: India USA Medical Bionic Implants & Artificial Organ Industry Revenue (Billion) Forecast, by Application 2019 & 2032
- Table 84: India USA Medical Bionic Implants & Artificial Organ Industry Volume (Piece) Forecast, by Application 2019 & 2032
- Table 85: Japan USA Medical Bionic Implants & Artificial Organ Industry Revenue (Billion) Forecast, by Application 2019 & 2032
- Table 86: Japan USA Medical Bionic Implants & Artificial Organ Industry Volume (Piece) Forecast, by Application 2019 & 2032
- Table 87: South Korea USA Medical Bionic Implants & Artificial Organ Industry Revenue (Billion) Forecast, by Application 2019 & 2032
- Table 88: South Korea USA Medical Bionic Implants & Artificial Organ Industry Volume (Piece) Forecast, by Application 2019 & 2032
- Table 89: ASEAN USA Medical Bionic Implants & Artificial Organ Industry Revenue (Billion) Forecast, by Application 2019 & 2032
- Table 90: ASEAN USA Medical Bionic Implants & Artificial Organ Industry Volume (Piece) Forecast, by Application 2019 & 2032
- Table 91: Oceania USA Medical Bionic Implants & Artificial Organ Industry Revenue (Billion) Forecast, by Application 2019 & 2032
- Table 92: Oceania USA Medical Bionic Implants & Artificial Organ Industry Volume (Piece) Forecast, by Application 2019 & 2032
- Table 93: Rest of Asia Pacific USA Medical Bionic Implants & Artificial Organ Industry Revenue (Billion) Forecast, by Application 2019 & 2032
- Table 94: Rest of Asia Pacific USA Medical Bionic Implants & Artificial Organ Industry Volume (Piece) Forecast, by Application 2019 & 2032
Frequently Asked Questions
1. What is the projected Compound Annual Growth Rate (CAGR) of the USA Medical Bionic Implants & Artificial Organ Industry?
The projected CAGR is approximately 7.01%.
2. Which companies are prominent players in the USA Medical Bionic Implants & Artificial Organ Industry?
Key companies in the market include Ossur, Abiomed Inc, LifeNet Health Inc, Jarvik Heart Inc, Orthofix International NV*List Not Exhaustive, Edward Lifesciences Corporation, Boston Scientific Corporation, Berlin Heart GmbH, Medtronic plc, Ekso Bionics Holdings, Inc.
3. What are the main segments of the USA Medical Bionic Implants & Artificial Organ Industry?
The market segments include Product.
4. Can you provide details about the market size?
The market size is estimated to be USD 13.45 Billion as of 2022.
5. What are some drivers contributing to market growth?
Increased Incidence of Disabilities and Organ Failures; Technological Advancements Leading to Enhanced Applications.
6. What are the notable trends driving market growth?
Cardiac Bionics Segment is Expected to Have a Highest Growth Rate in the Forecast Period.
7. Are there any restraints impacting market growth?
Expensive Procedures; Fear of Device Malfunction and its Consequences.
8. Can you provide examples of recent developments in the market?
N/A
9. What pricing options are available for accessing the report?
Pricing options include single-user, multi-user, and enterprise licenses priced at USD 3800, USD 4500, and USD 5800 respectively.
10. Is the market size provided in terms of value or volume?
The market size is provided in terms of value, measured in Billion and volume, measured in Piece.
11. Are there any specific market keywords associated with the report?
Yes, the market keyword associated with the report is "USA Medical Bionic Implants & Artificial Organ Industry," which aids in identifying and referencing the specific market segment covered.
12. How do I determine which pricing option suits my needs best?
The pricing options vary based on user requirements and access needs. Individual users may opt for single-user licenses, while businesses requiring broader access may choose multi-user or enterprise licenses for cost-effective access to the report.
13. Are there any additional resources or data provided in the USA Medical Bionic Implants & Artificial Organ Industry report?
While the report offers comprehensive insights, it's advisable to review the specific contents or supplementary materials provided to ascertain if additional resources or data are available.
14. How can I stay updated on further developments or reports in the USA Medical Bionic Implants & Artificial Organ Industry?
To stay informed about further developments, trends, and reports in the USA Medical Bionic Implants & Artificial Organ Industry, consider subscribing to industry newsletters, following relevant companies and organizations, or regularly checking reputable industry news sources and publications.
Methodology
Step 1 - Identification of Relevant Samples Size from Population Database


Step 2 - Approaches for Defining Global Market Size (Value, Volume* & Price*)

Note*: In applicable scenarios
Step 3 - Data Sources
Primary Research
- Web Analytics
- Survey Reports
- Research Institute
- Latest Research Reports
- Opinion Leaders
Secondary Research
- Annual Reports
- White Paper
- Latest Press Release
- Industry Association
- Paid Database
- Investor Presentations

Step 4 - Data Triangulation
Involves using different sources of information in order to increase the validity of a study
These sources are likely to be stakeholders in a program - participants, other researchers, program staff, other community members, and so on.
Then we put all data in single framework & apply various statistical tools to find out the dynamic on the market.
During the analysis stage, feedback from the stakeholder groups would be compared to determine areas of agreement as well as areas of divergence
