

Key Insights
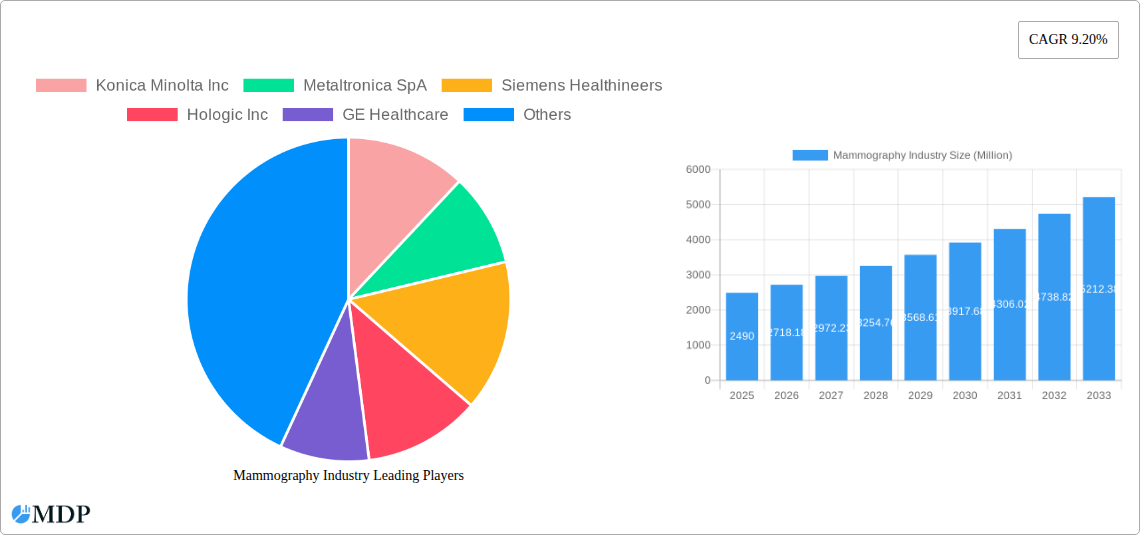
The global mammography market, valued at $2.49 billion in 2025, is projected to experience robust growth, driven by a 9.20% CAGR from 2025 to 2033. This expansion is fueled by several key factors. Rising prevalence of breast cancer, particularly among women in developing nations, necessitates increased screening and diagnostic capabilities. Technological advancements, such as the introduction of digital mammography systems offering improved image quality and reduced radiation exposure, are significantly impacting market growth. Furthermore, the increasing adoption of breast tomosynthesis, providing superior 3D imaging for enhanced lesion detection, is driving market demand. The shift towards preventative healthcare and early detection initiatives further contributes to the market's expansion. Growth is also witnessed across various segments, with digital systems holding a significant market share due to their advantages in image processing, storage, and remote diagnosis. Hospitals and specialty clinics are the primary end-users, although the diagnostic center segment is showing promising growth potential.
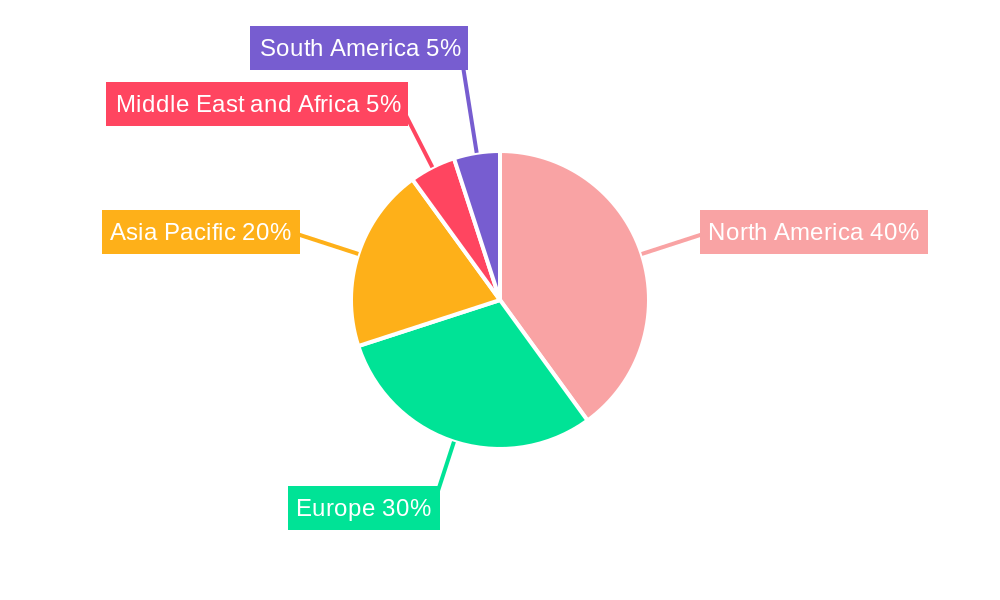
Geographical distribution shows North America and Europe as mature markets, contributing significantly to the overall market size. However, rapid economic growth and rising healthcare infrastructure investment in Asia-Pacific are expected to drive substantial growth in this region during the forecast period. The market faces some challenges, including high equipment costs, which can limit accessibility in certain regions, and the need for skilled professionals to operate and interpret the advanced imaging systems. Despite these constraints, the long-term outlook for the mammography market remains positive, driven by the imperative for early breast cancer detection and the continuous innovation in imaging technology. Competition among established players like Hologic, Siemens Healthineers, and Fujifilm, along with emerging companies, further intensifies market dynamics, resulting in ongoing product development and improvements.
Mammography Industry Market Report: 2019-2033
This comprehensive report provides an in-depth analysis of the global mammography industry, offering invaluable insights for stakeholders across the value chain. With a study period spanning 2019-2033, a base year of 2025, and a forecast period of 2025-2033, this report leverages extensive data analysis to project future market trends and identify key opportunities. The report incorporates high-impact keywords for optimal search engine visibility, including "mammography market," "breast tomosynthesis," "digital mammography systems," "AI in mammography," and leading player names like Hologic and Siemens Healthineers.
Mammography Industry Market Dynamics & Concentration
The global mammography market, valued at xx Million in 2024, is characterized by a moderately concentrated landscape. Key players, including Hologic Inc, Siemens Healthineers, and Fujifilm Holdings Corporation, hold significant market share, driven by their extensive product portfolios and global reach. However, the market also features several smaller players, particularly in the specialized segments like breast tomosynthesis.
Market concentration is influenced by several factors:
- Innovation: Continuous technological advancements, such as AI-powered image analysis and 3D tomosynthesis, are driving innovation and creating new avenues for market entry.
- Regulatory Frameworks: Stringent regulatory requirements for medical devices impact market access and influence the competitiveness of players. Compliance costs and varying regulatory landscapes across different countries create both opportunities and challenges.
- Product Substitutes: While mammography remains the gold standard for breast cancer screening, alternative technologies are emerging, potentially impacting market growth.
- End-User Trends: Increasing awareness of breast cancer and the rising prevalence of the disease are driving demand for advanced mammography services, particularly in developed economies. Hospitals remain the largest end-users, followed by specialty clinics and diagnostic centers. The shift toward outpatient care is creating growth opportunities for diagnostic centers and specialty clinics.
- M&A Activities: The mammography market has witnessed a moderate level of mergers and acquisitions (M&A) activity in recent years, with xx major deals recorded between 2019 and 2024. These activities often aim to enhance product portfolios, expand market reach, and improve technological capabilities.
Mammography Industry Industry Trends & Analysis
The global mammography market is experiencing robust growth, with a projected Compound Annual Growth Rate (CAGR) of xx% during the forecast period (2025-2033). This growth is fueled by several key trends:
- Technological Disruptions: The integration of artificial intelligence (AI) and machine learning (ML) in mammography systems is significantly improving diagnostic accuracy and efficiency. This includes features like computer-aided detection (CAD) and automated image analysis. The adoption of AI is expected to accelerate significantly over the forecast period, resulting in improved market penetration for advanced systems. Further technological advancements such as the increasing availability of digital mammography systems is reducing costs.
- Market Growth Drivers: Increasing incidence of breast cancer globally, rising awareness campaigns for early detection, and government initiatives promoting preventive healthcare are driving substantial demand for mammography services.
- Consumer Preferences: Patients are increasingly demanding faster, more comfortable, and less radiation-intensive mammography procedures. This drives demand for advanced techniques like breast tomosynthesis and digital mammography, which offer improved image quality and reduced radiation exposure.
- Competitive Dynamics: The market is characterized by intense competition among established players, with continuous efforts towards product innovation, strategic partnerships, and geographic expansion. Price competition and the need to meet stringent regulatory requirements further intensify the competitive landscape.
Leading Markets & Segments in Mammography Industry
North America currently dominates the global mammography market, driven by high healthcare expenditure, advanced healthcare infrastructure, and a higher prevalence of breast cancer. Europe and Asia Pacific are also witnessing substantial growth.
Key Drivers:
- North America: High healthcare spending, advanced medical infrastructure, early detection initiatives, and established reimbursement policies.
- Europe: Growing awareness of breast cancer, rising investments in healthcare infrastructure, and favorable regulatory environments.
- Asia Pacific: Increasing healthcare expenditure, rising prevalence of breast cancer, growing adoption of advanced technologies, and supportive government policies.
Segment Dominance:
- Product Type: Digital mammography systems hold the largest market share, driven by improved image quality, reduced radiation exposure, and efficient workflow. The segment of breast tomosynthesis is also experiencing significant growth, driven by its superior diagnostic capabilities. Analog systems are gradually declining in market share.
- End Users: Hospitals continue to dominate the market, accounting for the largest share of mammography procedures. However, the growing number of specialty clinics and diagnostic centers is driving growth in these segments as well.
Mammography Industry Product Developments
Recent product innovations focus on enhancing image quality, reducing radiation dose, improving workflow efficiency, and integrating AI for improved diagnostic accuracy. Companies are increasingly integrating AI-powered tools into their mammography systems to assist radiologists in detecting subtle abnormalities and reducing false positives. The market is also witnessing the growing adoption of tomosynthesis, offering improved visualization of breast tissue compared to conventional 2D mammography. These technological advancements cater to the increasing demand for faster, more accurate, and patient-friendly mammography solutions.
Key Drivers of Mammography Industry Growth
Several factors are driving the growth of the mammography industry:
- Technological Advancements: The integration of AI and the development of 3D tomosynthesis are significantly improving diagnostic accuracy and efficiency.
- Rising Prevalence of Breast Cancer: The increasing incidence of breast cancer, particularly in developing countries, is fueling demand for early detection and screening.
- Government Initiatives: Government programs promoting preventive healthcare and early detection initiatives support the adoption of mammography services.
Challenges in the Mammography Industry Market
The mammography industry faces several challenges:
- Regulatory Hurdles: Stringent regulatory approvals and compliance requirements for medical devices increase development costs and time-to-market.
- High Initial Investment Costs: The cost of acquiring advanced mammography systems can be substantial, particularly for smaller clinics and diagnostic centers.
- Competition: Intense competition among established players, as well as emerging companies focusing on technological innovations, puts downward pressure on pricing.
Emerging Opportunities in Mammography Industry
The mammography market offers significant long-term growth opportunities:
- AI-powered Diagnostics: Continued development and wider adoption of AI-powered image analysis tools offer improved diagnostic accuracy, reduced workload for radiologists, and enhanced patient outcomes.
- Strategic Partnerships: Collaborations between mammography equipment manufacturers and AI software developers can accelerate innovation and market penetration.
- Market Expansion: Growing healthcare infrastructure and rising awareness in emerging markets present considerable opportunities for expansion.
Leading Players in the Mammography Industry Sector
- Konica Minolta Inc
- Metaltronica SpA
- Siemens Healthineers
- Hologic Inc
- GE Healthcare
- Carestream Health
- Koninklijke Philips NV
- General Medical Merate SpA
- Planmed Oy
- Fujifilm Holdings Corporation
- Canon Medical Systems
Key Milestones in Mammography Industry Industry
- May 2022: Volpara Health introduced updated products for its integrated platform for personalized breast care at the SBI/ACR Breast Imaging Symposium 2022, enhancing AI-driven breast software tools for mammography quality, reporting, density measurements, and cancer risk assessment.
- January 2022: ScreenPoint Medical expanded its presence globally with the launch of Transpara, an AI Breast Care system, increasing market competition and accessibility of AI solutions.
Strategic Outlook for Mammography Industry Market
The mammography market is poised for sustained growth, driven by technological innovations, increasing prevalence of breast cancer, and expanding healthcare infrastructure globally. Strategic opportunities exist for companies to focus on developing and integrating AI solutions, expanding into emerging markets, and forging strategic partnerships to gain a competitive edge. The focus on patient-centric solutions, reduced radiation exposure, and improved diagnostic accuracy will shape future market trends.
Mammography Industry Segmentation
-
1. Product Type
- 1.1. Digital Systems
- 1.2. Analog Systems
- 1.3. Breast Tomosynthesis
- 1.4. Other Product Types
-
2. End Users
- 2.1. Hospitals
- 2.2. Specialty Clinics
- 2.3. Diagnostic Centers
Mammography Industry Segmentation By Geography
-
1. North America
- 1.1. United States
- 1.2. Canada
- 1.3. Mexico
-
2. Europe
- 2.1. Germany
- 2.2. United Kingdom
- 2.3. France
- 2.4. Italy
- 2.5. Spain
- 2.6. Rest of Europe
-
3. Asia Pacific
- 3.1. China
- 3.2. Japan
- 3.3. India
- 3.4. Australia
- 3.5. South Korea
- 3.6. Rest of Asia Pacific
-
4. Middle East and Africa
- 4.1. GCC
- 4.2. South Africa
- 4.3. Rest of Middle East and Africa
-
5. South America
- 5.1. Brazil
- 5.2. Argentina
- 5.3. Rest of South America
Mammography Industry REPORT HIGHLIGHTS
| Aspects | Details |
|---|---|
| Study Period | 2019-2033 |
| Base Year | 2024 |
| Estimated Year | 2025 |
| Forecast Period | 2025-2033 |
| Historical Period | 2019-2024 |
| Growth Rate | CAGR of 9.20% from 2019-2033 |
| Segmentation |
|
Table of Contents
- 1. Introduction
- 1.1. Research Scope
- 1.2. Market Segmentation
- 1.3. Research Methodology
- 1.4. Definitions and Assumptions
- 2. Executive Summary
- 2.1. Introduction
- 3. Market Dynamics
- 3.1. Introduction
- 3.2. Market Drivers
- 3.2.1. Growing Burden of Breast Cancer; Technological Advancements in the Field of Breast Imaging; Investment from Various Organizations in Breast Cancer Screening Campaigns
- 3.3. Market Restrains
- 3.3.1. Risk of Adverse Effects from Radiation Exposure; Reduction in Reimbursement
- 3.4. Market Trends
- 3.4.1. The Digital Mammography Segment is Expected to Account for the Large Market Share During the Forecast Period
- 4. Market Factor Analysis
- 4.1. Porters Five Forces
- 4.2. Supply/Value Chain
- 4.3. PESTEL analysis
- 4.4. Market Entropy
- 4.5. Patent/Trademark Analysis
- 5. Global Mammography Industry Analysis, Insights and Forecast, 2019-2031
- 5.1. Market Analysis, Insights and Forecast - by Product Type
- 5.1.1. Digital Systems
- 5.1.2. Analog Systems
- 5.1.3. Breast Tomosynthesis
- 5.1.4. Other Product Types
- 5.2. Market Analysis, Insights and Forecast - by End Users
- 5.2.1. Hospitals
- 5.2.2. Specialty Clinics
- 5.2.3. Diagnostic Centers
- 5.3. Market Analysis, Insights and Forecast - by Region
- 5.3.1. North America
- 5.3.2. Europe
- 5.3.3. Asia Pacific
- 5.3.4. Middle East and Africa
- 5.3.5. South America
- 5.1. Market Analysis, Insights and Forecast - by Product Type
- 6. North America Mammography Industry Analysis, Insights and Forecast, 2019-2031
- 6.1. Market Analysis, Insights and Forecast - by Product Type
- 6.1.1. Digital Systems
- 6.1.2. Analog Systems
- 6.1.3. Breast Tomosynthesis
- 6.1.4. Other Product Types
- 6.2. Market Analysis, Insights and Forecast - by End Users
- 6.2.1. Hospitals
- 6.2.2. Specialty Clinics
- 6.2.3. Diagnostic Centers
- 6.1. Market Analysis, Insights and Forecast - by Product Type
- 7. Europe Mammography Industry Analysis, Insights and Forecast, 2019-2031
- 7.1. Market Analysis, Insights and Forecast - by Product Type
- 7.1.1. Digital Systems
- 7.1.2. Analog Systems
- 7.1.3. Breast Tomosynthesis
- 7.1.4. Other Product Types
- 7.2. Market Analysis, Insights and Forecast - by End Users
- 7.2.1. Hospitals
- 7.2.2. Specialty Clinics
- 7.2.3. Diagnostic Centers
- 7.1. Market Analysis, Insights and Forecast - by Product Type
- 8. Asia Pacific Mammography Industry Analysis, Insights and Forecast, 2019-2031
- 8.1. Market Analysis, Insights and Forecast - by Product Type
- 8.1.1. Digital Systems
- 8.1.2. Analog Systems
- 8.1.3. Breast Tomosynthesis
- 8.1.4. Other Product Types
- 8.2. Market Analysis, Insights and Forecast - by End Users
- 8.2.1. Hospitals
- 8.2.2. Specialty Clinics
- 8.2.3. Diagnostic Centers
- 8.1. Market Analysis, Insights and Forecast - by Product Type
- 9. Middle East and Africa Mammography Industry Analysis, Insights and Forecast, 2019-2031
- 9.1. Market Analysis, Insights and Forecast - by Product Type
- 9.1.1. Digital Systems
- 9.1.2. Analog Systems
- 9.1.3. Breast Tomosynthesis
- 9.1.4. Other Product Types
- 9.2. Market Analysis, Insights and Forecast - by End Users
- 9.2.1. Hospitals
- 9.2.2. Specialty Clinics
- 9.2.3. Diagnostic Centers
- 9.1. Market Analysis, Insights and Forecast - by Product Type
- 10. South America Mammography Industry Analysis, Insights and Forecast, 2019-2031
- 10.1. Market Analysis, Insights and Forecast - by Product Type
- 10.1.1. Digital Systems
- 10.1.2. Analog Systems
- 10.1.3. Breast Tomosynthesis
- 10.1.4. Other Product Types
- 10.2. Market Analysis, Insights and Forecast - by End Users
- 10.2.1. Hospitals
- 10.2.2. Specialty Clinics
- 10.2.3. Diagnostic Centers
- 10.1. Market Analysis, Insights and Forecast - by Product Type
- 11. North America Mammography Industry Analysis, Insights and Forecast, 2019-2031
- 11.1. Market Analysis, Insights and Forecast - By Country/Sub-region
- 11.1.1 United States
- 11.1.2 Canada
- 11.1.3 Mexico
- 12. Europe Mammography Industry Analysis, Insights and Forecast, 2019-2031
- 12.1. Market Analysis, Insights and Forecast - By Country/Sub-region
- 12.1.1 Germany
- 12.1.2 United Kingdom
- 12.1.3 France
- 12.1.4 Italy
- 12.1.5 Spain
- 12.1.6 Rest of Europe
- 13. Asia Pacific Mammography Industry Analysis, Insights and Forecast, 2019-2031
- 13.1. Market Analysis, Insights and Forecast - By Country/Sub-region
- 13.1.1 China
- 13.1.2 Japan
- 13.1.3 India
- 13.1.4 Australia
- 13.1.5 South Korea
- 13.1.6 Rest of Asia Pacific
- 14. Middle East and Africa Mammography Industry Analysis, Insights and Forecast, 2019-2031
- 14.1. Market Analysis, Insights and Forecast - By Country/Sub-region
- 14.1.1 GCC
- 14.1.2 South Africa
- 14.1.3 Rest of Middle East and Africa
- 15. South America Mammography Industry Analysis, Insights and Forecast, 2019-2031
- 15.1. Market Analysis, Insights and Forecast - By Country/Sub-region
- 15.1.1 Brazil
- 15.1.2 Argentina
- 15.1.3 Rest of South America
- 16. Competitive Analysis
- 16.1. Global Market Share Analysis 2024
- 16.2. Company Profiles
- 16.2.1 Konica Minolta Inc
- 16.2.1.1. Overview
- 16.2.1.2. Products
- 16.2.1.3. SWOT Analysis
- 16.2.1.4. Recent Developments
- 16.2.1.5. Financials (Based on Availability)
- 16.2.2 Metaltronica SpA
- 16.2.2.1. Overview
- 16.2.2.2. Products
- 16.2.2.3. SWOT Analysis
- 16.2.2.4. Recent Developments
- 16.2.2.5. Financials (Based on Availability)
- 16.2.3 Siemens Healthineers
- 16.2.3.1. Overview
- 16.2.3.2. Products
- 16.2.3.3. SWOT Analysis
- 16.2.3.4. Recent Developments
- 16.2.3.5. Financials (Based on Availability)
- 16.2.4 Hologic Inc
- 16.2.4.1. Overview
- 16.2.4.2. Products
- 16.2.4.3. SWOT Analysis
- 16.2.4.4. Recent Developments
- 16.2.4.5. Financials (Based on Availability)
- 16.2.5 GE Healthcare
- 16.2.5.1. Overview
- 16.2.5.2. Products
- 16.2.5.3. SWOT Analysis
- 16.2.5.4. Recent Developments
- 16.2.5.5. Financials (Based on Availability)
- 16.2.6 Carestream Health
- 16.2.6.1. Overview
- 16.2.6.2. Products
- 16.2.6.3. SWOT Analysis
- 16.2.6.4. Recent Developments
- 16.2.6.5. Financials (Based on Availability)
- 16.2.7 Koninklijke Philips NV
- 16.2.7.1. Overview
- 16.2.7.2. Products
- 16.2.7.3. SWOT Analysis
- 16.2.7.4. Recent Developments
- 16.2.7.5. Financials (Based on Availability)
- 16.2.8 General Medical Merate SpA
- 16.2.8.1. Overview
- 16.2.8.2. Products
- 16.2.8.3. SWOT Analysis
- 16.2.8.4. Recent Developments
- 16.2.8.5. Financials (Based on Availability)
- 16.2.9 Planmed Oy
- 16.2.9.1. Overview
- 16.2.9.2. Products
- 16.2.9.3. SWOT Analysis
- 16.2.9.4. Recent Developments
- 16.2.9.5. Financials (Based on Availability)
- 16.2.10 Fujifilm Holdings Corporation
- 16.2.10.1. Overview
- 16.2.10.2. Products
- 16.2.10.3. SWOT Analysis
- 16.2.10.4. Recent Developments
- 16.2.10.5. Financials (Based on Availability)
- 16.2.11 Canon Medical Systems
- 16.2.11.1. Overview
- 16.2.11.2. Products
- 16.2.11.3. SWOT Analysis
- 16.2.11.4. Recent Developments
- 16.2.11.5. Financials (Based on Availability)
- 16.2.1 Konica Minolta Inc
List of Figures
- Figure 1: Global Mammography Industry Revenue Breakdown (Million, %) by Region 2024 & 2032
- Figure 2: North America Mammography Industry Revenue (Million), by Country 2024 & 2032
- Figure 3: North America Mammography Industry Revenue Share (%), by Country 2024 & 2032
- Figure 4: Europe Mammography Industry Revenue (Million), by Country 2024 & 2032
- Figure 5: Europe Mammography Industry Revenue Share (%), by Country 2024 & 2032
- Figure 6: Asia Pacific Mammography Industry Revenue (Million), by Country 2024 & 2032
- Figure 7: Asia Pacific Mammography Industry Revenue Share (%), by Country 2024 & 2032
- Figure 8: Middle East and Africa Mammography Industry Revenue (Million), by Country 2024 & 2032
- Figure 9: Middle East and Africa Mammography Industry Revenue Share (%), by Country 2024 & 2032
- Figure 10: South America Mammography Industry Revenue (Million), by Country 2024 & 2032
- Figure 11: South America Mammography Industry Revenue Share (%), by Country 2024 & 2032
- Figure 12: North America Mammography Industry Revenue (Million), by Product Type 2024 & 2032
- Figure 13: North America Mammography Industry Revenue Share (%), by Product Type 2024 & 2032
- Figure 14: North America Mammography Industry Revenue (Million), by End Users 2024 & 2032
- Figure 15: North America Mammography Industry Revenue Share (%), by End Users 2024 & 2032
- Figure 16: North America Mammography Industry Revenue (Million), by Country 2024 & 2032
- Figure 17: North America Mammography Industry Revenue Share (%), by Country 2024 & 2032
- Figure 18: Europe Mammography Industry Revenue (Million), by Product Type 2024 & 2032
- Figure 19: Europe Mammography Industry Revenue Share (%), by Product Type 2024 & 2032
- Figure 20: Europe Mammography Industry Revenue (Million), by End Users 2024 & 2032
- Figure 21: Europe Mammography Industry Revenue Share (%), by End Users 2024 & 2032
- Figure 22: Europe Mammography Industry Revenue (Million), by Country 2024 & 2032
- Figure 23: Europe Mammography Industry Revenue Share (%), by Country 2024 & 2032
- Figure 24: Asia Pacific Mammography Industry Revenue (Million), by Product Type 2024 & 2032
- Figure 25: Asia Pacific Mammography Industry Revenue Share (%), by Product Type 2024 & 2032
- Figure 26: Asia Pacific Mammography Industry Revenue (Million), by End Users 2024 & 2032
- Figure 27: Asia Pacific Mammography Industry Revenue Share (%), by End Users 2024 & 2032
- Figure 28: Asia Pacific Mammography Industry Revenue (Million), by Country 2024 & 2032
- Figure 29: Asia Pacific Mammography Industry Revenue Share (%), by Country 2024 & 2032
- Figure 30: Middle East and Africa Mammography Industry Revenue (Million), by Product Type 2024 & 2032
- Figure 31: Middle East and Africa Mammography Industry Revenue Share (%), by Product Type 2024 & 2032
- Figure 32: Middle East and Africa Mammography Industry Revenue (Million), by End Users 2024 & 2032
- Figure 33: Middle East and Africa Mammography Industry Revenue Share (%), by End Users 2024 & 2032
- Figure 34: Middle East and Africa Mammography Industry Revenue (Million), by Country 2024 & 2032
- Figure 35: Middle East and Africa Mammography Industry Revenue Share (%), by Country 2024 & 2032
- Figure 36: South America Mammography Industry Revenue (Million), by Product Type 2024 & 2032
- Figure 37: South America Mammography Industry Revenue Share (%), by Product Type 2024 & 2032
- Figure 38: South America Mammography Industry Revenue (Million), by End Users 2024 & 2032
- Figure 39: South America Mammography Industry Revenue Share (%), by End Users 2024 & 2032
- Figure 40: South America Mammography Industry Revenue (Million), by Country 2024 & 2032
- Figure 41: South America Mammography Industry Revenue Share (%), by Country 2024 & 2032
List of Tables
- Table 1: Global Mammography Industry Revenue Million Forecast, by Region 2019 & 2032
- Table 2: Global Mammography Industry Revenue Million Forecast, by Product Type 2019 & 2032
- Table 3: Global Mammography Industry Revenue Million Forecast, by End Users 2019 & 2032
- Table 4: Global Mammography Industry Revenue Million Forecast, by Region 2019 & 2032
- Table 5: Global Mammography Industry Revenue Million Forecast, by Country 2019 & 2032
- Table 6: United States Mammography Industry Revenue (Million) Forecast, by Application 2019 & 2032
- Table 7: Canada Mammography Industry Revenue (Million) Forecast, by Application 2019 & 2032
- Table 8: Mexico Mammography Industry Revenue (Million) Forecast, by Application 2019 & 2032
- Table 9: Global Mammography Industry Revenue Million Forecast, by Country 2019 & 2032
- Table 10: Germany Mammography Industry Revenue (Million) Forecast, by Application 2019 & 2032
- Table 11: United Kingdom Mammography Industry Revenue (Million) Forecast, by Application 2019 & 2032
- Table 12: France Mammography Industry Revenue (Million) Forecast, by Application 2019 & 2032
- Table 13: Italy Mammography Industry Revenue (Million) Forecast, by Application 2019 & 2032
- Table 14: Spain Mammography Industry Revenue (Million) Forecast, by Application 2019 & 2032
- Table 15: Rest of Europe Mammography Industry Revenue (Million) Forecast, by Application 2019 & 2032
- Table 16: Global Mammography Industry Revenue Million Forecast, by Country 2019 & 2032
- Table 17: China Mammography Industry Revenue (Million) Forecast, by Application 2019 & 2032
- Table 18: Japan Mammography Industry Revenue (Million) Forecast, by Application 2019 & 2032
- Table 19: India Mammography Industry Revenue (Million) Forecast, by Application 2019 & 2032
- Table 20: Australia Mammography Industry Revenue (Million) Forecast, by Application 2019 & 2032
- Table 21: South Korea Mammography Industry Revenue (Million) Forecast, by Application 2019 & 2032
- Table 22: Rest of Asia Pacific Mammography Industry Revenue (Million) Forecast, by Application 2019 & 2032
- Table 23: Global Mammography Industry Revenue Million Forecast, by Country 2019 & 2032
- Table 24: GCC Mammography Industry Revenue (Million) Forecast, by Application 2019 & 2032
- Table 25: South Africa Mammography Industry Revenue (Million) Forecast, by Application 2019 & 2032
- Table 26: Rest of Middle East and Africa Mammography Industry Revenue (Million) Forecast, by Application 2019 & 2032
- Table 27: Global Mammography Industry Revenue Million Forecast, by Country 2019 & 2032
- Table 28: Brazil Mammography Industry Revenue (Million) Forecast, by Application 2019 & 2032
- Table 29: Argentina Mammography Industry Revenue (Million) Forecast, by Application 2019 & 2032
- Table 30: Rest of South America Mammography Industry Revenue (Million) Forecast, by Application 2019 & 2032
- Table 31: Global Mammography Industry Revenue Million Forecast, by Product Type 2019 & 2032
- Table 32: Global Mammography Industry Revenue Million Forecast, by End Users 2019 & 2032
- Table 33: Global Mammography Industry Revenue Million Forecast, by Country 2019 & 2032
- Table 34: United States Mammography Industry Revenue (Million) Forecast, by Application 2019 & 2032
- Table 35: Canada Mammography Industry Revenue (Million) Forecast, by Application 2019 & 2032
- Table 36: Mexico Mammography Industry Revenue (Million) Forecast, by Application 2019 & 2032
- Table 37: Global Mammography Industry Revenue Million Forecast, by Product Type 2019 & 2032
- Table 38: Global Mammography Industry Revenue Million Forecast, by End Users 2019 & 2032
- Table 39: Global Mammography Industry Revenue Million Forecast, by Country 2019 & 2032
- Table 40: Germany Mammography Industry Revenue (Million) Forecast, by Application 2019 & 2032
- Table 41: United Kingdom Mammography Industry Revenue (Million) Forecast, by Application 2019 & 2032
- Table 42: France Mammography Industry Revenue (Million) Forecast, by Application 2019 & 2032
- Table 43: Italy Mammography Industry Revenue (Million) Forecast, by Application 2019 & 2032
- Table 44: Spain Mammography Industry Revenue (Million) Forecast, by Application 2019 & 2032
- Table 45: Rest of Europe Mammography Industry Revenue (Million) Forecast, by Application 2019 & 2032
- Table 46: Global Mammography Industry Revenue Million Forecast, by Product Type 2019 & 2032
- Table 47: Global Mammography Industry Revenue Million Forecast, by End Users 2019 & 2032
- Table 48: Global Mammography Industry Revenue Million Forecast, by Country 2019 & 2032
- Table 49: China Mammography Industry Revenue (Million) Forecast, by Application 2019 & 2032
- Table 50: Japan Mammography Industry Revenue (Million) Forecast, by Application 2019 & 2032
- Table 51: India Mammography Industry Revenue (Million) Forecast, by Application 2019 & 2032
- Table 52: Australia Mammography Industry Revenue (Million) Forecast, by Application 2019 & 2032
- Table 53: South Korea Mammography Industry Revenue (Million) Forecast, by Application 2019 & 2032
- Table 54: Rest of Asia Pacific Mammography Industry Revenue (Million) Forecast, by Application 2019 & 2032
- Table 55: Global Mammography Industry Revenue Million Forecast, by Product Type 2019 & 2032
- Table 56: Global Mammography Industry Revenue Million Forecast, by End Users 2019 & 2032
- Table 57: Global Mammography Industry Revenue Million Forecast, by Country 2019 & 2032
- Table 58: GCC Mammography Industry Revenue (Million) Forecast, by Application 2019 & 2032
- Table 59: South Africa Mammography Industry Revenue (Million) Forecast, by Application 2019 & 2032
- Table 60: Rest of Middle East and Africa Mammography Industry Revenue (Million) Forecast, by Application 2019 & 2032
- Table 61: Global Mammography Industry Revenue Million Forecast, by Product Type 2019 & 2032
- Table 62: Global Mammography Industry Revenue Million Forecast, by End Users 2019 & 2032
- Table 63: Global Mammography Industry Revenue Million Forecast, by Country 2019 & 2032
- Table 64: Brazil Mammography Industry Revenue (Million) Forecast, by Application 2019 & 2032
- Table 65: Argentina Mammography Industry Revenue (Million) Forecast, by Application 2019 & 2032
- Table 66: Rest of South America Mammography Industry Revenue (Million) Forecast, by Application 2019 & 2032
Frequently Asked Questions
1. What is the projected Compound Annual Growth Rate (CAGR) of the Mammography Industry?
The projected CAGR is approximately 9.20%.
2. Which companies are prominent players in the Mammography Industry?
Key companies in the market include Konica Minolta Inc, Metaltronica SpA, Siemens Healthineers, Hologic Inc, GE Healthcare, Carestream Health, Koninklijke Philips NV, General Medical Merate SpA, Planmed Oy, Fujifilm Holdings Corporation, Canon Medical Systems.
3. What are the main segments of the Mammography Industry?
The market segments include Product Type, End Users.
4. Can you provide details about the market size?
The market size is estimated to be USD 2.49 Million as of 2022.
5. What are some drivers contributing to market growth?
Growing Burden of Breast Cancer; Technological Advancements in the Field of Breast Imaging; Investment from Various Organizations in Breast Cancer Screening Campaigns.
6. What are the notable trends driving market growth?
The Digital Mammography Segment is Expected to Account for the Large Market Share During the Forecast Period.
7. Are there any restraints impacting market growth?
Risk of Adverse Effects from Radiation Exposure; Reduction in Reimbursement.
8. Can you provide examples of recent developments in the market?
In May 2022, Volpara Health introduced updated products for its integrated platform for the delivery of personalized breast care at the SBI/ACR Breast Imaging Symposium 2022. Volpara's AI-driven breast software tools provide mammography quality and reporting, volumetric breast density measurements, and cancer risk assessment.
9. What pricing options are available for accessing the report?
Pricing options include single-user, multi-user, and enterprise licenses priced at USD 4750, USD 5250, and USD 8750 respectively.
10. Is the market size provided in terms of value or volume?
The market size is provided in terms of value, measured in Million.
11. Are there any specific market keywords associated with the report?
Yes, the market keyword associated with the report is "Mammography Industry," which aids in identifying and referencing the specific market segment covered.
12. How do I determine which pricing option suits my needs best?
The pricing options vary based on user requirements and access needs. Individual users may opt for single-user licenses, while businesses requiring broader access may choose multi-user or enterprise licenses for cost-effective access to the report.
13. Are there any additional resources or data provided in the Mammography Industry report?
While the report offers comprehensive insights, it's advisable to review the specific contents or supplementary materials provided to ascertain if additional resources or data are available.
14. How can I stay updated on further developments or reports in the Mammography Industry?
To stay informed about further developments, trends, and reports in the Mammography Industry, consider subscribing to industry newsletters, following relevant companies and organizations, or regularly checking reputable industry news sources and publications.
Methodology
Step 1 - Identification of Relevant Samples Size from Population Database


Step 2 - Approaches for Defining Global Market Size (Value, Volume* & Price*)

Note*: In applicable scenarios
Step 3 - Data Sources
Primary Research
- Web Analytics
- Survey Reports
- Research Institute
- Latest Research Reports
- Opinion Leaders
Secondary Research
- Annual Reports
- White Paper
- Latest Press Release
- Industry Association
- Paid Database
- Investor Presentations

Step 4 - Data Triangulation
Involves using different sources of information in order to increase the validity of a study
These sources are likely to be stakeholders in a program - participants, other researchers, program staff, other community members, and so on.
Then we put all data in single framework & apply various statistical tools to find out the dynamic on the market.
During the analysis stage, feedback from the stakeholder groups would be compared to determine areas of agreement as well as areas of divergence
