

Key Insights
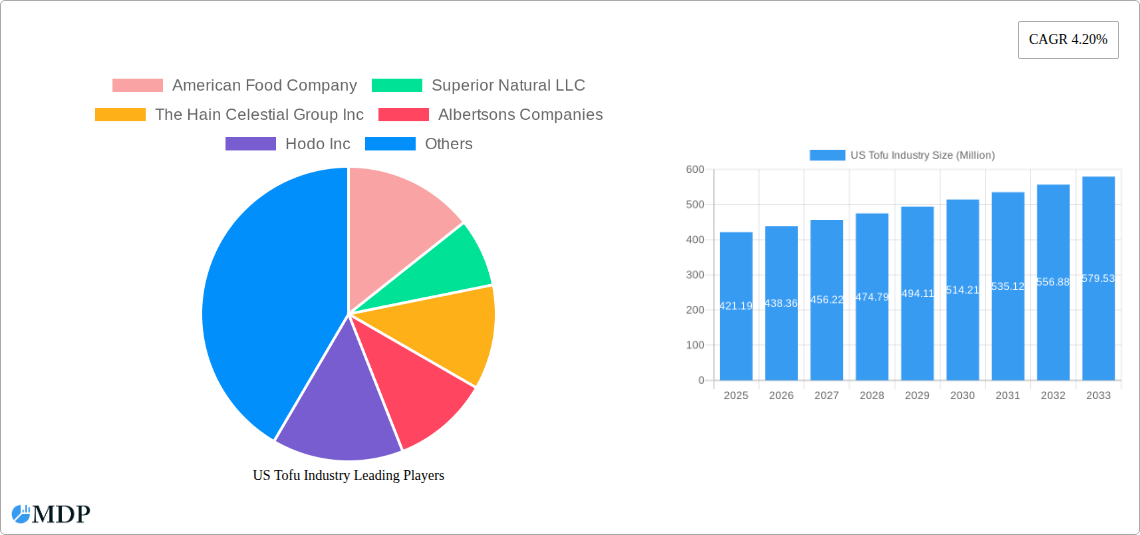
The US tofu market, valued at $421.19 million in 2025, is projected to experience steady growth, driven by increasing consumer demand for plant-based protein sources and a rising awareness of the health benefits associated with tofu. This aligns with broader trends towards vegetarianism, veganism, and flexitarianism, particularly among younger demographics. The market is segmented into on-trade (food service) and off-trade (retail) distribution channels, with both sectors contributing significantly to overall market expansion. Key players like American Food Company, Superior Natural LLC, and The Hain Celestial Group Inc. are actively shaping the market landscape through product innovation, strategic partnerships, and expansion into new retail channels. Growth is further fueled by the increasing availability of diverse tofu products, including organic, flavored, and ready-to-eat options, catering to evolving consumer preferences. While challenges such as fluctuating soybean prices and potential competition from alternative plant-based proteins exist, the long-term outlook for the US tofu market remains positive.
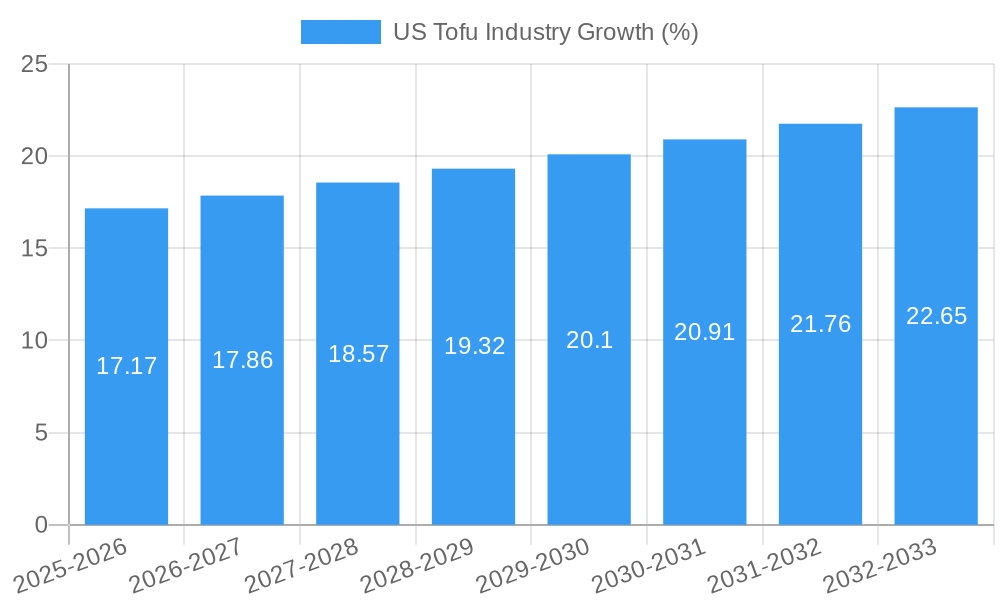
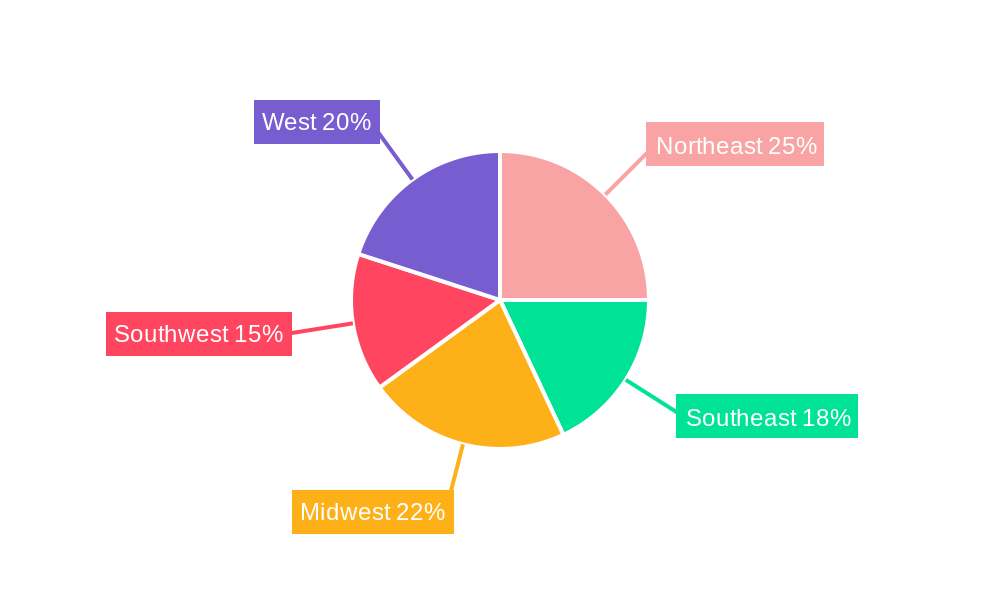
The projected Compound Annual Growth Rate (CAGR) of 4.20% from 2025 to 2033 indicates a consistent upward trajectory. Regional variations in market performance are expected, with regions like the West and Northeast potentially showing stronger growth due to higher concentrations of health-conscious consumers and a greater adoption of plant-based diets. The market's success will depend on continuous innovation in product development, effective marketing strategies that highlight the versatility and nutritional benefits of tofu, and proactive responses to shifts in consumer preferences and broader economic factors. Expansion into new product formats, such as tofu-based meat alternatives, and increased penetration into mainstream grocery stores and food service establishments are key factors driving further market expansion.
US Tofu Industry Report: A Comprehensive Market Analysis (2019-2033)
Uncover the lucrative opportunities and challenges shaping the future of the US Tofu market with this comprehensive report. This in-depth analysis provides a detailed overview of the US Tofu industry, covering market dynamics, key players, emerging trends, and future growth prospects. The report is essential for industry stakeholders, investors, and anyone seeking to understand this rapidly evolving sector. Projected to reach xx Million by 2033, the US Tofu market presents significant potential for growth and innovation.
US Tofu Industry Market Dynamics & Concentration
This section delves into the competitive landscape of the US Tofu industry, analyzing market concentration, innovation drivers, regulatory frameworks, product substitutes, end-user trends, and mergers & acquisitions (M&A) activities from 2019 to 2024. The market is characterized by a mix of large multinational corporations and smaller, specialized producers.
- Market Concentration: The market exhibits moderate concentration, with the top 5 players holding an estimated xx% market share in 2024. This share is projected to slightly increase to xx% by 2033 due to continued M&A activity and brand consolidation.
- Innovation Drivers: Consumer demand for healthier, plant-based protein sources, coupled with the increasing popularity of vegan and vegetarian diets, is a significant driver of innovation in tofu production and product diversification (e.g., flavored tofus, organic options).
- Regulatory Framework: The FDA's regulations concerning food safety and labeling significantly influence the industry, impacting production standards and consumer perception. Changes in labeling requirements can impact smaller producers disproportionately.
- Product Substitutes: Other plant-based protein sources such as tempeh, seitan, and meat alternatives compete with tofu, influencing market share and driving product differentiation.
- End-User Trends: The increasing adoption of flexitarian diets (reducing meat consumption but not eliminating it entirely) is boosting tofu demand. This demographic shift represents a significant opportunity for growth.
- M&A Activities: The period 2019-2024 witnessed xx M&A deals, primarily driven by larger players aiming to expand their market share and product portfolios. This trend is expected to continue, leading to further consolidation within the industry. The acquisition of Tofurky by Morinaga in 2023 exemplifies this trend.
US Tofu Industry Industry Trends & Analysis
This section provides a comprehensive analysis of the US Tofu industry's growth trajectory from 2019 to 2033, encompassing market growth drivers, technological disruptions, consumer preferences, and competitive dynamics.
The US Tofu market experienced a Compound Annual Growth Rate (CAGR) of xx% during the historical period (2019-2024) and is projected to maintain a CAGR of xx% during the forecast period (2025-2033). Key growth drivers include the rising popularity of plant-based diets, increasing consumer awareness of health and wellness, and the development of innovative tofu-based products. Technological advancements in production processes have improved efficiency and reduced costs, while technological disruptions such as alternative protein sources are increasing competitive pressures. Consumer preference for organic, non-GMO, and sustainably sourced tofu is also influencing market growth. Market penetration for tofu within the plant-based protein segment is projected to reach xx% by 2033.
Leading Markets & Segments in US Tofu Industry
This section highlights the dominant segments and regions within the US Tofu market. The analysis focuses on the “Others: On-Trade” and “Distribution Channel: Off-Trade” segments.
- Off-Trade (Retail): This segment dominates the US Tofu market due to the widespread availability of tofu in supermarkets, grocery stores, and online retailers. Key drivers include:
- Extensive retail distribution networks.
- Growing consumer preference for convenient, readily available food options.
- Increased shelf space dedicated to plant-based proteins in supermarkets.
- On-Trade (Food Service): While smaller than Off-Trade, the On-Trade segment is experiencing growth due to increasing adoption of tofu in restaurants, cafes, and other food service establishments. Key drivers include:
- The rising popularity of vegan and vegetarian menus in restaurants.
- Growing demand for plant-based protein options in the food service industry.
- Increased innovation in tofu-based menu items.
The detailed dominance analysis emphasizes the strong influence of retail channels due to increased accessibility and consumer purchasing patterns.
US Tofu Industry Product Developments
Recent years have witnessed significant innovation in tofu products, driven by consumer demand for variety, convenience, and health benefits. New product launches include flavored tofus, organic options, and ready-to-eat tofu-based meals. Technological advancements, such as improved processing techniques, have enhanced tofu's texture, taste, and nutritional value. This has expanded market applications, enabling tofu's integration into diverse culinary preparations, from traditional Asian dishes to Western-style meals and desserts. These developments have created competitive advantages for companies offering differentiated and high-quality products.
Key Drivers of US Tofu Industry Growth
The US Tofu industry's growth is fueled by several key factors. The increasing adoption of plant-based diets is a primary driver, with consumers seeking healthier, sustainable protein alternatives. Government initiatives promoting plant-based food consumption and the development of innovative products contribute to market expansion. Furthermore, technological advancements are reducing production costs and improving product quality.
Challenges in the US Tofu Industry Market
Despite the positive growth outlook, the US Tofu market faces certain challenges. Competition from other plant-based protein sources creates pressure on pricing and market share. Supply chain disruptions can affect production and distribution, while fluctuating commodity prices impact profitability. Additionally, regulatory changes and evolving consumer preferences require continuous adaptation.
Emerging Opportunities in US Tofu Industry
The US Tofu market presents several promising opportunities for future growth. Technological advancements in cultivation and processing, coupled with the growing adoption of alternative protein technologies, pave the way for more sustainable and efficient production. Strategic partnerships between established food companies and innovative start-ups can foster further market expansion and product diversification. Exploring new market segments and expanding into international markets presents further potential for growth.
Leading Players in the US Tofu Industry Sector
- American Food Company
- Superior Natural LLC
- The Hain Celestial Group Inc
- Albertsons Companies
- Hodo Inc
- Pulmuone Corporate
- House Foods Group Inc
- Morinaga Milk Industry Co Ltd
Key Milestones in US Tofu Industry Industry
- June 2022: Morinaga Nutritional Foods launched Mori-Nu Yuzu Flavored Silken Tofu.
- February 2023: Morinaga Nutritional Foods acquired Tofurky and Moocho.
- March 2023: Hodo launched Miso Tofu and Indian Spiced Tofu.
Strategic Outlook for US Tofu Industry Market
The US Tofu market is poised for sustained growth, driven by increasing consumer demand for plant-based proteins and the continuous innovation in product development. Strategic partnerships, investments in sustainable production practices, and expansion into new market segments will be crucial for companies seeking to capitalize on this growth potential. The focus on health, sustainability and product innovation will be key to securing a strong market position within the evolving plant-based food landscape.
US Tofu Industry Segmentation
-
1. Distribution Channel
-
1.1. Off-Trade
- 1.1.1. Convenience Stores
- 1.1.2. Online Channel
- 1.1.3. Supermarkets and Hypermarkets
- 1.1.4. Others
- 1.2. On-Trade
-
1.1. Off-Trade
US Tofu Industry Segmentation By Geography
-
1. North America
- 1.1. United States
- 1.2. Canada
- 1.3. Mexico
-
2. South America
- 2.1. Brazil
- 2.2. Argentina
- 2.3. Rest of South America
-
3. Europe
- 3.1. United Kingdom
- 3.2. Germany
- 3.3. France
- 3.4. Italy
- 3.5. Spain
- 3.6. Russia
- 3.7. Benelux
- 3.8. Nordics
- 3.9. Rest of Europe
-
4. Middle East & Africa
- 4.1. Turkey
- 4.2. Israel
- 4.3. GCC
- 4.4. North Africa
- 4.5. South Africa
- 4.6. Rest of Middle East & Africa
-
5. Asia Pacific
- 5.1. China
- 5.2. India
- 5.3. Japan
- 5.4. South Korea
- 5.5. ASEAN
- 5.6. Oceania
- 5.7. Rest of Asia Pacific
US Tofu Industry REPORT HIGHLIGHTS
| Aspects | Details |
|---|---|
| Study Period | 2019-2033 |
| Base Year | 2024 |
| Estimated Year | 2025 |
| Forecast Period | 2025-2033 |
| Historical Period | 2019-2024 |
| Growth Rate | CAGR of 4.20% from 2019-2033 |
| Segmentation |
|
Table of Contents
- 1. Introduction
- 1.1. Research Scope
- 1.2. Market Segmentation
- 1.3. Research Methodology
- 1.4. Definitions and Assumptions
- 2. Executive Summary
- 2.1. Introduction
- 3. Market Dynamics
- 3.1. Introduction
- 3.2. Market Drivers
- 3.2.1. Escalating Demand for Processed Poultry Products; Favorable Government Initiatives to Boost Production
- 3.3. Market Restrains
- 3.3.1. Rising Vegan Trend among Young Consumers; Deeper Penetration of Red Meat Across Saudi Arabia
- 3.4. Market Trends
- 3.4.1. Increasing demand for new variants in the tofu market through the expanded e-commerce channels drives the market
- 4. Market Factor Analysis
- 4.1. Porters Five Forces
- 4.2. Supply/Value Chain
- 4.3. PESTEL analysis
- 4.4. Market Entropy
- 4.5. Patent/Trademark Analysis
- 5. Global US Tofu Industry Analysis, Insights and Forecast, 2019-2031
- 5.1. Market Analysis, Insights and Forecast - by Distribution Channel
- 5.1.1. Off-Trade
- 5.1.1.1. Convenience Stores
- 5.1.1.2. Online Channel
- 5.1.1.3. Supermarkets and Hypermarkets
- 5.1.1.4. Others
- 5.1.2. On-Trade
- 5.1.1. Off-Trade
- 5.2. Market Analysis, Insights and Forecast - by Region
- 5.2.1. North America
- 5.2.2. South America
- 5.2.3. Europe
- 5.2.4. Middle East & Africa
- 5.2.5. Asia Pacific
- 5.1. Market Analysis, Insights and Forecast - by Distribution Channel
- 6. North America US Tofu Industry Analysis, Insights and Forecast, 2019-2031
- 6.1. Market Analysis, Insights and Forecast - by Distribution Channel
- 6.1.1. Off-Trade
- 6.1.1.1. Convenience Stores
- 6.1.1.2. Online Channel
- 6.1.1.3. Supermarkets and Hypermarkets
- 6.1.1.4. Others
- 6.1.2. On-Trade
- 6.1.1. Off-Trade
- 6.1. Market Analysis, Insights and Forecast - by Distribution Channel
- 7. South America US Tofu Industry Analysis, Insights and Forecast, 2019-2031
- 7.1. Market Analysis, Insights and Forecast - by Distribution Channel
- 7.1.1. Off-Trade
- 7.1.1.1. Convenience Stores
- 7.1.1.2. Online Channel
- 7.1.1.3. Supermarkets and Hypermarkets
- 7.1.1.4. Others
- 7.1.2. On-Trade
- 7.1.1. Off-Trade
- 7.1. Market Analysis, Insights and Forecast - by Distribution Channel
- 8. Europe US Tofu Industry Analysis, Insights and Forecast, 2019-2031
- 8.1. Market Analysis, Insights and Forecast - by Distribution Channel
- 8.1.1. Off-Trade
- 8.1.1.1. Convenience Stores
- 8.1.1.2. Online Channel
- 8.1.1.3. Supermarkets and Hypermarkets
- 8.1.1.4. Others
- 8.1.2. On-Trade
- 8.1.1. Off-Trade
- 8.1. Market Analysis, Insights and Forecast - by Distribution Channel
- 9. Middle East & Africa US Tofu Industry Analysis, Insights and Forecast, 2019-2031
- 9.1. Market Analysis, Insights and Forecast - by Distribution Channel
- 9.1.1. Off-Trade
- 9.1.1.1. Convenience Stores
- 9.1.1.2. Online Channel
- 9.1.1.3. Supermarkets and Hypermarkets
- 9.1.1.4. Others
- 9.1.2. On-Trade
- 9.1.1. Off-Trade
- 9.1. Market Analysis, Insights and Forecast - by Distribution Channel
- 10. Asia Pacific US Tofu Industry Analysis, Insights and Forecast, 2019-2031
- 10.1. Market Analysis, Insights and Forecast - by Distribution Channel
- 10.1.1. Off-Trade
- 10.1.1.1. Convenience Stores
- 10.1.1.2. Online Channel
- 10.1.1.3. Supermarkets and Hypermarkets
- 10.1.1.4. Others
- 10.1.2. On-Trade
- 10.1.1. Off-Trade
- 10.1. Market Analysis, Insights and Forecast - by Distribution Channel
- 11. Northeast US Tofu Industry Analysis, Insights and Forecast, 2019-2031
- 12. Southeast US Tofu Industry Analysis, Insights and Forecast, 2019-2031
- 13. Midwest US Tofu Industry Analysis, Insights and Forecast, 2019-2031
- 14. Southwest US Tofu Industry Analysis, Insights and Forecast, 2019-2031
- 15. West US Tofu Industry Analysis, Insights and Forecast, 2019-2031
- 16. Competitive Analysis
- 16.1. Global Market Share Analysis 2024
- 16.2. Company Profiles
- 16.2.1 American Food Company
- 16.2.1.1. Overview
- 16.2.1.2. Products
- 16.2.1.3. SWOT Analysis
- 16.2.1.4. Recent Developments
- 16.2.1.5. Financials (Based on Availability)
- 16.2.2 Superior Natural LLC
- 16.2.2.1. Overview
- 16.2.2.2. Products
- 16.2.2.3. SWOT Analysis
- 16.2.2.4. Recent Developments
- 16.2.2.5. Financials (Based on Availability)
- 16.2.3 The Hain Celestial Group Inc
- 16.2.3.1. Overview
- 16.2.3.2. Products
- 16.2.3.3. SWOT Analysis
- 16.2.3.4. Recent Developments
- 16.2.3.5. Financials (Based on Availability)
- 16.2.4 Albertsons Companies
- 16.2.4.1. Overview
- 16.2.4.2. Products
- 16.2.4.3. SWOT Analysis
- 16.2.4.4. Recent Developments
- 16.2.4.5. Financials (Based on Availability)
- 16.2.5 Hodo Inc
- 16.2.5.1. Overview
- 16.2.5.2. Products
- 16.2.5.3. SWOT Analysis
- 16.2.5.4. Recent Developments
- 16.2.5.5. Financials (Based on Availability)
- 16.2.6 Pulmuone Corporate
- 16.2.6.1. Overview
- 16.2.6.2. Products
- 16.2.6.3. SWOT Analysis
- 16.2.6.4. Recent Developments
- 16.2.6.5. Financials (Based on Availability)
- 16.2.7 House Foods Group Inc
- 16.2.7.1. Overview
- 16.2.7.2. Products
- 16.2.7.3. SWOT Analysis
- 16.2.7.4. Recent Developments
- 16.2.7.5. Financials (Based on Availability)
- 16.2.8 Morinaga Milk Industry Co Ltd
- 16.2.8.1. Overview
- 16.2.8.2. Products
- 16.2.8.3. SWOT Analysis
- 16.2.8.4. Recent Developments
- 16.2.8.5. Financials (Based on Availability)
- 16.2.1 American Food Company
List of Figures
- Figure 1: Global US Tofu Industry Revenue Breakdown (Million, %) by Region 2024 & 2032
- Figure 2: Global US Tofu Industry Volume Breakdown (K Tons, %) by Region 2024 & 2032
- Figure 3: United states US Tofu Industry Revenue (Million), by Country 2024 & 2032
- Figure 4: United states US Tofu Industry Volume (K Tons), by Country 2024 & 2032
- Figure 5: United states US Tofu Industry Revenue Share (%), by Country 2024 & 2032
- Figure 6: United states US Tofu Industry Volume Share (%), by Country 2024 & 2032
- Figure 7: North America US Tofu Industry Revenue (Million), by Distribution Channel 2024 & 2032
- Figure 8: North America US Tofu Industry Volume (K Tons), by Distribution Channel 2024 & 2032
- Figure 9: North America US Tofu Industry Revenue Share (%), by Distribution Channel 2024 & 2032
- Figure 10: North America US Tofu Industry Volume Share (%), by Distribution Channel 2024 & 2032
- Figure 11: North America US Tofu Industry Revenue (Million), by Country 2024 & 2032
- Figure 12: North America US Tofu Industry Volume (K Tons), by Country 2024 & 2032
- Figure 13: North America US Tofu Industry Revenue Share (%), by Country 2024 & 2032
- Figure 14: North America US Tofu Industry Volume Share (%), by Country 2024 & 2032
- Figure 15: South America US Tofu Industry Revenue (Million), by Distribution Channel 2024 & 2032
- Figure 16: South America US Tofu Industry Volume (K Tons), by Distribution Channel 2024 & 2032
- Figure 17: South America US Tofu Industry Revenue Share (%), by Distribution Channel 2024 & 2032
- Figure 18: South America US Tofu Industry Volume Share (%), by Distribution Channel 2024 & 2032
- Figure 19: South America US Tofu Industry Revenue (Million), by Country 2024 & 2032
- Figure 20: South America US Tofu Industry Volume (K Tons), by Country 2024 & 2032
- Figure 21: South America US Tofu Industry Revenue Share (%), by Country 2024 & 2032
- Figure 22: South America US Tofu Industry Volume Share (%), by Country 2024 & 2032
- Figure 23: Europe US Tofu Industry Revenue (Million), by Distribution Channel 2024 & 2032
- Figure 24: Europe US Tofu Industry Volume (K Tons), by Distribution Channel 2024 & 2032
- Figure 25: Europe US Tofu Industry Revenue Share (%), by Distribution Channel 2024 & 2032
- Figure 26: Europe US Tofu Industry Volume Share (%), by Distribution Channel 2024 & 2032
- Figure 27: Europe US Tofu Industry Revenue (Million), by Country 2024 & 2032
- Figure 28: Europe US Tofu Industry Volume (K Tons), by Country 2024 & 2032
- Figure 29: Europe US Tofu Industry Revenue Share (%), by Country 2024 & 2032
- Figure 30: Europe US Tofu Industry Volume Share (%), by Country 2024 & 2032
- Figure 31: Middle East & Africa US Tofu Industry Revenue (Million), by Distribution Channel 2024 & 2032
- Figure 32: Middle East & Africa US Tofu Industry Volume (K Tons), by Distribution Channel 2024 & 2032
- Figure 33: Middle East & Africa US Tofu Industry Revenue Share (%), by Distribution Channel 2024 & 2032
- Figure 34: Middle East & Africa US Tofu Industry Volume Share (%), by Distribution Channel 2024 & 2032
- Figure 35: Middle East & Africa US Tofu Industry Revenue (Million), by Country 2024 & 2032
- Figure 36: Middle East & Africa US Tofu Industry Volume (K Tons), by Country 2024 & 2032
- Figure 37: Middle East & Africa US Tofu Industry Revenue Share (%), by Country 2024 & 2032
- Figure 38: Middle East & Africa US Tofu Industry Volume Share (%), by Country 2024 & 2032
- Figure 39: Asia Pacific US Tofu Industry Revenue (Million), by Distribution Channel 2024 & 2032
- Figure 40: Asia Pacific US Tofu Industry Volume (K Tons), by Distribution Channel 2024 & 2032
- Figure 41: Asia Pacific US Tofu Industry Revenue Share (%), by Distribution Channel 2024 & 2032
- Figure 42: Asia Pacific US Tofu Industry Volume Share (%), by Distribution Channel 2024 & 2032
- Figure 43: Asia Pacific US Tofu Industry Revenue (Million), by Country 2024 & 2032
- Figure 44: Asia Pacific US Tofu Industry Volume (K Tons), by Country 2024 & 2032
- Figure 45: Asia Pacific US Tofu Industry Revenue Share (%), by Country 2024 & 2032
- Figure 46: Asia Pacific US Tofu Industry Volume Share (%), by Country 2024 & 2032
List of Tables
- Table 1: Global US Tofu Industry Revenue Million Forecast, by Region 2019 & 2032
- Table 2: Global US Tofu Industry Volume K Tons Forecast, by Region 2019 & 2032
- Table 3: Global US Tofu Industry Revenue Million Forecast, by Distribution Channel 2019 & 2032
- Table 4: Global US Tofu Industry Volume K Tons Forecast, by Distribution Channel 2019 & 2032
- Table 5: Global US Tofu Industry Revenue Million Forecast, by Region 2019 & 2032
- Table 6: Global US Tofu Industry Volume K Tons Forecast, by Region 2019 & 2032
- Table 7: Global US Tofu Industry Revenue Million Forecast, by Country 2019 & 2032
- Table 8: Global US Tofu Industry Volume K Tons Forecast, by Country 2019 & 2032
- Table 9: Northeast US Tofu Industry Revenue (Million) Forecast, by Application 2019 & 2032
- Table 10: Northeast US Tofu Industry Volume (K Tons) Forecast, by Application 2019 & 2032
- Table 11: Southeast US Tofu Industry Revenue (Million) Forecast, by Application 2019 & 2032
- Table 12: Southeast US Tofu Industry Volume (K Tons) Forecast, by Application 2019 & 2032
- Table 13: Midwest US Tofu Industry Revenue (Million) Forecast, by Application 2019 & 2032
- Table 14: Midwest US Tofu Industry Volume (K Tons) Forecast, by Application 2019 & 2032
- Table 15: Southwest US Tofu Industry Revenue (Million) Forecast, by Application 2019 & 2032
- Table 16: Southwest US Tofu Industry Volume (K Tons) Forecast, by Application 2019 & 2032
- Table 17: West US Tofu Industry Revenue (Million) Forecast, by Application 2019 & 2032
- Table 18: West US Tofu Industry Volume (K Tons) Forecast, by Application 2019 & 2032
- Table 19: Global US Tofu Industry Revenue Million Forecast, by Distribution Channel 2019 & 2032
- Table 20: Global US Tofu Industry Volume K Tons Forecast, by Distribution Channel 2019 & 2032
- Table 21: Global US Tofu Industry Revenue Million Forecast, by Country 2019 & 2032
- Table 22: Global US Tofu Industry Volume K Tons Forecast, by Country 2019 & 2032
- Table 23: United States US Tofu Industry Revenue (Million) Forecast, by Application 2019 & 2032
- Table 24: United States US Tofu Industry Volume (K Tons) Forecast, by Application 2019 & 2032
- Table 25: Canada US Tofu Industry Revenue (Million) Forecast, by Application 2019 & 2032
- Table 26: Canada US Tofu Industry Volume (K Tons) Forecast, by Application 2019 & 2032
- Table 27: Mexico US Tofu Industry Revenue (Million) Forecast, by Application 2019 & 2032
- Table 28: Mexico US Tofu Industry Volume (K Tons) Forecast, by Application 2019 & 2032
- Table 29: Global US Tofu Industry Revenue Million Forecast, by Distribution Channel 2019 & 2032
- Table 30: Global US Tofu Industry Volume K Tons Forecast, by Distribution Channel 2019 & 2032
- Table 31: Global US Tofu Industry Revenue Million Forecast, by Country 2019 & 2032
- Table 32: Global US Tofu Industry Volume K Tons Forecast, by Country 2019 & 2032
- Table 33: Brazil US Tofu Industry Revenue (Million) Forecast, by Application 2019 & 2032
- Table 34: Brazil US Tofu Industry Volume (K Tons) Forecast, by Application 2019 & 2032
- Table 35: Argentina US Tofu Industry Revenue (Million) Forecast, by Application 2019 & 2032
- Table 36: Argentina US Tofu Industry Volume (K Tons) Forecast, by Application 2019 & 2032
- Table 37: Rest of South America US Tofu Industry Revenue (Million) Forecast, by Application 2019 & 2032
- Table 38: Rest of South America US Tofu Industry Volume (K Tons) Forecast, by Application 2019 & 2032
- Table 39: Global US Tofu Industry Revenue Million Forecast, by Distribution Channel 2019 & 2032
- Table 40: Global US Tofu Industry Volume K Tons Forecast, by Distribution Channel 2019 & 2032
- Table 41: Global US Tofu Industry Revenue Million Forecast, by Country 2019 & 2032
- Table 42: Global US Tofu Industry Volume K Tons Forecast, by Country 2019 & 2032
- Table 43: United Kingdom US Tofu Industry Revenue (Million) Forecast, by Application 2019 & 2032
- Table 44: United Kingdom US Tofu Industry Volume (K Tons) Forecast, by Application 2019 & 2032
- Table 45: Germany US Tofu Industry Revenue (Million) Forecast, by Application 2019 & 2032
- Table 46: Germany US Tofu Industry Volume (K Tons) Forecast, by Application 2019 & 2032
- Table 47: France US Tofu Industry Revenue (Million) Forecast, by Application 2019 & 2032
- Table 48: France US Tofu Industry Volume (K Tons) Forecast, by Application 2019 & 2032
- Table 49: Italy US Tofu Industry Revenue (Million) Forecast, by Application 2019 & 2032
- Table 50: Italy US Tofu Industry Volume (K Tons) Forecast, by Application 2019 & 2032
- Table 51: Spain US Tofu Industry Revenue (Million) Forecast, by Application 2019 & 2032
- Table 52: Spain US Tofu Industry Volume (K Tons) Forecast, by Application 2019 & 2032
- Table 53: Russia US Tofu Industry Revenue (Million) Forecast, by Application 2019 & 2032
- Table 54: Russia US Tofu Industry Volume (K Tons) Forecast, by Application 2019 & 2032
- Table 55: Benelux US Tofu Industry Revenue (Million) Forecast, by Application 2019 & 2032
- Table 56: Benelux US Tofu Industry Volume (K Tons) Forecast, by Application 2019 & 2032
- Table 57: Nordics US Tofu Industry Revenue (Million) Forecast, by Application 2019 & 2032
- Table 58: Nordics US Tofu Industry Volume (K Tons) Forecast, by Application 2019 & 2032
- Table 59: Rest of Europe US Tofu Industry Revenue (Million) Forecast, by Application 2019 & 2032
- Table 60: Rest of Europe US Tofu Industry Volume (K Tons) Forecast, by Application 2019 & 2032
- Table 61: Global US Tofu Industry Revenue Million Forecast, by Distribution Channel 2019 & 2032
- Table 62: Global US Tofu Industry Volume K Tons Forecast, by Distribution Channel 2019 & 2032
- Table 63: Global US Tofu Industry Revenue Million Forecast, by Country 2019 & 2032
- Table 64: Global US Tofu Industry Volume K Tons Forecast, by Country 2019 & 2032
- Table 65: Turkey US Tofu Industry Revenue (Million) Forecast, by Application 2019 & 2032
- Table 66: Turkey US Tofu Industry Volume (K Tons) Forecast, by Application 2019 & 2032
- Table 67: Israel US Tofu Industry Revenue (Million) Forecast, by Application 2019 & 2032
- Table 68: Israel US Tofu Industry Volume (K Tons) Forecast, by Application 2019 & 2032
- Table 69: GCC US Tofu Industry Revenue (Million) Forecast, by Application 2019 & 2032
- Table 70: GCC US Tofu Industry Volume (K Tons) Forecast, by Application 2019 & 2032
- Table 71: North Africa US Tofu Industry Revenue (Million) Forecast, by Application 2019 & 2032
- Table 72: North Africa US Tofu Industry Volume (K Tons) Forecast, by Application 2019 & 2032
- Table 73: South Africa US Tofu Industry Revenue (Million) Forecast, by Application 2019 & 2032
- Table 74: South Africa US Tofu Industry Volume (K Tons) Forecast, by Application 2019 & 2032
- Table 75: Rest of Middle East & Africa US Tofu Industry Revenue (Million) Forecast, by Application 2019 & 2032
- Table 76: Rest of Middle East & Africa US Tofu Industry Volume (K Tons) Forecast, by Application 2019 & 2032
- Table 77: Global US Tofu Industry Revenue Million Forecast, by Distribution Channel 2019 & 2032
- Table 78: Global US Tofu Industry Volume K Tons Forecast, by Distribution Channel 2019 & 2032
- Table 79: Global US Tofu Industry Revenue Million Forecast, by Country 2019 & 2032
- Table 80: Global US Tofu Industry Volume K Tons Forecast, by Country 2019 & 2032
- Table 81: China US Tofu Industry Revenue (Million) Forecast, by Application 2019 & 2032
- Table 82: China US Tofu Industry Volume (K Tons) Forecast, by Application 2019 & 2032
- Table 83: India US Tofu Industry Revenue (Million) Forecast, by Application 2019 & 2032
- Table 84: India US Tofu Industry Volume (K Tons) Forecast, by Application 2019 & 2032
- Table 85: Japan US Tofu Industry Revenue (Million) Forecast, by Application 2019 & 2032
- Table 86: Japan US Tofu Industry Volume (K Tons) Forecast, by Application 2019 & 2032
- Table 87: South Korea US Tofu Industry Revenue (Million) Forecast, by Application 2019 & 2032
- Table 88: South Korea US Tofu Industry Volume (K Tons) Forecast, by Application 2019 & 2032
- Table 89: ASEAN US Tofu Industry Revenue (Million) Forecast, by Application 2019 & 2032
- Table 90: ASEAN US Tofu Industry Volume (K Tons) Forecast, by Application 2019 & 2032
- Table 91: Oceania US Tofu Industry Revenue (Million) Forecast, by Application 2019 & 2032
- Table 92: Oceania US Tofu Industry Volume (K Tons) Forecast, by Application 2019 & 2032
- Table 93: Rest of Asia Pacific US Tofu Industry Revenue (Million) Forecast, by Application 2019 & 2032
- Table 94: Rest of Asia Pacific US Tofu Industry Volume (K Tons) Forecast, by Application 2019 & 2032
Frequently Asked Questions
1. What is the projected Compound Annual Growth Rate (CAGR) of the US Tofu Industry?
The projected CAGR is approximately 4.20%.
2. Which companies are prominent players in the US Tofu Industry?
Key companies in the market include American Food Company, Superior Natural LLC, The Hain Celestial Group Inc, Albertsons Companies, Hodo Inc, Pulmuone Corporate, House Foods Group Inc, Morinaga Milk Industry Co Ltd.
3. What are the main segments of the US Tofu Industry?
The market segments include Distribution Channel.
4. Can you provide details about the market size?
The market size is estimated to be USD 421.19 Million as of 2022.
5. What are some drivers contributing to market growth?
Escalating Demand for Processed Poultry Products; Favorable Government Initiatives to Boost Production.
6. What are the notable trends driving market growth?
Increasing demand for new variants in the tofu market through the expanded e-commerce channels drives the market.
7. Are there any restraints impacting market growth?
Rising Vegan Trend among Young Consumers; Deeper Penetration of Red Meat Across Saudi Arabia.
8. Can you provide examples of recent developments in the market?
March 2023: Hodo launched two new block tofus with vibrant global flavors which include Miso Tofu and Indian Spiced Tofu.February 2023: Morinaga Nutritional Foods acquired US plant-based company, Tofurky and its sister brand Moocho. Morinaga has been a tofu supplier for Tofurky products for 17 years. The acquisition of Tofurky and Moocho will help the company to strengthen the integrated supply chain and category growth for the brands.June 2022: Morinaga Nutritional Foods launched Mori-Nu Yuzu Flavored Silken Tofu, known for its velvety smooth texture. The product has a firm texture, is versatile, and can be added to desserts or blended for preparation.
9. What pricing options are available for accessing the report?
Pricing options include single-user, multi-user, and enterprise licenses priced at USD 3800, USD 4500, and USD 5800 respectively.
10. Is the market size provided in terms of value or volume?
The market size is provided in terms of value, measured in Million and volume, measured in K Tons.
11. Are there any specific market keywords associated with the report?
Yes, the market keyword associated with the report is "US Tofu Industry," which aids in identifying and referencing the specific market segment covered.
12. How do I determine which pricing option suits my needs best?
The pricing options vary based on user requirements and access needs. Individual users may opt for single-user licenses, while businesses requiring broader access may choose multi-user or enterprise licenses for cost-effective access to the report.
13. Are there any additional resources or data provided in the US Tofu Industry report?
While the report offers comprehensive insights, it's advisable to review the specific contents or supplementary materials provided to ascertain if additional resources or data are available.
14. How can I stay updated on further developments or reports in the US Tofu Industry?
To stay informed about further developments, trends, and reports in the US Tofu Industry, consider subscribing to industry newsletters, following relevant companies and organizations, or regularly checking reputable industry news sources and publications.
Methodology
Step 1 - Identification of Relevant Samples Size from Population Database


Step 2 - Approaches for Defining Global Market Size (Value, Volume* & Price*)

Note*: In applicable scenarios
Step 3 - Data Sources
Primary Research
- Web Analytics
- Survey Reports
- Research Institute
- Latest Research Reports
- Opinion Leaders
Secondary Research
- Annual Reports
- White Paper
- Latest Press Release
- Industry Association
- Paid Database
- Investor Presentations

Step 4 - Data Triangulation
Involves using different sources of information in order to increase the validity of a study
These sources are likely to be stakeholders in a program - participants, other researchers, program staff, other community members, and so on.
Then we put all data in single framework & apply various statistical tools to find out the dynamic on the market.
During the analysis stage, feedback from the stakeholder groups would be compared to determine areas of agreement as well as areas of divergence
