

Key Insights
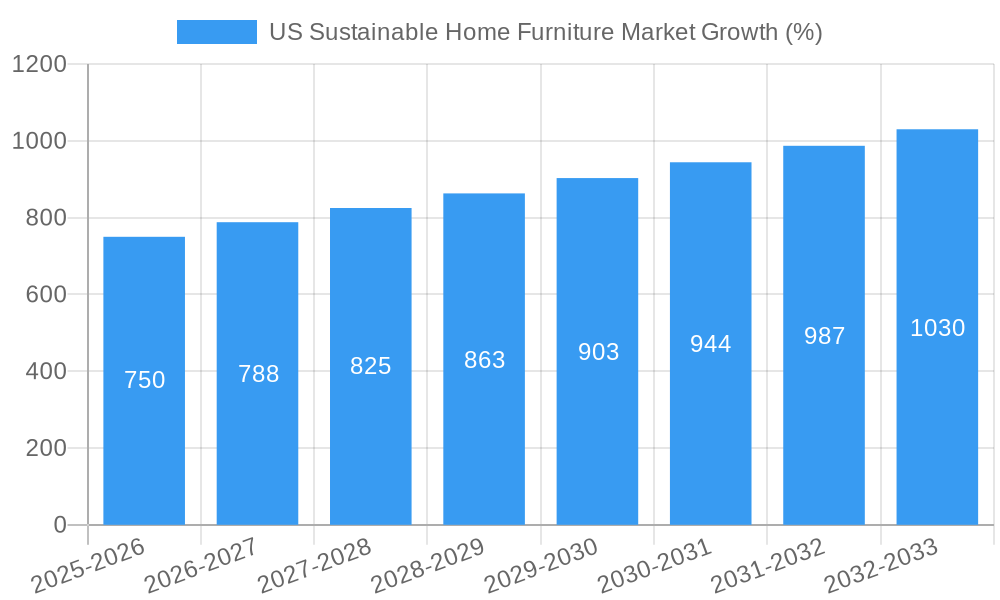
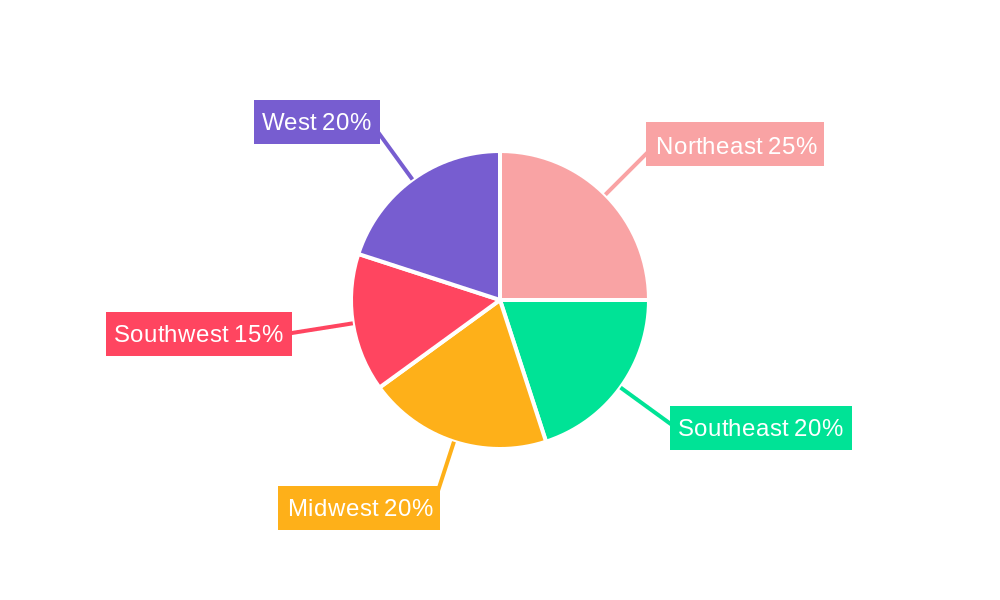
The US sustainable home furniture market is experiencing robust growth, fueled by increasing consumer awareness of environmental issues and a rising preference for eco-friendly products. The market's Compound Annual Growth Rate (CAGR) exceeding 5% since 2019 indicates a significant upward trajectory, projected to continue through 2033. Key drivers include heightened consumer demand for sustainable and ethically sourced materials like wood and bamboo, coupled with a growing preference for durable, long-lasting furniture. The online distribution channel is witnessing rapid expansion, driven by enhanced e-commerce platforms and the convenience of online shopping. However, challenges remain, including higher production costs associated with sustainable materials and the need for greater transparency and certification to build consumer trust. Segmentation reveals a strong demand for sustainable furniture across various applications, including home furniture (the largest segment), office furniture, and hospitality furniture. The market is witnessing innovation in materials, with PET and other recycled materials gaining traction, although wood remains dominant. Leading players, such as Inter IKEA Systems B.V., Williams-Sonoma Inc., and Wayfair Inc., are investing significantly in sustainable product lines and supply chains to capitalize on this growing market segment. Regional variations exist within the US market, with states in the Northeast and West potentially showing higher adoption rates due to greater environmental consciousness and higher disposable incomes.
The forecast period (2025-2033) anticipates continued market expansion, driven by advancements in sustainable material technology and increased government regulations promoting eco-friendly practices. The increasing adoption of circular economy models, focusing on reuse, repair, and recycling, will further shape the market. However, challenges pertaining to fluctuating raw material prices and potential supply chain disruptions need to be addressed. The successful players will be those who effectively balance sustainability goals with affordability and design, catering to a diverse range of consumer preferences and budgets. Competitive pricing strategies, coupled with transparent communication regarding sustainability practices, will become essential for market leadership.
US Sustainable Home Furniture Market: A Comprehensive Report (2019-2033)
This in-depth report provides a comprehensive analysis of the US Sustainable Home Furniture Market, offering invaluable insights for industry stakeholders, investors, and strategic decision-makers. We analyze market dynamics, industry trends, leading segments, and key players, projecting robust growth and highlighting lucrative opportunities within this rapidly evolving sector. The report covers the period 2019-2033, with a focus on the estimated year 2025. The market is expected to reach xx Million by 2033.
US Sustainable Home Furniture Market Market Dynamics & Concentration
The US sustainable home furniture market is experiencing significant growth driven by increasing consumer awareness of environmental issues and a rising demand for eco-friendly products. Market concentration is moderate, with several large players holding significant shares, but a growing number of smaller, specialized companies are also emerging. Innovation is a key driver, with companies investing in sustainable materials and manufacturing processes. Stringent environmental regulations are shaping the market, pushing for greater sustainability. Product substitutes, such as used furniture and alternative materials, pose a moderate challenge. End-user trends favor stylish and functional furniture with a low environmental impact. The market has seen a moderate level of M&A activity in recent years, with larger players acquiring smaller companies to expand their product portfolios and market reach.
- Market Share: The top 5 players account for approximately xx% of the market share.
- M&A Deal Counts: An average of xx M&A deals have been recorded annually in the past five years.
- Innovation Drivers: Development of recycled materials, eco-friendly manufacturing techniques, and sustainable supply chains.
- Regulatory Frameworks: Growing emphasis on sustainable sourcing, waste reduction, and carbon footprint reduction.
US Sustainable Home Furniture Market Industry Trends & Analysis
The US sustainable home furniture market is experiencing robust growth, projected at a CAGR of xx% during the forecast period (2025-2033). This growth is fueled by several key factors. Firstly, heightened consumer awareness of environmental concerns is driving demand for eco-friendly alternatives. Secondly, technological advancements in sustainable material development and manufacturing processes are continuously improving product quality and affordability. Thirdly, changing consumer preferences are emphasizing design and functionality alongside sustainability, leading to a broader appeal. Finally, increasing competitive pressure is pushing companies to innovate and offer more sustainable products. Market penetration of sustainable furniture is steadily increasing, projected to reach xx% by 2033.
Leading Markets & Segments in US Sustainable Home Furniture Market
The home furniture application segment dominates the US sustainable home furniture market, driven by a rising preference for eco-conscious home décor. The offline distribution channel currently holds a larger market share, but the online segment is experiencing rapid growth due to increased e-commerce penetration and convenience. Wood remains the most prevalent material, but the use of bamboo and PET is increasing.
- By Distribution Channel:
- Offline: Strong presence of established retailers and showrooms. Key drivers include tangible product experience and immediate availability.
- Online: Rapid growth driven by e-commerce expansion and customer convenience. Key drivers include wider reach and competitive pricing.
- By Application:
- Home Furniture: Dominates the market due to the large consumer base and growing awareness of sustainable living. Key drivers include increasing disposable income and demand for eco-friendly home décor.
- By Material:
- Wood: Remains dominant due to its versatility and established supply chains. Key drivers include traditional aesthetics and perceived durability.
- Bamboo: Rapid growth due to its sustainability and renewable nature. Key drivers include its rapid growth rate and attractive aesthetic appeal.
- PET: Growing adoption driven by its recycled nature. Key drivers include its ability to be molded into diverse shapes and its eco-friendly credentials.
US Sustainable Home Furniture Market Product Developments
Recent innovations focus on utilizing recycled and renewable materials such as reclaimed wood, bamboo, and recycled PET plastics in furniture manufacturing. Companies are also exploring bio-based adhesives and finishes to minimize VOC emissions. These advancements contribute to enhanced product sustainability and cater to the increasing demand for eco-conscious furniture. The market is witnessing a trend towards modular and customizable furniture to reduce waste and enhance longevity.
Key Drivers of US Sustainable Home Furniture Market Growth
The US sustainable home furniture market is propelled by growing environmental awareness among consumers, stricter environmental regulations, and technological advancements in sustainable material science and manufacturing techniques. Government initiatives promoting green building and sustainable consumption patterns further stimulate market growth. The rising disposable income of consumers also enables them to invest in premium, sustainable products.
Challenges in the US Sustainable Home Furniture Market Market
The market faces challenges such as higher production costs associated with sustainable materials, fluctuations in raw material prices, and competition from conventional furniture manufacturers. Supply chain complexities and the need for robust certification and labeling systems also pose obstacles to market expansion. The complexity of designing and producing sustainable furniture adds to the cost, potentially impacting affordability.
Emerging Opportunities in US Sustainable Home Furniture Market
Significant opportunities exist in developing innovative sustainable materials, expanding into new product categories like smart furniture, and forming strategic partnerships with designers and retailers. The market is primed for growth through innovative marketing strategies targeting environmentally conscious consumers, and developing circular economy models such as furniture rental and reuse programs.
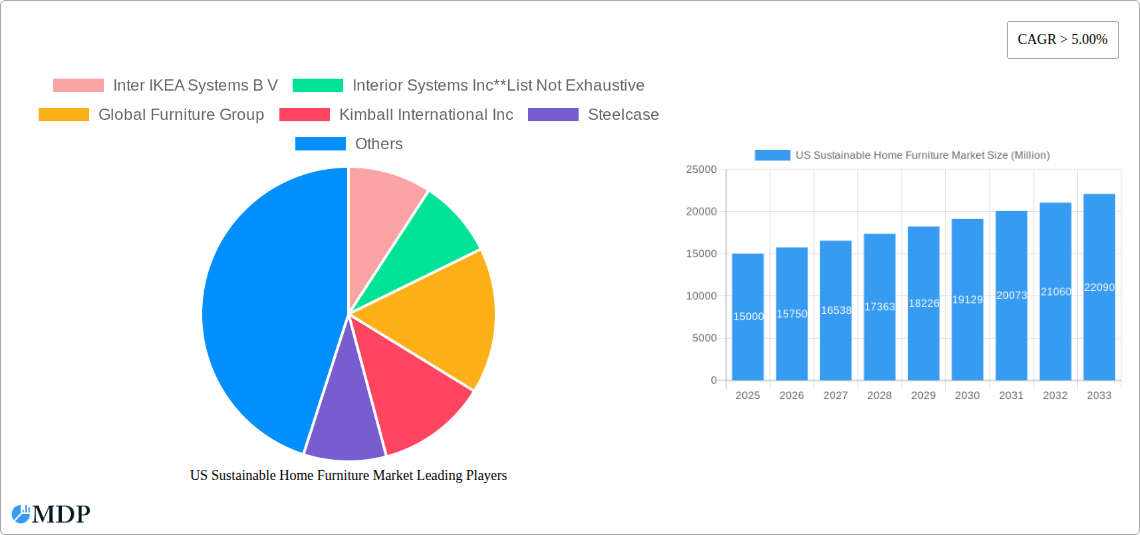
Leading Players in the US Sustainable Home Furniture Market Sector
- Inter IKEA Systems B V
- Interior Systems Inc
- Global Furniture Group
- Kimball International Inc
- Steelcase
- HNI Corporation
- Williams-Sonoma Inc
- Okamura Corp
- Herman Miller Inc
- Wayfair Inc
- Ashley Furniture
- Haworth
- Bed Bath & Beyond Inc
Key Milestones in US Sustainable Home Furniture Market Industry
- April 2021: Wayfair Inc. announced plans to open three new engineering sites, intending to hire approximately 1,000 technologists to accelerate innovation in sustainable technology and potentially improve its supply chain efficiency. This signifies a major investment in technological advancement within the sustainable home furniture sector.
Strategic Outlook for US Sustainable Home Furniture Market Market
The US sustainable home furniture market presents significant long-term growth potential. Strategic partnerships, investments in research and development of new sustainable materials, and adoption of circular economy models will be crucial for success. Companies that can effectively balance sustainability with affordability and design will capture significant market share in the coming years. Focus on transparency and traceability in supply chains will also build consumer trust and enhance market penetration.
US Sustainable Home Furniture Market Segmentation
-
1. Application
- 1.1. Home Furniture
- 1.2. Office Furniture
- 1.3. Hospitality Furniture
- 1.4. Other Furniture
-
2. Material
- 2.1. Wood
- 2.2. Bamboo
- 2.3. PET
- 2.4. Others
-
3. Distribution Channel
- 3.1. Offline
- 3.2. Online
US Sustainable Home Furniture Market Segmentation By Geography
-
1. North America
- 1.1. United States
- 1.2. Canada
- 1.3. Mexico
-
2. South America
- 2.1. Brazil
- 2.2. Argentina
- 2.3. Rest of South America
-
3. Europe
- 3.1. United Kingdom
- 3.2. Germany
- 3.3. France
- 3.4. Italy
- 3.5. Spain
- 3.6. Russia
- 3.7. Benelux
- 3.8. Nordics
- 3.9. Rest of Europe
-
4. Middle East & Africa
- 4.1. Turkey
- 4.2. Israel
- 4.3. GCC
- 4.4. North Africa
- 4.5. South Africa
- 4.6. Rest of Middle East & Africa
-
5. Asia Pacific
- 5.1. China
- 5.2. India
- 5.3. Japan
- 5.4. South Korea
- 5.5. ASEAN
- 5.6. Oceania
- 5.7. Rest of Asia Pacific
US Sustainable Home Furniture Market REPORT HIGHLIGHTS
| Aspects | Details |
|---|---|
| Study Period | 2019-2033 |
| Base Year | 2024 |
| Estimated Year | 2025 |
| Forecast Period | 2025-2033 |
| Historical Period | 2019-2024 |
| Growth Rate | CAGR of > 5.00% from 2019-2033 |
| Segmentation |
|
Table of Contents
- 1. Introduction
- 1.1. Research Scope
- 1.2. Market Segmentation
- 1.3. Research Methodology
- 1.4. Definitions and Assumptions
- 2. Executive Summary
- 2.1. Introduction
- 3. Market Dynamics
- 3.1. Introduction
- 3.2. Market Drivers
- 3.2.1. Rise in E-commerce is Driving the Market; Rise in Construction and Real Estate Sector Drives the Furniture Market
- 3.3. Market Restrains
- 3.3.1. Economic Fluctuations; High Competition in the Furniture Market
- 3.4. Market Trends
- 3.4.1. Residential Sector Driving the Market
- 4. Market Factor Analysis
- 4.1. Porters Five Forces
- 4.2. Supply/Value Chain
- 4.3. PESTEL analysis
- 4.4. Market Entropy
- 4.5. Patent/Trademark Analysis
- 5. Global US Sustainable Home Furniture Market Analysis, Insights and Forecast, 2019-2031
- 5.1. Market Analysis, Insights and Forecast - by Application
- 5.1.1. Home Furniture
- 5.1.2. Office Furniture
- 5.1.3. Hospitality Furniture
- 5.1.4. Other Furniture
- 5.2. Market Analysis, Insights and Forecast - by Material
- 5.2.1. Wood
- 5.2.2. Bamboo
- 5.2.3. PET
- 5.2.4. Others
- 5.3. Market Analysis, Insights and Forecast - by Distribution Channel
- 5.3.1. Offline
- 5.3.2. Online
- 5.4. Market Analysis, Insights and Forecast - by Region
- 5.4.1. North America
- 5.4.2. South America
- 5.4.3. Europe
- 5.4.4. Middle East & Africa
- 5.4.5. Asia Pacific
- 5.1. Market Analysis, Insights and Forecast - by Application
- 6. North America US Sustainable Home Furniture Market Analysis, Insights and Forecast, 2019-2031
- 6.1. Market Analysis, Insights and Forecast - by Application
- 6.1.1. Home Furniture
- 6.1.2. Office Furniture
- 6.1.3. Hospitality Furniture
- 6.1.4. Other Furniture
- 6.2. Market Analysis, Insights and Forecast - by Material
- 6.2.1. Wood
- 6.2.2. Bamboo
- 6.2.3. PET
- 6.2.4. Others
- 6.3. Market Analysis, Insights and Forecast - by Distribution Channel
- 6.3.1. Offline
- 6.3.2. Online
- 6.1. Market Analysis, Insights and Forecast - by Application
- 7. South America US Sustainable Home Furniture Market Analysis, Insights and Forecast, 2019-2031
- 7.1. Market Analysis, Insights and Forecast - by Application
- 7.1.1. Home Furniture
- 7.1.2. Office Furniture
- 7.1.3. Hospitality Furniture
- 7.1.4. Other Furniture
- 7.2. Market Analysis, Insights and Forecast - by Material
- 7.2.1. Wood
- 7.2.2. Bamboo
- 7.2.3. PET
- 7.2.4. Others
- 7.3. Market Analysis, Insights and Forecast - by Distribution Channel
- 7.3.1. Offline
- 7.3.2. Online
- 7.1. Market Analysis, Insights and Forecast - by Application
- 8. Europe US Sustainable Home Furniture Market Analysis, Insights and Forecast, 2019-2031
- 8.1. Market Analysis, Insights and Forecast - by Application
- 8.1.1. Home Furniture
- 8.1.2. Office Furniture
- 8.1.3. Hospitality Furniture
- 8.1.4. Other Furniture
- 8.2. Market Analysis, Insights and Forecast - by Material
- 8.2.1. Wood
- 8.2.2. Bamboo
- 8.2.3. PET
- 8.2.4. Others
- 8.3. Market Analysis, Insights and Forecast - by Distribution Channel
- 8.3.1. Offline
- 8.3.2. Online
- 8.1. Market Analysis, Insights and Forecast - by Application
- 9. Middle East & Africa US Sustainable Home Furniture Market Analysis, Insights and Forecast, 2019-2031
- 9.1. Market Analysis, Insights and Forecast - by Application
- 9.1.1. Home Furniture
- 9.1.2. Office Furniture
- 9.1.3. Hospitality Furniture
- 9.1.4. Other Furniture
- 9.2. Market Analysis, Insights and Forecast - by Material
- 9.2.1. Wood
- 9.2.2. Bamboo
- 9.2.3. PET
- 9.2.4. Others
- 9.3. Market Analysis, Insights and Forecast - by Distribution Channel
- 9.3.1. Offline
- 9.3.2. Online
- 9.1. Market Analysis, Insights and Forecast - by Application
- 10. Asia Pacific US Sustainable Home Furniture Market Analysis, Insights and Forecast, 2019-2031
- 10.1. Market Analysis, Insights and Forecast - by Application
- 10.1.1. Home Furniture
- 10.1.2. Office Furniture
- 10.1.3. Hospitality Furniture
- 10.1.4. Other Furniture
- 10.2. Market Analysis, Insights and Forecast - by Material
- 10.2.1. Wood
- 10.2.2. Bamboo
- 10.2.3. PET
- 10.2.4. Others
- 10.3. Market Analysis, Insights and Forecast - by Distribution Channel
- 10.3.1. Offline
- 10.3.2. Online
- 10.1. Market Analysis, Insights and Forecast - by Application
- 11. Northeast US Sustainable Home Furniture Market Analysis, Insights and Forecast, 2019-2031
- 12. Southeast US Sustainable Home Furniture Market Analysis, Insights and Forecast, 2019-2031
- 13. Midwest US Sustainable Home Furniture Market Analysis, Insights and Forecast, 2019-2031
- 14. Southwest US Sustainable Home Furniture Market Analysis, Insights and Forecast, 2019-2031
- 15. West US Sustainable Home Furniture Market Analysis, Insights and Forecast, 2019-2031
- 16. Competitive Analysis
- 16.1. Global Market Share Analysis 2024
- 16.2. Company Profiles
- 16.2.1 Inter IKEA Systems B V
- 16.2.1.1. Overview
- 16.2.1.2. Products
- 16.2.1.3. SWOT Analysis
- 16.2.1.4. Recent Developments
- 16.2.1.5. Financials (Based on Availability)
- 16.2.2 Interior Systems Inc**List Not Exhaustive
- 16.2.2.1. Overview
- 16.2.2.2. Products
- 16.2.2.3. SWOT Analysis
- 16.2.2.4. Recent Developments
- 16.2.2.5. Financials (Based on Availability)
- 16.2.3 Global Furniture Group
- 16.2.3.1. Overview
- 16.2.3.2. Products
- 16.2.3.3. SWOT Analysis
- 16.2.3.4. Recent Developments
- 16.2.3.5. Financials (Based on Availability)
- 16.2.4 Kimball International Inc
- 16.2.4.1. Overview
- 16.2.4.2. Products
- 16.2.4.3. SWOT Analysis
- 16.2.4.4. Recent Developments
- 16.2.4.5. Financials (Based on Availability)
- 16.2.5 Steelcase
- 16.2.5.1. Overview
- 16.2.5.2. Products
- 16.2.5.3. SWOT Analysis
- 16.2.5.4. Recent Developments
- 16.2.5.5. Financials (Based on Availability)
- 16.2.6 HNI Corporation
- 16.2.6.1. Overview
- 16.2.6.2. Products
- 16.2.6.3. SWOT Analysis
- 16.2.6.4. Recent Developments
- 16.2.6.5. Financials (Based on Availability)
- 16.2.7 Williams-Sonoma Inc
- 16.2.7.1. Overview
- 16.2.7.2. Products
- 16.2.7.3. SWOT Analysis
- 16.2.7.4. Recent Developments
- 16.2.7.5. Financials (Based on Availability)
- 16.2.8 Okamura Corp
- 16.2.8.1. Overview
- 16.2.8.2. Products
- 16.2.8.3. SWOT Analysis
- 16.2.8.4. Recent Developments
- 16.2.8.5. Financials (Based on Availability)
- 16.2.9 Herman Miller Inc
- 16.2.9.1. Overview
- 16.2.9.2. Products
- 16.2.9.3. SWOT Analysis
- 16.2.9.4. Recent Developments
- 16.2.9.5. Financials (Based on Availability)
- 16.2.10 Wayfair Inc
- 16.2.10.1. Overview
- 16.2.10.2. Products
- 16.2.10.3. SWOT Analysis
- 16.2.10.4. Recent Developments
- 16.2.10.5. Financials (Based on Availability)
- 16.2.11 Ashley Furniture
- 16.2.11.1. Overview
- 16.2.11.2. Products
- 16.2.11.3. SWOT Analysis
- 16.2.11.4. Recent Developments
- 16.2.11.5. Financials (Based on Availability)
- 16.2.12 Haworth
- 16.2.12.1. Overview
- 16.2.12.2. Products
- 16.2.12.3. SWOT Analysis
- 16.2.12.4. Recent Developments
- 16.2.12.5. Financials (Based on Availability)
- 16.2.13 Bed Bath & Beyond Inc
- 16.2.13.1. Overview
- 16.2.13.2. Products
- 16.2.13.3. SWOT Analysis
- 16.2.13.4. Recent Developments
- 16.2.13.5. Financials (Based on Availability)
- 16.2.1 Inter IKEA Systems B V
List of Figures
- Figure 1: Global US Sustainable Home Furniture Market Revenue Breakdown (Million, %) by Region 2024 & 2032
- Figure 2: United states US Sustainable Home Furniture Market Revenue (Million), by Country 2024 & 2032
- Figure 3: United states US Sustainable Home Furniture Market Revenue Share (%), by Country 2024 & 2032
- Figure 4: North America US Sustainable Home Furniture Market Revenue (Million), by Application 2024 & 2032
- Figure 5: North America US Sustainable Home Furniture Market Revenue Share (%), by Application 2024 & 2032
- Figure 6: North America US Sustainable Home Furniture Market Revenue (Million), by Material 2024 & 2032
- Figure 7: North America US Sustainable Home Furniture Market Revenue Share (%), by Material 2024 & 2032
- Figure 8: North America US Sustainable Home Furniture Market Revenue (Million), by Distribution Channel 2024 & 2032
- Figure 9: North America US Sustainable Home Furniture Market Revenue Share (%), by Distribution Channel 2024 & 2032
- Figure 10: North America US Sustainable Home Furniture Market Revenue (Million), by Country 2024 & 2032
- Figure 11: North America US Sustainable Home Furniture Market Revenue Share (%), by Country 2024 & 2032
- Figure 12: South America US Sustainable Home Furniture Market Revenue (Million), by Application 2024 & 2032
- Figure 13: South America US Sustainable Home Furniture Market Revenue Share (%), by Application 2024 & 2032
- Figure 14: South America US Sustainable Home Furniture Market Revenue (Million), by Material 2024 & 2032
- Figure 15: South America US Sustainable Home Furniture Market Revenue Share (%), by Material 2024 & 2032
- Figure 16: South America US Sustainable Home Furniture Market Revenue (Million), by Distribution Channel 2024 & 2032
- Figure 17: South America US Sustainable Home Furniture Market Revenue Share (%), by Distribution Channel 2024 & 2032
- Figure 18: South America US Sustainable Home Furniture Market Revenue (Million), by Country 2024 & 2032
- Figure 19: South America US Sustainable Home Furniture Market Revenue Share (%), by Country 2024 & 2032
- Figure 20: Europe US Sustainable Home Furniture Market Revenue (Million), by Application 2024 & 2032
- Figure 21: Europe US Sustainable Home Furniture Market Revenue Share (%), by Application 2024 & 2032
- Figure 22: Europe US Sustainable Home Furniture Market Revenue (Million), by Material 2024 & 2032
- Figure 23: Europe US Sustainable Home Furniture Market Revenue Share (%), by Material 2024 & 2032
- Figure 24: Europe US Sustainable Home Furniture Market Revenue (Million), by Distribution Channel 2024 & 2032
- Figure 25: Europe US Sustainable Home Furniture Market Revenue Share (%), by Distribution Channel 2024 & 2032
- Figure 26: Europe US Sustainable Home Furniture Market Revenue (Million), by Country 2024 & 2032
- Figure 27: Europe US Sustainable Home Furniture Market Revenue Share (%), by Country 2024 & 2032
- Figure 28: Middle East & Africa US Sustainable Home Furniture Market Revenue (Million), by Application 2024 & 2032
- Figure 29: Middle East & Africa US Sustainable Home Furniture Market Revenue Share (%), by Application 2024 & 2032
- Figure 30: Middle East & Africa US Sustainable Home Furniture Market Revenue (Million), by Material 2024 & 2032
- Figure 31: Middle East & Africa US Sustainable Home Furniture Market Revenue Share (%), by Material 2024 & 2032
- Figure 32: Middle East & Africa US Sustainable Home Furniture Market Revenue (Million), by Distribution Channel 2024 & 2032
- Figure 33: Middle East & Africa US Sustainable Home Furniture Market Revenue Share (%), by Distribution Channel 2024 & 2032
- Figure 34: Middle East & Africa US Sustainable Home Furniture Market Revenue (Million), by Country 2024 & 2032
- Figure 35: Middle East & Africa US Sustainable Home Furniture Market Revenue Share (%), by Country 2024 & 2032
- Figure 36: Asia Pacific US Sustainable Home Furniture Market Revenue (Million), by Application 2024 & 2032
- Figure 37: Asia Pacific US Sustainable Home Furniture Market Revenue Share (%), by Application 2024 & 2032
- Figure 38: Asia Pacific US Sustainable Home Furniture Market Revenue (Million), by Material 2024 & 2032
- Figure 39: Asia Pacific US Sustainable Home Furniture Market Revenue Share (%), by Material 2024 & 2032
- Figure 40: Asia Pacific US Sustainable Home Furniture Market Revenue (Million), by Distribution Channel 2024 & 2032
- Figure 41: Asia Pacific US Sustainable Home Furniture Market Revenue Share (%), by Distribution Channel 2024 & 2032
- Figure 42: Asia Pacific US Sustainable Home Furniture Market Revenue (Million), by Country 2024 & 2032
- Figure 43: Asia Pacific US Sustainable Home Furniture Market Revenue Share (%), by Country 2024 & 2032
List of Tables
- Table 1: Global US Sustainable Home Furniture Market Revenue Million Forecast, by Region 2019 & 2032
- Table 2: Global US Sustainable Home Furniture Market Revenue Million Forecast, by Application 2019 & 2032
- Table 3: Global US Sustainable Home Furniture Market Revenue Million Forecast, by Material 2019 & 2032
- Table 4: Global US Sustainable Home Furniture Market Revenue Million Forecast, by Distribution Channel 2019 & 2032
- Table 5: Global US Sustainable Home Furniture Market Revenue Million Forecast, by Region 2019 & 2032
- Table 6: Global US Sustainable Home Furniture Market Revenue Million Forecast, by Country 2019 & 2032
- Table 7: Northeast US Sustainable Home Furniture Market Revenue (Million) Forecast, by Application 2019 & 2032
- Table 8: Southeast US Sustainable Home Furniture Market Revenue (Million) Forecast, by Application 2019 & 2032
- Table 9: Midwest US Sustainable Home Furniture Market Revenue (Million) Forecast, by Application 2019 & 2032
- Table 10: Southwest US Sustainable Home Furniture Market Revenue (Million) Forecast, by Application 2019 & 2032
- Table 11: West US Sustainable Home Furniture Market Revenue (Million) Forecast, by Application 2019 & 2032
- Table 12: Global US Sustainable Home Furniture Market Revenue Million Forecast, by Application 2019 & 2032
- Table 13: Global US Sustainable Home Furniture Market Revenue Million Forecast, by Material 2019 & 2032
- Table 14: Global US Sustainable Home Furniture Market Revenue Million Forecast, by Distribution Channel 2019 & 2032
- Table 15: Global US Sustainable Home Furniture Market Revenue Million Forecast, by Country 2019 & 2032
- Table 16: United States US Sustainable Home Furniture Market Revenue (Million) Forecast, by Application 2019 & 2032
- Table 17: Canada US Sustainable Home Furniture Market Revenue (Million) Forecast, by Application 2019 & 2032
- Table 18: Mexico US Sustainable Home Furniture Market Revenue (Million) Forecast, by Application 2019 & 2032
- Table 19: Global US Sustainable Home Furniture Market Revenue Million Forecast, by Application 2019 & 2032
- Table 20: Global US Sustainable Home Furniture Market Revenue Million Forecast, by Material 2019 & 2032
- Table 21: Global US Sustainable Home Furniture Market Revenue Million Forecast, by Distribution Channel 2019 & 2032
- Table 22: Global US Sustainable Home Furniture Market Revenue Million Forecast, by Country 2019 & 2032
- Table 23: Brazil US Sustainable Home Furniture Market Revenue (Million) Forecast, by Application 2019 & 2032
- Table 24: Argentina US Sustainable Home Furniture Market Revenue (Million) Forecast, by Application 2019 & 2032
- Table 25: Rest of South America US Sustainable Home Furniture Market Revenue (Million) Forecast, by Application 2019 & 2032
- Table 26: Global US Sustainable Home Furniture Market Revenue Million Forecast, by Application 2019 & 2032
- Table 27: Global US Sustainable Home Furniture Market Revenue Million Forecast, by Material 2019 & 2032
- Table 28: Global US Sustainable Home Furniture Market Revenue Million Forecast, by Distribution Channel 2019 & 2032
- Table 29: Global US Sustainable Home Furniture Market Revenue Million Forecast, by Country 2019 & 2032
- Table 30: United Kingdom US Sustainable Home Furniture Market Revenue (Million) Forecast, by Application 2019 & 2032
- Table 31: Germany US Sustainable Home Furniture Market Revenue (Million) Forecast, by Application 2019 & 2032
- Table 32: France US Sustainable Home Furniture Market Revenue (Million) Forecast, by Application 2019 & 2032
- Table 33: Italy US Sustainable Home Furniture Market Revenue (Million) Forecast, by Application 2019 & 2032
- Table 34: Spain US Sustainable Home Furniture Market Revenue (Million) Forecast, by Application 2019 & 2032
- Table 35: Russia US Sustainable Home Furniture Market Revenue (Million) Forecast, by Application 2019 & 2032
- Table 36: Benelux US Sustainable Home Furniture Market Revenue (Million) Forecast, by Application 2019 & 2032
- Table 37: Nordics US Sustainable Home Furniture Market Revenue (Million) Forecast, by Application 2019 & 2032
- Table 38: Rest of Europe US Sustainable Home Furniture Market Revenue (Million) Forecast, by Application 2019 & 2032
- Table 39: Global US Sustainable Home Furniture Market Revenue Million Forecast, by Application 2019 & 2032
- Table 40: Global US Sustainable Home Furniture Market Revenue Million Forecast, by Material 2019 & 2032
- Table 41: Global US Sustainable Home Furniture Market Revenue Million Forecast, by Distribution Channel 2019 & 2032
- Table 42: Global US Sustainable Home Furniture Market Revenue Million Forecast, by Country 2019 & 2032
- Table 43: Turkey US Sustainable Home Furniture Market Revenue (Million) Forecast, by Application 2019 & 2032
- Table 44: Israel US Sustainable Home Furniture Market Revenue (Million) Forecast, by Application 2019 & 2032
- Table 45: GCC US Sustainable Home Furniture Market Revenue (Million) Forecast, by Application 2019 & 2032
- Table 46: North Africa US Sustainable Home Furniture Market Revenue (Million) Forecast, by Application 2019 & 2032
- Table 47: South Africa US Sustainable Home Furniture Market Revenue (Million) Forecast, by Application 2019 & 2032
- Table 48: Rest of Middle East & Africa US Sustainable Home Furniture Market Revenue (Million) Forecast, by Application 2019 & 2032
- Table 49: Global US Sustainable Home Furniture Market Revenue Million Forecast, by Application 2019 & 2032
- Table 50: Global US Sustainable Home Furniture Market Revenue Million Forecast, by Material 2019 & 2032
- Table 51: Global US Sustainable Home Furniture Market Revenue Million Forecast, by Distribution Channel 2019 & 2032
- Table 52: Global US Sustainable Home Furniture Market Revenue Million Forecast, by Country 2019 & 2032
- Table 53: China US Sustainable Home Furniture Market Revenue (Million) Forecast, by Application 2019 & 2032
- Table 54: India US Sustainable Home Furniture Market Revenue (Million) Forecast, by Application 2019 & 2032
- Table 55: Japan US Sustainable Home Furniture Market Revenue (Million) Forecast, by Application 2019 & 2032
- Table 56: South Korea US Sustainable Home Furniture Market Revenue (Million) Forecast, by Application 2019 & 2032
- Table 57: ASEAN US Sustainable Home Furniture Market Revenue (Million) Forecast, by Application 2019 & 2032
- Table 58: Oceania US Sustainable Home Furniture Market Revenue (Million) Forecast, by Application 2019 & 2032
- Table 59: Rest of Asia Pacific US Sustainable Home Furniture Market Revenue (Million) Forecast, by Application 2019 & 2032
Frequently Asked Questions
1. What is the projected Compound Annual Growth Rate (CAGR) of the US Sustainable Home Furniture Market?
The projected CAGR is approximately > 5.00%.
2. Which companies are prominent players in the US Sustainable Home Furniture Market?
Key companies in the market include Inter IKEA Systems B V, Interior Systems Inc**List Not Exhaustive, Global Furniture Group, Kimball International Inc, Steelcase, HNI Corporation, Williams-Sonoma Inc, Okamura Corp, Herman Miller Inc, Wayfair Inc, Ashley Furniture, Haworth, Bed Bath & Beyond Inc.
3. What are the main segments of the US Sustainable Home Furniture Market?
The market segments include Application, Material, Distribution Channel.
4. Can you provide details about the market size?
The market size is estimated to be USD XX Million as of 2022.
5. What are some drivers contributing to market growth?
Rise in E-commerce is Driving the Market; Rise in Construction and Real Estate Sector Drives the Furniture Market.
6. What are the notable trends driving market growth?
Residential Sector Driving the Market.
7. Are there any restraints impacting market growth?
Economic Fluctuations; High Competition in the Furniture Market.
8. Can you provide examples of recent developments in the market?
In April 2021, Wayfair Inc., the leading home furniture chain, planned to open three new engineering sites in the San Francisco Bay Area of California, Austin, Texas, and Toronto in Ontario, Canada. The company is planning to hire approximately 1,000 technologists to its world-class engineering organization globally over the next year.
9. What pricing options are available for accessing the report?
Pricing options include single-user, multi-user, and enterprise licenses priced at USD 3800, USD 4500, and USD 5800 respectively.
10. Is the market size provided in terms of value or volume?
The market size is provided in terms of value, measured in Million.
11. Are there any specific market keywords associated with the report?
Yes, the market keyword associated with the report is "US Sustainable Home Furniture Market," which aids in identifying and referencing the specific market segment covered.
12. How do I determine which pricing option suits my needs best?
The pricing options vary based on user requirements and access needs. Individual users may opt for single-user licenses, while businesses requiring broader access may choose multi-user or enterprise licenses for cost-effective access to the report.
13. Are there any additional resources or data provided in the US Sustainable Home Furniture Market report?
While the report offers comprehensive insights, it's advisable to review the specific contents or supplementary materials provided to ascertain if additional resources or data are available.
14. How can I stay updated on further developments or reports in the US Sustainable Home Furniture Market?
To stay informed about further developments, trends, and reports in the US Sustainable Home Furniture Market, consider subscribing to industry newsletters, following relevant companies and organizations, or regularly checking reputable industry news sources and publications.
Methodology
Step 1 - Identification of Relevant Samples Size from Population Database


Step 2 - Approaches for Defining Global Market Size (Value, Volume* & Price*)

Note*: In applicable scenarios
Step 3 - Data Sources
Primary Research
- Web Analytics
- Survey Reports
- Research Institute
- Latest Research Reports
- Opinion Leaders
Secondary Research
- Annual Reports
- White Paper
- Latest Press Release
- Industry Association
- Paid Database
- Investor Presentations

Step 4 - Data Triangulation
Involves using different sources of information in order to increase the validity of a study
These sources are likely to be stakeholders in a program - participants, other researchers, program staff, other community members, and so on.
Then we put all data in single framework & apply various statistical tools to find out the dynamic on the market.
During the analysis stage, feedback from the stakeholder groups would be compared to determine areas of agreement as well as areas of divergence
