

Key Insights
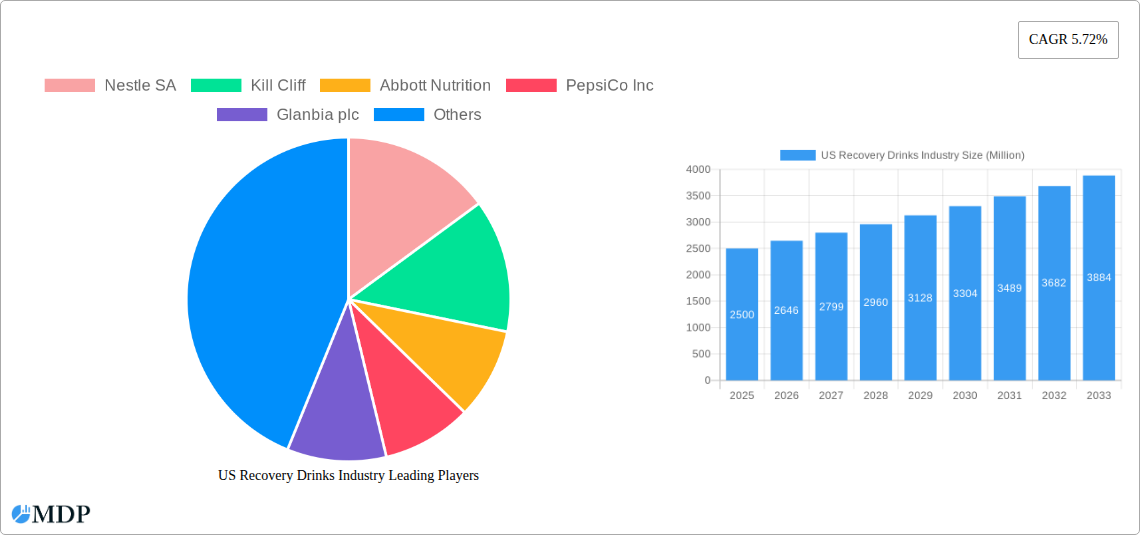
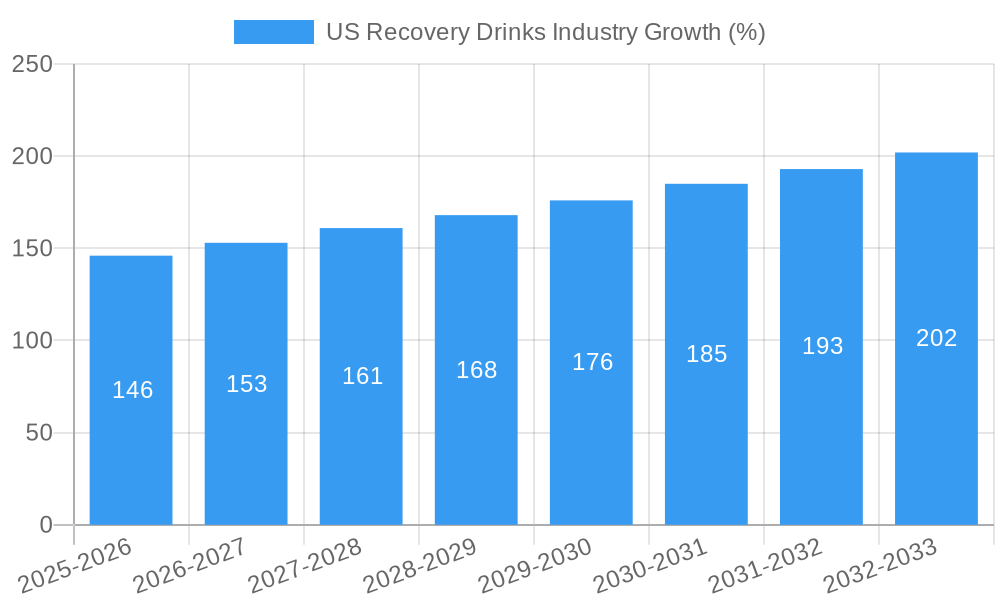
The US recovery drink market, valued at approximately $2.5 billion in 2025, is projected to experience robust growth, exhibiting a compound annual growth rate (CAGR) of 5.72% from 2025 to 2033. This expansion is fueled by several key drivers. Increasing awareness of the benefits of electrolyte replenishment and rapid rehydration following intense physical activity, particularly among athletes and fitness enthusiasts, is a significant factor. The growing popularity of functional beverages, emphasizing health and wellness, further contributes to market growth. Product innovation, with the introduction of new flavors, formulations incorporating natural ingredients, and convenient packaging formats (like ready-to-drink options), is also driving consumer adoption. The market is segmented by product type (RTD and powder) and distribution channel (supermarkets/hypermarkets, specialty stores, convenience stores, and online retail). Ready-to-drink options currently dominate, reflecting convenience preferences, while online retail channels are experiencing accelerated growth due to increased e-commerce penetration and direct-to-consumer marketing strategies employed by brands.
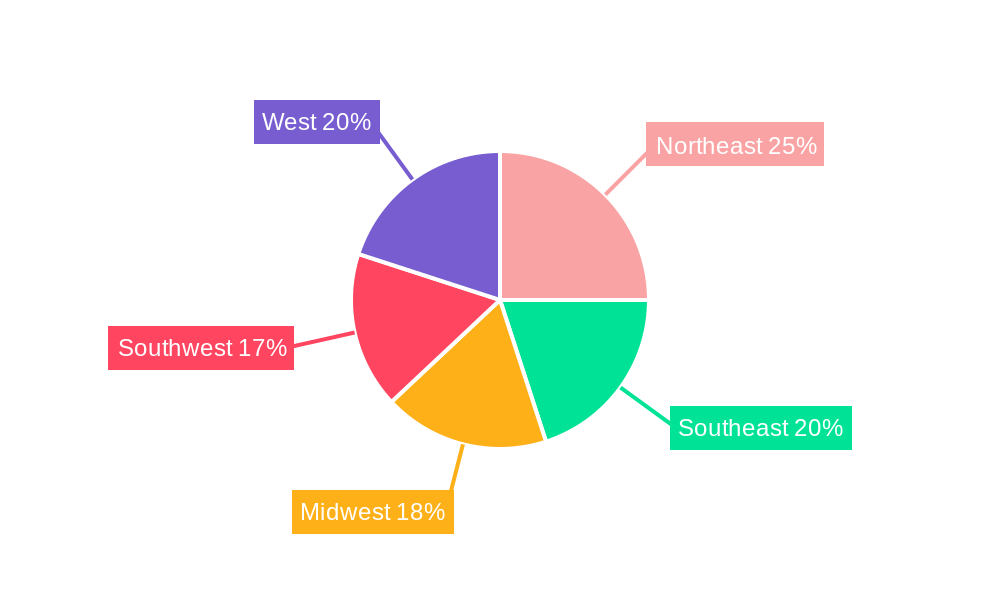
Despite the positive outlook, certain challenges persist. Price sensitivity among consumers, particularly concerning premium recovery drink options, can impede market expansion. Intense competition among established players like Nestle SA, PepsiCo Inc., and Abbott Nutrition, alongside emerging brands focusing on niche segments, creates a dynamic and competitive landscape. Furthermore, fluctuating raw material costs and potential regulatory changes concerning food and beverage additives might pose challenges to consistent market growth. Regional variations exist, with the West and Northeast regions expected to lead market share due to higher concentrations of health-conscious consumers and fitness enthusiasts. The continued rise of e-sports and the increasing participation in fitness activities suggest further expansion of the US recovery drink market in the coming years. Growth will be strategically shaped by companies' abilities to innovate, target specific consumer segments effectively, and manage supply chain complexities while responding to health and wellness trends.
US Recovery Drinks Industry Report: 2019-2033 Forecast
Unlocking Explosive Growth in the Multi-Billion Dollar US Recovery Drinks Market
This comprehensive report delivers an in-depth analysis of the US recovery drinks industry, providing critical insights for stakeholders seeking to navigate this dynamic and rapidly expanding market. From market sizing and segmentation to competitive landscapes and future growth projections, this report is your essential guide to success. With a study period spanning 2019-2033, a base year of 2025, and an estimated year of 2025, this report projects a compelling growth trajectory for the US recovery drinks market, reaching an estimated XX Million by 2033.
US Recovery Drinks Industry Market Dynamics & Concentration
The US recovery drinks market, valued at XX Million in 2025, exhibits a moderately concentrated landscape dominated by a handful of multinational corporations like Nestle SA, PepsiCo Inc., and Danone SA, alongside emerging players like Kill Cliff and Energy Lab Nutrition. However, the market demonstrates significant dynamism fueled by several factors:
- Innovation: The continuous development of new product formulations, incorporating advanced ingredients and functional benefits (e.g., enhanced electrolyte profiles, added vitamins, and natural sweeteners), drives market growth and caters to evolving consumer demands.
- Regulatory Landscape: The FDA’s evolving regulations concerning labeling, ingredient claims, and safety standards influence product development and market competition. Compliance requirements, while posing challenges, also foster transparency and build consumer trust.
- Product Substitutes: Competition arises from traditional sports drinks, energy drinks, and other functional beverages. However, the unique focus on post-workout recovery differentiates recovery drinks and provides a niche market opportunity.
- End-User Trends: Growing health consciousness among consumers, particularly athletes and fitness enthusiasts, drives demand. This trend is further fueled by increasing participation in sports and fitness activities.
- Mergers & Acquisitions (M&A): The industry has witnessed a moderate level of M&A activity in recent years, with larger companies acquiring smaller players to expand their product portfolios and market reach. The number of M&A deals in the recovery drinks sector averaged approximately XX per year during 2019-2024, indicating a moderately active consolidation phase. Market share is largely fragmented, with the top 5 players holding an estimated XX% collective market share in 2025.
US Recovery Drinks Industry Industry Trends & Analysis
The US recovery drinks market is characterized by robust growth, driven by several key trends:
The market experienced a Compound Annual Growth Rate (CAGR) of XX% during the historical period (2019-2024). This positive growth trajectory is projected to continue, with a projected CAGR of XX% during the forecast period (2025-2033). Market penetration among target demographics remains relatively high for RTD products and shows potential for significant growth in powder-based segments. Consumer preference shifts towards natural, clean-label products and those catering to specific dietary needs and restrictions, such as vegan, gluten-free, and organic options. This consumer preference directly influences product development strategies across leading brands and drives innovation. Technological advancements in manufacturing processes enhance product quality, consistency, and efficiency, enabling wider distribution and improved affordability. Competitive dynamics are characterized by increased product diversification, strategic pricing strategies, and expanding distribution channels.
Leading Markets & Segments in US Recovery Drinks Industry
The US recovery drinks market shows significant regional variations and segment dominance.
By Product Type: Ready-to-drink (RTD) recovery drinks currently dominate the market, accounting for approximately XX% of total revenue in 2025. However, powder-based recovery drinks are experiencing faster growth due to their convenience, cost-effectiveness, and growing consumer preference for customizable formulations.
By Distribution Channel: Supermarkets/hypermarkets are the primary distribution channel, capturing around XX% of the market share in 2025, followed by specialty stores/health stores and online retail stores. Online retail is showing strong growth potential driven by increased e-commerce adoption and convenient direct-to-consumer models.
Key drivers for these dominant segments include:
- Economic factors: Consumer spending on health and wellness products is rising, underpinning demand for premium recovery drinks.
- Infrastructure: Efficient distribution networks and widespread retail presence of supermarkets/hypermarkets ensure wide product availability.
US Recovery Drinks Industry Product Developments
Recent product innovations focus on enhancing the functional benefits of recovery drinks. This includes the incorporation of advanced protein blends, specialized carbohydrate sources, and adaptogens to optimize muscle recovery and enhance athletic performance. The emphasis is on clean label formulations, reducing artificial ingredients and prioritizing natural sweeteners and flavors, aligning with consumer demand for healthier product options. This development also includes convenient formats such as single-serve pouches and on-the-go packaging options.
Key Drivers of US Recovery Drinks Industry Growth
Several factors contribute to the sustained growth of the US recovery drinks market:
- Technological advancements: Improved production methods and innovative ingredient formulations enhance product quality and functionality.
- Economic prosperity: Growing disposable incomes fuel consumer spending on health and wellness products.
- Favorable regulatory environment: Clear labeling and safety standards promote consumer trust and market expansion.
Challenges in the US Recovery Drinks Industry Market
The US recovery drinks market faces certain challenges:
- Intense competition: The market's growth attracts numerous new entrants, leading to price wars and reduced profit margins.
- Supply chain disruptions: Global events and logistical issues can affect the availability of raw materials and impact production.
- Stringent regulatory requirements: Compliance with FDA regulations requires significant investment and may hinder smaller players.
Emerging Opportunities in US Recovery Drinks Industry
Several opportunities promise to propel the market's long-term growth:
Expansion into niche markets, such as plant-based and personalized recovery drinks, promises lucrative new avenues for growth. Strategic partnerships with fitness centers, gyms, and sports teams could expand brand awareness and distribution. Technological innovations in product personalization and targeted delivery of nutrients present significant opportunities for innovation and market differentiation.
Leading Players in the US Recovery Drinks Industry Sector
- Nestle SA
- Kill Cliff
- Abbott Nutrition
- PepsiCo Inc
- Glanbia plc
- Energy Lab Nutrition
- Fluid Sports Nutrition
- Danone SA
Key Milestones in US Recovery Drinks Industry Industry
- 2020: Several key players launched new lines of plant-based recovery drinks, reflecting growing consumer demand for vegan-friendly options.
- 2022: Increased focus on personalized recovery solutions, with brands offering customized products based on individual needs and athletic goals.
- 2023: Significant investment in research and development to explore innovative ingredients and formulations to enhance recovery benefits.
Strategic Outlook for US Recovery Drinks Industry Market
The US recovery drinks market holds immense future potential. Strategic acquisitions, innovation in product formulations, and expansion into new distribution channels will be vital for long-term success. The focus on personalization and targeted nutritional solutions will continue to drive growth, attracting a broader range of health-conscious consumers.
US Recovery Drinks Industry Segmentation
-
1. Product Type
- 1.1. RTD
- 1.2. Powder
-
2. Distribution Channel
- 2.1. Supermarkets/ Hypermarkets
- 2.2. Specialty Stores/Health Stores
- 2.3. Convenience Stores
- 2.4. Online Retail Stores
- 2.5. Others
US Recovery Drinks Industry Segmentation By Geography
-
1. North America
- 1.1. United States
- 1.2. Canada
- 1.3. Mexico
-
2. South America
- 2.1. Brazil
- 2.2. Argentina
- 2.3. Rest of South America
-
3. Europe
- 3.1. United Kingdom
- 3.2. Germany
- 3.3. France
- 3.4. Italy
- 3.5. Spain
- 3.6. Russia
- 3.7. Benelux
- 3.8. Nordics
- 3.9. Rest of Europe
-
4. Middle East & Africa
- 4.1. Turkey
- 4.2. Israel
- 4.3. GCC
- 4.4. North Africa
- 4.5. South Africa
- 4.6. Rest of Middle East & Africa
-
5. Asia Pacific
- 5.1. China
- 5.2. India
- 5.3. Japan
- 5.4. South Korea
- 5.5. ASEAN
- 5.6. Oceania
- 5.7. Rest of Asia Pacific
US Recovery Drinks Industry REPORT HIGHLIGHTS
| Aspects | Details |
|---|---|
| Study Period | 2019-2033 |
| Base Year | 2024 |
| Estimated Year | 2025 |
| Forecast Period | 2025-2033 |
| Historical Period | 2019-2024 |
| Growth Rate | CAGR of 5.72% from 2019-2033 |
| Segmentation |
|
Table of Contents
- 1. Introduction
- 1.1. Research Scope
- 1.2. Market Segmentation
- 1.3. Research Methodology
- 1.4. Definitions and Assumptions
- 2. Executive Summary
- 2.1. Introduction
- 3. Market Dynamics
- 3.1. Introduction
- 3.2. Market Drivers
- 3.2.1. Demand for specialty and organic coffee pods and capsules; Innovations in packaging formats
- 3.3. Market Restrains
- 3.3.1. Availability of counterfeit products
- 3.4. Market Trends
- 3.4.1 Growing Physical Activity Participation Rate
- 3.4.2 Coupled With Marketing Campaigns
- 4. Market Factor Analysis
- 4.1. Porters Five Forces
- 4.2. Supply/Value Chain
- 4.3. PESTEL analysis
- 4.4. Market Entropy
- 4.5. Patent/Trademark Analysis
- 5. Global US Recovery Drinks Industry Analysis, Insights and Forecast, 2019-2031
- 5.1. Market Analysis, Insights and Forecast - by Product Type
- 5.1.1. RTD
- 5.1.2. Powder
- 5.2. Market Analysis, Insights and Forecast - by Distribution Channel
- 5.2.1. Supermarkets/ Hypermarkets
- 5.2.2. Specialty Stores/Health Stores
- 5.2.3. Convenience Stores
- 5.2.4. Online Retail Stores
- 5.2.5. Others
- 5.3. Market Analysis, Insights and Forecast - by Region
- 5.3.1. North America
- 5.3.2. South America
- 5.3.3. Europe
- 5.3.4. Middle East & Africa
- 5.3.5. Asia Pacific
- 5.1. Market Analysis, Insights and Forecast - by Product Type
- 6. North America US Recovery Drinks Industry Analysis, Insights and Forecast, 2019-2031
- 6.1. Market Analysis, Insights and Forecast - by Product Type
- 6.1.1. RTD
- 6.1.2. Powder
- 6.2. Market Analysis, Insights and Forecast - by Distribution Channel
- 6.2.1. Supermarkets/ Hypermarkets
- 6.2.2. Specialty Stores/Health Stores
- 6.2.3. Convenience Stores
- 6.2.4. Online Retail Stores
- 6.2.5. Others
- 6.1. Market Analysis, Insights and Forecast - by Product Type
- 7. South America US Recovery Drinks Industry Analysis, Insights and Forecast, 2019-2031
- 7.1. Market Analysis, Insights and Forecast - by Product Type
- 7.1.1. RTD
- 7.1.2. Powder
- 7.2. Market Analysis, Insights and Forecast - by Distribution Channel
- 7.2.1. Supermarkets/ Hypermarkets
- 7.2.2. Specialty Stores/Health Stores
- 7.2.3. Convenience Stores
- 7.2.4. Online Retail Stores
- 7.2.5. Others
- 7.1. Market Analysis, Insights and Forecast - by Product Type
- 8. Europe US Recovery Drinks Industry Analysis, Insights and Forecast, 2019-2031
- 8.1. Market Analysis, Insights and Forecast - by Product Type
- 8.1.1. RTD
- 8.1.2. Powder
- 8.2. Market Analysis, Insights and Forecast - by Distribution Channel
- 8.2.1. Supermarkets/ Hypermarkets
- 8.2.2. Specialty Stores/Health Stores
- 8.2.3. Convenience Stores
- 8.2.4. Online Retail Stores
- 8.2.5. Others
- 8.1. Market Analysis, Insights and Forecast - by Product Type
- 9. Middle East & Africa US Recovery Drinks Industry Analysis, Insights and Forecast, 2019-2031
- 9.1. Market Analysis, Insights and Forecast - by Product Type
- 9.1.1. RTD
- 9.1.2. Powder
- 9.2. Market Analysis, Insights and Forecast - by Distribution Channel
- 9.2.1. Supermarkets/ Hypermarkets
- 9.2.2. Specialty Stores/Health Stores
- 9.2.3. Convenience Stores
- 9.2.4. Online Retail Stores
- 9.2.5. Others
- 9.1. Market Analysis, Insights and Forecast - by Product Type
- 10. Asia Pacific US Recovery Drinks Industry Analysis, Insights and Forecast, 2019-2031
- 10.1. Market Analysis, Insights and Forecast - by Product Type
- 10.1.1. RTD
- 10.1.2. Powder
- 10.2. Market Analysis, Insights and Forecast - by Distribution Channel
- 10.2.1. Supermarkets/ Hypermarkets
- 10.2.2. Specialty Stores/Health Stores
- 10.2.3. Convenience Stores
- 10.2.4. Online Retail Stores
- 10.2.5. Others
- 10.1. Market Analysis, Insights and Forecast - by Product Type
- 11. Northeast US Recovery Drinks Industry Analysis, Insights and Forecast, 2019-2031
- 12. Southeast US Recovery Drinks Industry Analysis, Insights and Forecast, 2019-2031
- 13. Midwest US Recovery Drinks Industry Analysis, Insights and Forecast, 2019-2031
- 14. Southwest US Recovery Drinks Industry Analysis, Insights and Forecast, 2019-2031
- 15. West US Recovery Drinks Industry Analysis, Insights and Forecast, 2019-2031
- 16. Competitive Analysis
- 16.1. Global Market Share Analysis 2024
- 16.2. Company Profiles
- 16.2.1 Nestle SA
- 16.2.1.1. Overview
- 16.2.1.2. Products
- 16.2.1.3. SWOT Analysis
- 16.2.1.4. Recent Developments
- 16.2.1.5. Financials (Based on Availability)
- 16.2.2 Kill Cliff
- 16.2.2.1. Overview
- 16.2.2.2. Products
- 16.2.2.3. SWOT Analysis
- 16.2.2.4. Recent Developments
- 16.2.2.5. Financials (Based on Availability)
- 16.2.3 Abbott Nutrition
- 16.2.3.1. Overview
- 16.2.3.2. Products
- 16.2.3.3. SWOT Analysis
- 16.2.3.4. Recent Developments
- 16.2.3.5. Financials (Based on Availability)
- 16.2.4 PepsiCo Inc
- 16.2.4.1. Overview
- 16.2.4.2. Products
- 16.2.4.3. SWOT Analysis
- 16.2.4.4. Recent Developments
- 16.2.4.5. Financials (Based on Availability)
- 16.2.5 Glanbia plc
- 16.2.5.1. Overview
- 16.2.5.2. Products
- 16.2.5.3. SWOT Analysis
- 16.2.5.4. Recent Developments
- 16.2.5.5. Financials (Based on Availability)
- 16.2.6 Energy Lab Nutrition
- 16.2.6.1. Overview
- 16.2.6.2. Products
- 16.2.6.3. SWOT Analysis
- 16.2.6.4. Recent Developments
- 16.2.6.5. Financials (Based on Availability)
- 16.2.7 Fluid Sports Nutrition*List Not Exhaustive
- 16.2.7.1. Overview
- 16.2.7.2. Products
- 16.2.7.3. SWOT Analysis
- 16.2.7.4. Recent Developments
- 16.2.7.5. Financials (Based on Availability)
- 16.2.8 Danone SA
- 16.2.8.1. Overview
- 16.2.8.2. Products
- 16.2.8.3. SWOT Analysis
- 16.2.8.4. Recent Developments
- 16.2.8.5. Financials (Based on Availability)
- 16.2.1 Nestle SA
List of Figures
- Figure 1: Global US Recovery Drinks Industry Revenue Breakdown (Million, %) by Region 2024 & 2032
- Figure 2: United states US Recovery Drinks Industry Revenue (Million), by Country 2024 & 2032
- Figure 3: United states US Recovery Drinks Industry Revenue Share (%), by Country 2024 & 2032
- Figure 4: North America US Recovery Drinks Industry Revenue (Million), by Product Type 2024 & 2032
- Figure 5: North America US Recovery Drinks Industry Revenue Share (%), by Product Type 2024 & 2032
- Figure 6: North America US Recovery Drinks Industry Revenue (Million), by Distribution Channel 2024 & 2032
- Figure 7: North America US Recovery Drinks Industry Revenue Share (%), by Distribution Channel 2024 & 2032
- Figure 8: North America US Recovery Drinks Industry Revenue (Million), by Country 2024 & 2032
- Figure 9: North America US Recovery Drinks Industry Revenue Share (%), by Country 2024 & 2032
- Figure 10: South America US Recovery Drinks Industry Revenue (Million), by Product Type 2024 & 2032
- Figure 11: South America US Recovery Drinks Industry Revenue Share (%), by Product Type 2024 & 2032
- Figure 12: South America US Recovery Drinks Industry Revenue (Million), by Distribution Channel 2024 & 2032
- Figure 13: South America US Recovery Drinks Industry Revenue Share (%), by Distribution Channel 2024 & 2032
- Figure 14: South America US Recovery Drinks Industry Revenue (Million), by Country 2024 & 2032
- Figure 15: South America US Recovery Drinks Industry Revenue Share (%), by Country 2024 & 2032
- Figure 16: Europe US Recovery Drinks Industry Revenue (Million), by Product Type 2024 & 2032
- Figure 17: Europe US Recovery Drinks Industry Revenue Share (%), by Product Type 2024 & 2032
- Figure 18: Europe US Recovery Drinks Industry Revenue (Million), by Distribution Channel 2024 & 2032
- Figure 19: Europe US Recovery Drinks Industry Revenue Share (%), by Distribution Channel 2024 & 2032
- Figure 20: Europe US Recovery Drinks Industry Revenue (Million), by Country 2024 & 2032
- Figure 21: Europe US Recovery Drinks Industry Revenue Share (%), by Country 2024 & 2032
- Figure 22: Middle East & Africa US Recovery Drinks Industry Revenue (Million), by Product Type 2024 & 2032
- Figure 23: Middle East & Africa US Recovery Drinks Industry Revenue Share (%), by Product Type 2024 & 2032
- Figure 24: Middle East & Africa US Recovery Drinks Industry Revenue (Million), by Distribution Channel 2024 & 2032
- Figure 25: Middle East & Africa US Recovery Drinks Industry Revenue Share (%), by Distribution Channel 2024 & 2032
- Figure 26: Middle East & Africa US Recovery Drinks Industry Revenue (Million), by Country 2024 & 2032
- Figure 27: Middle East & Africa US Recovery Drinks Industry Revenue Share (%), by Country 2024 & 2032
- Figure 28: Asia Pacific US Recovery Drinks Industry Revenue (Million), by Product Type 2024 & 2032
- Figure 29: Asia Pacific US Recovery Drinks Industry Revenue Share (%), by Product Type 2024 & 2032
- Figure 30: Asia Pacific US Recovery Drinks Industry Revenue (Million), by Distribution Channel 2024 & 2032
- Figure 31: Asia Pacific US Recovery Drinks Industry Revenue Share (%), by Distribution Channel 2024 & 2032
- Figure 32: Asia Pacific US Recovery Drinks Industry Revenue (Million), by Country 2024 & 2032
- Figure 33: Asia Pacific US Recovery Drinks Industry Revenue Share (%), by Country 2024 & 2032
List of Tables
- Table 1: Global US Recovery Drinks Industry Revenue Million Forecast, by Region 2019 & 2032
- Table 2: Global US Recovery Drinks Industry Revenue Million Forecast, by Product Type 2019 & 2032
- Table 3: Global US Recovery Drinks Industry Revenue Million Forecast, by Distribution Channel 2019 & 2032
- Table 4: Global US Recovery Drinks Industry Revenue Million Forecast, by Region 2019 & 2032
- Table 5: Global US Recovery Drinks Industry Revenue Million Forecast, by Country 2019 & 2032
- Table 6: Northeast US Recovery Drinks Industry Revenue (Million) Forecast, by Application 2019 & 2032
- Table 7: Southeast US Recovery Drinks Industry Revenue (Million) Forecast, by Application 2019 & 2032
- Table 8: Midwest US Recovery Drinks Industry Revenue (Million) Forecast, by Application 2019 & 2032
- Table 9: Southwest US Recovery Drinks Industry Revenue (Million) Forecast, by Application 2019 & 2032
- Table 10: West US Recovery Drinks Industry Revenue (Million) Forecast, by Application 2019 & 2032
- Table 11: Global US Recovery Drinks Industry Revenue Million Forecast, by Product Type 2019 & 2032
- Table 12: Global US Recovery Drinks Industry Revenue Million Forecast, by Distribution Channel 2019 & 2032
- Table 13: Global US Recovery Drinks Industry Revenue Million Forecast, by Country 2019 & 2032
- Table 14: United States US Recovery Drinks Industry Revenue (Million) Forecast, by Application 2019 & 2032
- Table 15: Canada US Recovery Drinks Industry Revenue (Million) Forecast, by Application 2019 & 2032
- Table 16: Mexico US Recovery Drinks Industry Revenue (Million) Forecast, by Application 2019 & 2032
- Table 17: Global US Recovery Drinks Industry Revenue Million Forecast, by Product Type 2019 & 2032
- Table 18: Global US Recovery Drinks Industry Revenue Million Forecast, by Distribution Channel 2019 & 2032
- Table 19: Global US Recovery Drinks Industry Revenue Million Forecast, by Country 2019 & 2032
- Table 20: Brazil US Recovery Drinks Industry Revenue (Million) Forecast, by Application 2019 & 2032
- Table 21: Argentina US Recovery Drinks Industry Revenue (Million) Forecast, by Application 2019 & 2032
- Table 22: Rest of South America US Recovery Drinks Industry Revenue (Million) Forecast, by Application 2019 & 2032
- Table 23: Global US Recovery Drinks Industry Revenue Million Forecast, by Product Type 2019 & 2032
- Table 24: Global US Recovery Drinks Industry Revenue Million Forecast, by Distribution Channel 2019 & 2032
- Table 25: Global US Recovery Drinks Industry Revenue Million Forecast, by Country 2019 & 2032
- Table 26: United Kingdom US Recovery Drinks Industry Revenue (Million) Forecast, by Application 2019 & 2032
- Table 27: Germany US Recovery Drinks Industry Revenue (Million) Forecast, by Application 2019 & 2032
- Table 28: France US Recovery Drinks Industry Revenue (Million) Forecast, by Application 2019 & 2032
- Table 29: Italy US Recovery Drinks Industry Revenue (Million) Forecast, by Application 2019 & 2032
- Table 30: Spain US Recovery Drinks Industry Revenue (Million) Forecast, by Application 2019 & 2032
- Table 31: Russia US Recovery Drinks Industry Revenue (Million) Forecast, by Application 2019 & 2032
- Table 32: Benelux US Recovery Drinks Industry Revenue (Million) Forecast, by Application 2019 & 2032
- Table 33: Nordics US Recovery Drinks Industry Revenue (Million) Forecast, by Application 2019 & 2032
- Table 34: Rest of Europe US Recovery Drinks Industry Revenue (Million) Forecast, by Application 2019 & 2032
- Table 35: Global US Recovery Drinks Industry Revenue Million Forecast, by Product Type 2019 & 2032
- Table 36: Global US Recovery Drinks Industry Revenue Million Forecast, by Distribution Channel 2019 & 2032
- Table 37: Global US Recovery Drinks Industry Revenue Million Forecast, by Country 2019 & 2032
- Table 38: Turkey US Recovery Drinks Industry Revenue (Million) Forecast, by Application 2019 & 2032
- Table 39: Israel US Recovery Drinks Industry Revenue (Million) Forecast, by Application 2019 & 2032
- Table 40: GCC US Recovery Drinks Industry Revenue (Million) Forecast, by Application 2019 & 2032
- Table 41: North Africa US Recovery Drinks Industry Revenue (Million) Forecast, by Application 2019 & 2032
- Table 42: South Africa US Recovery Drinks Industry Revenue (Million) Forecast, by Application 2019 & 2032
- Table 43: Rest of Middle East & Africa US Recovery Drinks Industry Revenue (Million) Forecast, by Application 2019 & 2032
- Table 44: Global US Recovery Drinks Industry Revenue Million Forecast, by Product Type 2019 & 2032
- Table 45: Global US Recovery Drinks Industry Revenue Million Forecast, by Distribution Channel 2019 & 2032
- Table 46: Global US Recovery Drinks Industry Revenue Million Forecast, by Country 2019 & 2032
- Table 47: China US Recovery Drinks Industry Revenue (Million) Forecast, by Application 2019 & 2032
- Table 48: India US Recovery Drinks Industry Revenue (Million) Forecast, by Application 2019 & 2032
- Table 49: Japan US Recovery Drinks Industry Revenue (Million) Forecast, by Application 2019 & 2032
- Table 50: South Korea US Recovery Drinks Industry Revenue (Million) Forecast, by Application 2019 & 2032
- Table 51: ASEAN US Recovery Drinks Industry Revenue (Million) Forecast, by Application 2019 & 2032
- Table 52: Oceania US Recovery Drinks Industry Revenue (Million) Forecast, by Application 2019 & 2032
- Table 53: Rest of Asia Pacific US Recovery Drinks Industry Revenue (Million) Forecast, by Application 2019 & 2032
Frequently Asked Questions
1. What is the projected Compound Annual Growth Rate (CAGR) of the US Recovery Drinks Industry?
The projected CAGR is approximately 5.72%.
2. Which companies are prominent players in the US Recovery Drinks Industry?
Key companies in the market include Nestle SA, Kill Cliff, Abbott Nutrition, PepsiCo Inc, Glanbia plc, Energy Lab Nutrition, Fluid Sports Nutrition*List Not Exhaustive, Danone SA.
3. What are the main segments of the US Recovery Drinks Industry?
The market segments include Product Type, Distribution Channel.
4. Can you provide details about the market size?
The market size is estimated to be USD XX Million as of 2022.
5. What are some drivers contributing to market growth?
Demand for specialty and organic coffee pods and capsules; Innovations in packaging formats.
6. What are the notable trends driving market growth?
Growing Physical Activity Participation Rate. Coupled With Marketing Campaigns.
7. Are there any restraints impacting market growth?
Availability of counterfeit products.
8. Can you provide examples of recent developments in the market?
N/A
9. What pricing options are available for accessing the report?
Pricing options include single-user, multi-user, and enterprise licenses priced at USD 3800, USD 4500, and USD 5800 respectively.
10. Is the market size provided in terms of value or volume?
The market size is provided in terms of value, measured in Million.
11. Are there any specific market keywords associated with the report?
Yes, the market keyword associated with the report is "US Recovery Drinks Industry," which aids in identifying and referencing the specific market segment covered.
12. How do I determine which pricing option suits my needs best?
The pricing options vary based on user requirements and access needs. Individual users may opt for single-user licenses, while businesses requiring broader access may choose multi-user or enterprise licenses for cost-effective access to the report.
13. Are there any additional resources or data provided in the US Recovery Drinks Industry report?
While the report offers comprehensive insights, it's advisable to review the specific contents or supplementary materials provided to ascertain if additional resources or data are available.
14. How can I stay updated on further developments or reports in the US Recovery Drinks Industry?
To stay informed about further developments, trends, and reports in the US Recovery Drinks Industry, consider subscribing to industry newsletters, following relevant companies and organizations, or regularly checking reputable industry news sources and publications.
Methodology
Step 1 - Identification of Relevant Samples Size from Population Database


Step 2 - Approaches for Defining Global Market Size (Value, Volume* & Price*)

Note*: In applicable scenarios
Step 3 - Data Sources
Primary Research
- Web Analytics
- Survey Reports
- Research Institute
- Latest Research Reports
- Opinion Leaders
Secondary Research
- Annual Reports
- White Paper
- Latest Press Release
- Industry Association
- Paid Database
- Investor Presentations

Step 4 - Data Triangulation
Involves using different sources of information in order to increase the validity of a study
These sources are likely to be stakeholders in a program - participants, other researchers, program staff, other community members, and so on.
Then we put all data in single framework & apply various statistical tools to find out the dynamic on the market.
During the analysis stage, feedback from the stakeholder groups would be compared to determine areas of agreement as well as areas of divergence
