

Key Insights
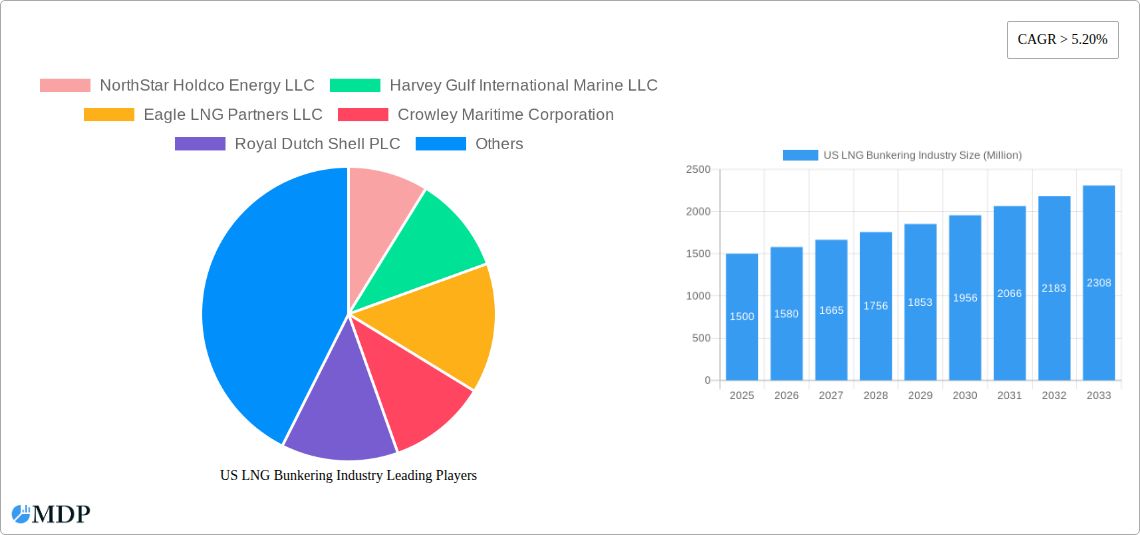
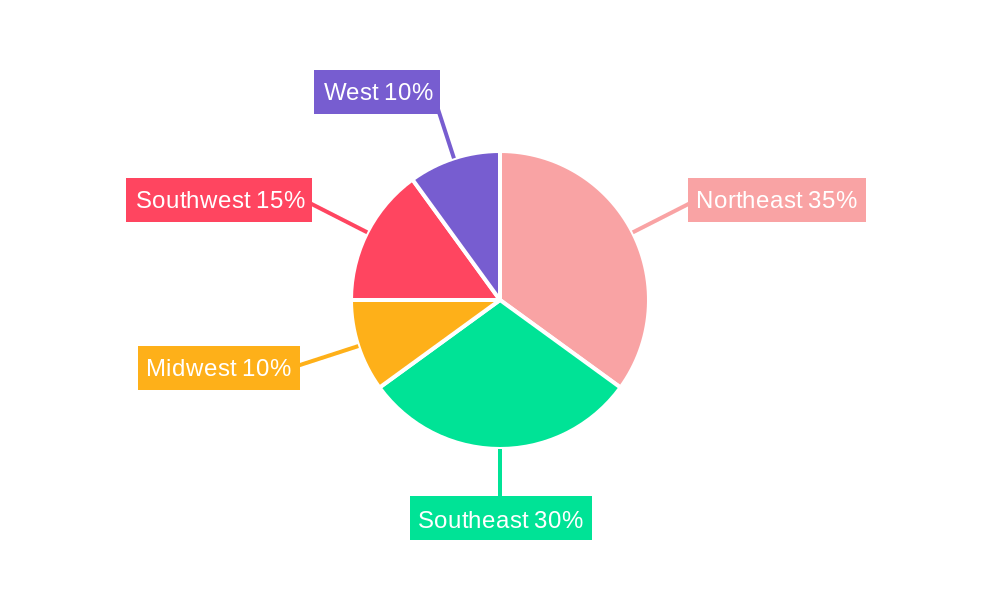
The US LNG bunkering market, currently experiencing robust growth with a CAGR exceeding 5.20%, presents a significant opportunity for investors and industry players. Driven by increasing environmental regulations aimed at reducing greenhouse gas emissions from maritime transport, the demand for cleaner-burning LNG as a marine fuel is soaring. The transition from traditional heavy fuel oils is further accelerated by the expanding LNG infrastructure in key US ports, particularly along the coasts, catering to the needs of diverse vessel types. Major end-users include tanker fleets, container ships, bulk carriers, ferries, and offshore support vessels (OSVs), all seeking to comply with stricter emission standards and improve their operational efficiency. The market's growth is also propelled by technological advancements in LNG bunkering infrastructure and the increasing availability of LNG as a fuel source. However, the high initial investment cost associated with LNG bunkering infrastructure and the relatively higher price of LNG compared to traditional fuels pose challenges. The Northeast and Southeast regions, with their significant port activity and proximity to LNG production facilities, currently dominate the market, but growth is anticipated across all US regions as infrastructure expands. Key players like NorthStar Holdco Energy LLC, Harvey Gulf International Marine LLC, and Crowley Maritime Corporation are actively shaping the market landscape through strategic investments and operational expansions.
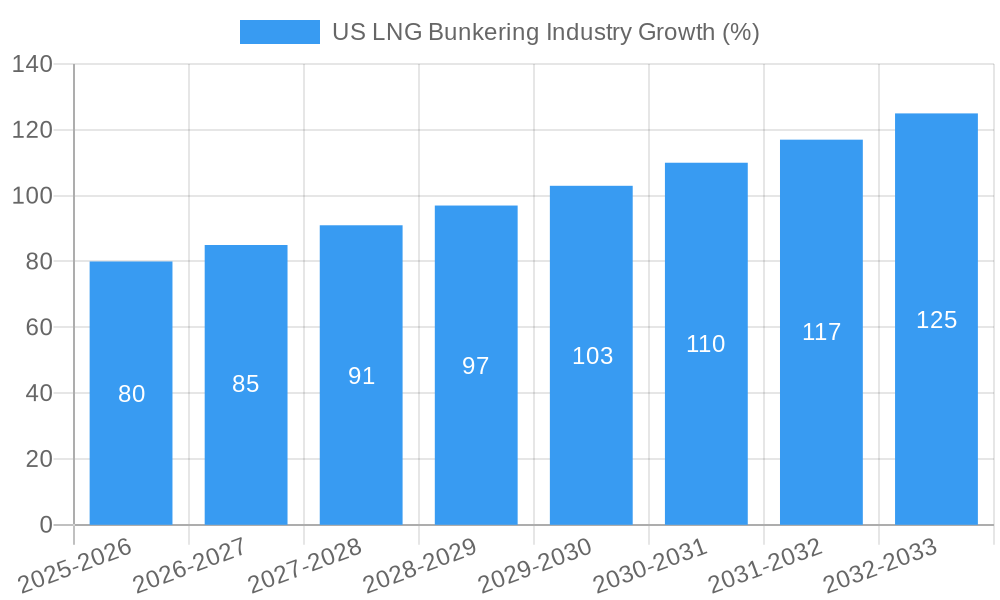
The forecast period (2025-2033) promises continued expansion, fueled by government incentives, increasing awareness of environmental sustainability within the shipping industry, and the ongoing development of new LNG bunkering terminals. While challenges remain, including the need for wider adoption and the development of robust regulatory frameworks, the long-term outlook for the US LNG bunkering market remains positive. The market’s segmentation by end-user allows for targeted investment strategies, particularly within the rapidly growing container fleet and tanker fleet segments. The strategic location of LNG bunkering facilities will continue to play a crucial role in determining market share and profitability for companies involved in the supply and delivery of LNG fuel. Effective risk management strategies, coupled with technological innovations to address the challenges of LNG bunkering, will be essential for maximizing market penetration and ensuring sustained growth in the years to come.
Unlock the Potential: A Comprehensive Analysis of the US LNG Bunkering Industry (2019-2033)
This in-depth report provides a comprehensive analysis of the burgeoning US LNG bunkering industry, offering invaluable insights for industry stakeholders, investors, and strategic decision-makers. The study covers the period 2019-2033, with a focus on the base year 2025 and a forecast period spanning 2025-2033. Expect detailed analysis of market dynamics, leading players, emerging opportunities, and challenges impacting this rapidly evolving sector. The total market size is projected to reach xx Million by 2033, exhibiting a CAGR of xx% during the forecast period.
US LNG Bunkering Industry Market Dynamics & Concentration
The US LNG bunkering market is characterized by a dynamic interplay of factors driving both growth and concentration. Market share is currently fragmented, with no single dominant player. However, consolidation is expected as larger players, including Royal Dutch Shell PLC, acquire smaller entities and expand their infrastructure. The market is witnessing significant innovation in bunkering technologies, including the development of more efficient and environmentally friendly LNG bunkering vessels. Regulatory frameworks, primarily focused on environmental protection and safety, significantly impact market operations. The increasing adoption of stricter emission standards is pushing the transition towards cleaner fuels like LNG. Substitute fuels like methanol and ammonia are emerging but currently hold a small market share. The continuous expansion of the tanker fleet, primarily driven by global trade, constitutes a key market driver, while M&A activity remains a significant factor shaping market concentration. Over the historical period (2019-2024), we observed xx M&A deals, primarily focused on port infrastructure acquisitions and fleet expansion. The market share of the top 5 players in 2025 is estimated at xx%.
- Market Concentration: Moderately fragmented, with increasing consolidation.
- Innovation Drivers: Technological advancements in bunkering technology and vessel design.
- Regulatory Frameworks: Stringent environmental regulations driving adoption of LNG.
- Product Substitutes: Emerging alternative fuels, but limited market penetration currently.
- End-User Trends: Growing demand driven by the expansion of the global shipping industry.
- M&A Activity: Significant consolidation anticipated, with xx M&A deals projected during the forecast period.
US LNG Bunkering Industry Industry Trends & Analysis
The US LNG bunkering market is experiencing robust growth, primarily fueled by stringent environmental regulations, the increasing size of the global shipping fleet, and the rising adoption of LNG as a cleaner alternative to traditional marine fuels. Technological advancements, particularly in the development of more efficient and safer LNG bunkering technologies, are contributing significantly to this growth. Consumer preferences are shifting towards environmentally responsible shipping practices, further fueling the demand for LNG bunkering. Competitive dynamics are intense, with established players and new entrants vying for market share through strategic partnerships, infrastructure development, and technological innovation. The market penetration of LNG in the US bunkering sector is expected to reach xx% by 2033, driven by government incentives and the growing awareness of environmental concerns.
Leading Markets & Segments in US LNG Bunkering Industry
The US LNG bunkering market exhibits regional variations in growth and adoption rates. The Gulf Coast, particularly ports in Texas and Louisiana, is currently the leading region, driven by the existence of substantial LNG production and import facilities, as well as the concentration of major shipping lanes.
Tanker Fleet: This segment holds the largest market share due to the substantial LNG volumes transported globally and a growing demand for cleaner fuels.
Key Drivers for the Tanker Fleet Segment:
- Government incentives and regulations favoring LNG adoption.
- Existing LNG infrastructure supporting bunkering operations.
- High fuel efficiency and reduced emissions compared to traditional fuels.
Container Fleet: This segment shows moderate growth, as LNG bunkering becomes more accessible and cost-effective.
Key Drivers for the Container Fleet Segment:
- Increasing environmental awareness among shipping lines.
- Growing focus on reducing carbon footprint in container shipping.
Bulk and General Cargo Fleet: Growth is slower in this segment due to the higher initial investment required for LNG bunkering infrastructure.
Key Drivers for the Bulk and General Cargo Fleet Segment:
- Expanding availability of LNG bunkering infrastructure.
- Government policies encouraging LNG adoption in the bulk cargo sector.
Ferries and OSV: This segment demonstrates moderate growth, driven by regional regulations and a focus on cleaner fuels in coastal and inland waterways.
Key Drivers for the Ferries and OSV Segment:
- Stricter emission regulations in coastal and inland waterways.
- Growing awareness of environmental impact of ferry and OSV operations.
US LNG Bunkering Industry Product Developments
The US LNG bunkering industry is witnessing continuous product innovations, focusing on enhancing safety, efficiency, and environmental performance. This includes the development of advanced LNG bunkering vessels, improved storage and transfer technologies, and the integration of digital solutions for optimized operations. These innovations aim to address the challenges associated with LNG handling and storage, improving overall efficiency and reducing the environmental footprint of bunkering operations. The focus is on providing cost-effective and efficient solutions that meet the diverse needs of various shipping segments.
Key Drivers of US LNG Bunkering Industry Growth
The growth of the US LNG bunkering industry is propelled by a confluence of factors. Stringent environmental regulations mandating the reduction of greenhouse gas emissions from shipping are a primary driver. The increasing availability of LNG as a cleaner fuel source, coupled with government incentives and subsidies, further accelerates market adoption. Technological advancements leading to safer and more efficient LNG bunkering technologies are lowering the barriers to entry for both ship owners and bunkering providers. Lastly, the growth of the global shipping industry and the associated increase in cargo volume continuously expand the market for LNG bunkering services.
Challenges in the US LNG Bunkering Industry Market
The US LNG bunkering market faces several challenges. The high initial investment required for LNG bunkering infrastructure presents a significant barrier to entry for smaller players. The complex regulatory landscape and varying safety standards across different ports can create operational difficulties. Supply chain disruptions, including the availability and cost of LNG, can also impact market dynamics. Furthermore, competition from other alternative fuels and the need for skilled workforce further add complexity. These challenges, if not addressed effectively, could impede the growth of this important sector.
Emerging Opportunities in US LNG Bunkering Industry
The long-term growth of the US LNG bunkering market is poised for significant expansion. Technological breakthroughs in LNG bunkering technologies promise further cost reductions and efficiency gains. Strategic partnerships between LNG producers, ship owners, and bunkering providers will streamline operations and facilitate market expansion. Increased investments in LNG bunkering infrastructure and the development of new bunkering hubs will create new opportunities. Furthermore, exploring and adopting carbon-capture technologies can further enhance the sustainability appeal of LNG as a marine fuel.
Leading Players in the US LNG Bunkering Industry Sector
- NorthStar Holdco Energy LLC
- Harvey Gulf International Marine LLC
- Eagle LNG Partners LLC
- Crowley Maritime Corporation
- Royal Dutch Shell PLC
- Conrad Shipyards LLC
- JAX LNG LLC
Key Milestones in US LNG Bunkering Industry Industry
- 2020: Implementation of stricter emission regulations for ships calling at US ports.
- 2021: Launch of the first dedicated LNG bunkering vessel on the US Gulf Coast.
- 2022: Several major shipping lines announce their commitment to using LNG as a fuel.
- 2023: Increased investment in LNG bunkering infrastructure at key US ports.
- 2024: Announced partnerships between LNG producers and bunkering companies.
Strategic Outlook for US LNG Bunkering Industry Market
The future of the US LNG bunkering market is bright, with significant growth potential driven by environmental regulations, technological advancements, and increasing demand for cleaner fuels in the maritime sector. Strategic partnerships and investments in infrastructure will play a crucial role in shaping the industry's future. The focus on technological innovation, particularly in areas such as carbon capture and utilization, will further enhance the sustainability of LNG as a marine fuel, ensuring a long-term positive outlook for the market.
US LNG Bunkering Industry Segmentation
-
1. End-User
- 1.1. Tanker Fleet
- 1.2. Container Fleet
- 1.3. Bulk and General Cargo Fleet
- 1.4. Ferries and OSV
- 1.5. Others
US LNG Bunkering Industry Segmentation By Geography
-
1. North America
- 1.1. United States
- 1.2. Canada
- 1.3. Mexico
-
2. South America
- 2.1. Brazil
- 2.2. Argentina
- 2.3. Rest of South America
-
3. Europe
- 3.1. United Kingdom
- 3.2. Germany
- 3.3. France
- 3.4. Italy
- 3.5. Spain
- 3.6. Russia
- 3.7. Benelux
- 3.8. Nordics
- 3.9. Rest of Europe
-
4. Middle East & Africa
- 4.1. Turkey
- 4.2. Israel
- 4.3. GCC
- 4.4. North Africa
- 4.5. South Africa
- 4.6. Rest of Middle East & Africa
-
5. Asia Pacific
- 5.1. China
- 5.2. India
- 5.3. Japan
- 5.4. South Korea
- 5.5. ASEAN
- 5.6. Oceania
- 5.7. Rest of Asia Pacific
US LNG Bunkering Industry REPORT HIGHLIGHTS
| Aspects | Details |
|---|---|
| Study Period | 2019-2033 |
| Base Year | 2024 |
| Estimated Year | 2025 |
| Forecast Period | 2025-2033 |
| Historical Period | 2019-2024 |
| Growth Rate | CAGR of > 5.20% from 2019-2033 |
| Segmentation |
|
Table of Contents
- 1. Introduction
- 1.1. Research Scope
- 1.2. Market Segmentation
- 1.3. Research Methodology
- 1.4. Definitions and Assumptions
- 2. Executive Summary
- 2.1. Introduction
- 3. Market Dynamics
- 3.1. Introduction
- 3.2. Market Drivers
- 3.2.1. 4.; Increasing Production from Unconventional Sources4.; Growing Energy Demand in the Region
- 3.3. Market Restrains
- 3.3.1. 4.; Environmental Concerns
- 3.4. Market Trends
- 3.4.1. Container Fleet is Expected to Dominate in the Market
- 4. Market Factor Analysis
- 4.1. Porters Five Forces
- 4.2. Supply/Value Chain
- 4.3. PESTEL analysis
- 4.4. Market Entropy
- 4.5. Patent/Trademark Analysis
- 5. Global US LNG Bunkering Industry Analysis, Insights and Forecast, 2019-2031
- 5.1. Market Analysis, Insights and Forecast - by End-User
- 5.1.1. Tanker Fleet
- 5.1.2. Container Fleet
- 5.1.3. Bulk and General Cargo Fleet
- 5.1.4. Ferries and OSV
- 5.1.5. Others
- 5.2. Market Analysis, Insights and Forecast - by Region
- 5.2.1. North America
- 5.2.2. South America
- 5.2.3. Europe
- 5.2.4. Middle East & Africa
- 5.2.5. Asia Pacific
- 5.1. Market Analysis, Insights and Forecast - by End-User
- 6. North America US LNG Bunkering Industry Analysis, Insights and Forecast, 2019-2031
- 6.1. Market Analysis, Insights and Forecast - by End-User
- 6.1.1. Tanker Fleet
- 6.1.2. Container Fleet
- 6.1.3. Bulk and General Cargo Fleet
- 6.1.4. Ferries and OSV
- 6.1.5. Others
- 6.1. Market Analysis, Insights and Forecast - by End-User
- 7. South America US LNG Bunkering Industry Analysis, Insights and Forecast, 2019-2031
- 7.1. Market Analysis, Insights and Forecast - by End-User
- 7.1.1. Tanker Fleet
- 7.1.2. Container Fleet
- 7.1.3. Bulk and General Cargo Fleet
- 7.1.4. Ferries and OSV
- 7.1.5. Others
- 7.1. Market Analysis, Insights and Forecast - by End-User
- 8. Europe US LNG Bunkering Industry Analysis, Insights and Forecast, 2019-2031
- 8.1. Market Analysis, Insights and Forecast - by End-User
- 8.1.1. Tanker Fleet
- 8.1.2. Container Fleet
- 8.1.3. Bulk and General Cargo Fleet
- 8.1.4. Ferries and OSV
- 8.1.5. Others
- 8.1. Market Analysis, Insights and Forecast - by End-User
- 9. Middle East & Africa US LNG Bunkering Industry Analysis, Insights and Forecast, 2019-2031
- 9.1. Market Analysis, Insights and Forecast - by End-User
- 9.1.1. Tanker Fleet
- 9.1.2. Container Fleet
- 9.1.3. Bulk and General Cargo Fleet
- 9.1.4. Ferries and OSV
- 9.1.5. Others
- 9.1. Market Analysis, Insights and Forecast - by End-User
- 10. Asia Pacific US LNG Bunkering Industry Analysis, Insights and Forecast, 2019-2031
- 10.1. Market Analysis, Insights and Forecast - by End-User
- 10.1.1. Tanker Fleet
- 10.1.2. Container Fleet
- 10.1.3. Bulk and General Cargo Fleet
- 10.1.4. Ferries and OSV
- 10.1.5. Others
- 10.1. Market Analysis, Insights and Forecast - by End-User
- 11. Northeast US LNG Bunkering Industry Analysis, Insights and Forecast, 2019-2031
- 12. Southeast US LNG Bunkering Industry Analysis, Insights and Forecast, 2019-2031
- 13. Midwest US LNG Bunkering Industry Analysis, Insights and Forecast, 2019-2031
- 14. Southwest US LNG Bunkering Industry Analysis, Insights and Forecast, 2019-2031
- 15. West US LNG Bunkering Industry Analysis, Insights and Forecast, 2019-2031
- 16. Competitive Analysis
- 16.1. Global Market Share Analysis 2024
- 16.2. Company Profiles
- 16.2.1 NorthStar Holdco Energy LLC
- 16.2.1.1. Overview
- 16.2.1.2. Products
- 16.2.1.3. SWOT Analysis
- 16.2.1.4. Recent Developments
- 16.2.1.5. Financials (Based on Availability)
- 16.2.2 Harvey Gulf International Marine LLC
- 16.2.2.1. Overview
- 16.2.2.2. Products
- 16.2.2.3. SWOT Analysis
- 16.2.2.4. Recent Developments
- 16.2.2.5. Financials (Based on Availability)
- 16.2.3 Eagle LNG Partners LLC
- 16.2.3.1. Overview
- 16.2.3.2. Products
- 16.2.3.3. SWOT Analysis
- 16.2.3.4. Recent Developments
- 16.2.3.5. Financials (Based on Availability)
- 16.2.4 Crowley Maritime Corporation
- 16.2.4.1. Overview
- 16.2.4.2. Products
- 16.2.4.3. SWOT Analysis
- 16.2.4.4. Recent Developments
- 16.2.4.5. Financials (Based on Availability)
- 16.2.5 Royal Dutch Shell PLC
- 16.2.5.1. Overview
- 16.2.5.2. Products
- 16.2.5.3. SWOT Analysis
- 16.2.5.4. Recent Developments
- 16.2.5.5. Financials (Based on Availability)
- 16.2.6 Conrad Shipyards LLC
- 16.2.6.1. Overview
- 16.2.6.2. Products
- 16.2.6.3. SWOT Analysis
- 16.2.6.4. Recent Developments
- 16.2.6.5. Financials (Based on Availability)
- 16.2.7 JAX LNG LLC
- 16.2.7.1. Overview
- 16.2.7.2. Products
- 16.2.7.3. SWOT Analysis
- 16.2.7.4. Recent Developments
- 16.2.7.5. Financials (Based on Availability)
- 16.2.1 NorthStar Holdco Energy LLC
List of Figures
- Figure 1: Global US LNG Bunkering Industry Revenue Breakdown (Million, %) by Region 2024 & 2032
- Figure 2: United states US LNG Bunkering Industry Revenue (Million), by Country 2024 & 2032
- Figure 3: United states US LNG Bunkering Industry Revenue Share (%), by Country 2024 & 2032
- Figure 4: North America US LNG Bunkering Industry Revenue (Million), by End-User 2024 & 2032
- Figure 5: North America US LNG Bunkering Industry Revenue Share (%), by End-User 2024 & 2032
- Figure 6: North America US LNG Bunkering Industry Revenue (Million), by Country 2024 & 2032
- Figure 7: North America US LNG Bunkering Industry Revenue Share (%), by Country 2024 & 2032
- Figure 8: South America US LNG Bunkering Industry Revenue (Million), by End-User 2024 & 2032
- Figure 9: South America US LNG Bunkering Industry Revenue Share (%), by End-User 2024 & 2032
- Figure 10: South America US LNG Bunkering Industry Revenue (Million), by Country 2024 & 2032
- Figure 11: South America US LNG Bunkering Industry Revenue Share (%), by Country 2024 & 2032
- Figure 12: Europe US LNG Bunkering Industry Revenue (Million), by End-User 2024 & 2032
- Figure 13: Europe US LNG Bunkering Industry Revenue Share (%), by End-User 2024 & 2032
- Figure 14: Europe US LNG Bunkering Industry Revenue (Million), by Country 2024 & 2032
- Figure 15: Europe US LNG Bunkering Industry Revenue Share (%), by Country 2024 & 2032
- Figure 16: Middle East & Africa US LNG Bunkering Industry Revenue (Million), by End-User 2024 & 2032
- Figure 17: Middle East & Africa US LNG Bunkering Industry Revenue Share (%), by End-User 2024 & 2032
- Figure 18: Middle East & Africa US LNG Bunkering Industry Revenue (Million), by Country 2024 & 2032
- Figure 19: Middle East & Africa US LNG Bunkering Industry Revenue Share (%), by Country 2024 & 2032
- Figure 20: Asia Pacific US LNG Bunkering Industry Revenue (Million), by End-User 2024 & 2032
- Figure 21: Asia Pacific US LNG Bunkering Industry Revenue Share (%), by End-User 2024 & 2032
- Figure 22: Asia Pacific US LNG Bunkering Industry Revenue (Million), by Country 2024 & 2032
- Figure 23: Asia Pacific US LNG Bunkering Industry Revenue Share (%), by Country 2024 & 2032
List of Tables
- Table 1: Global US LNG Bunkering Industry Revenue Million Forecast, by Region 2019 & 2032
- Table 2: Global US LNG Bunkering Industry Revenue Million Forecast, by End-User 2019 & 2032
- Table 3: Global US LNG Bunkering Industry Revenue Million Forecast, by Region 2019 & 2032
- Table 4: Global US LNG Bunkering Industry Revenue Million Forecast, by Country 2019 & 2032
- Table 5: Northeast US LNG Bunkering Industry Revenue (Million) Forecast, by Application 2019 & 2032
- Table 6: Southeast US LNG Bunkering Industry Revenue (Million) Forecast, by Application 2019 & 2032
- Table 7: Midwest US LNG Bunkering Industry Revenue (Million) Forecast, by Application 2019 & 2032
- Table 8: Southwest US LNG Bunkering Industry Revenue (Million) Forecast, by Application 2019 & 2032
- Table 9: West US LNG Bunkering Industry Revenue (Million) Forecast, by Application 2019 & 2032
- Table 10: Global US LNG Bunkering Industry Revenue Million Forecast, by End-User 2019 & 2032
- Table 11: Global US LNG Bunkering Industry Revenue Million Forecast, by Country 2019 & 2032
- Table 12: United States US LNG Bunkering Industry Revenue (Million) Forecast, by Application 2019 & 2032
- Table 13: Canada US LNG Bunkering Industry Revenue (Million) Forecast, by Application 2019 & 2032
- Table 14: Mexico US LNG Bunkering Industry Revenue (Million) Forecast, by Application 2019 & 2032
- Table 15: Global US LNG Bunkering Industry Revenue Million Forecast, by End-User 2019 & 2032
- Table 16: Global US LNG Bunkering Industry Revenue Million Forecast, by Country 2019 & 2032
- Table 17: Brazil US LNG Bunkering Industry Revenue (Million) Forecast, by Application 2019 & 2032
- Table 18: Argentina US LNG Bunkering Industry Revenue (Million) Forecast, by Application 2019 & 2032
- Table 19: Rest of South America US LNG Bunkering Industry Revenue (Million) Forecast, by Application 2019 & 2032
- Table 20: Global US LNG Bunkering Industry Revenue Million Forecast, by End-User 2019 & 2032
- Table 21: Global US LNG Bunkering Industry Revenue Million Forecast, by Country 2019 & 2032
- Table 22: United Kingdom US LNG Bunkering Industry Revenue (Million) Forecast, by Application 2019 & 2032
- Table 23: Germany US LNG Bunkering Industry Revenue (Million) Forecast, by Application 2019 & 2032
- Table 24: France US LNG Bunkering Industry Revenue (Million) Forecast, by Application 2019 & 2032
- Table 25: Italy US LNG Bunkering Industry Revenue (Million) Forecast, by Application 2019 & 2032
- Table 26: Spain US LNG Bunkering Industry Revenue (Million) Forecast, by Application 2019 & 2032
- Table 27: Russia US LNG Bunkering Industry Revenue (Million) Forecast, by Application 2019 & 2032
- Table 28: Benelux US LNG Bunkering Industry Revenue (Million) Forecast, by Application 2019 & 2032
- Table 29: Nordics US LNG Bunkering Industry Revenue (Million) Forecast, by Application 2019 & 2032
- Table 30: Rest of Europe US LNG Bunkering Industry Revenue (Million) Forecast, by Application 2019 & 2032
- Table 31: Global US LNG Bunkering Industry Revenue Million Forecast, by End-User 2019 & 2032
- Table 32: Global US LNG Bunkering Industry Revenue Million Forecast, by Country 2019 & 2032
- Table 33: Turkey US LNG Bunkering Industry Revenue (Million) Forecast, by Application 2019 & 2032
- Table 34: Israel US LNG Bunkering Industry Revenue (Million) Forecast, by Application 2019 & 2032
- Table 35: GCC US LNG Bunkering Industry Revenue (Million) Forecast, by Application 2019 & 2032
- Table 36: North Africa US LNG Bunkering Industry Revenue (Million) Forecast, by Application 2019 & 2032
- Table 37: South Africa US LNG Bunkering Industry Revenue (Million) Forecast, by Application 2019 & 2032
- Table 38: Rest of Middle East & Africa US LNG Bunkering Industry Revenue (Million) Forecast, by Application 2019 & 2032
- Table 39: Global US LNG Bunkering Industry Revenue Million Forecast, by End-User 2019 & 2032
- Table 40: Global US LNG Bunkering Industry Revenue Million Forecast, by Country 2019 & 2032
- Table 41: China US LNG Bunkering Industry Revenue (Million) Forecast, by Application 2019 & 2032
- Table 42: India US LNG Bunkering Industry Revenue (Million) Forecast, by Application 2019 & 2032
- Table 43: Japan US LNG Bunkering Industry Revenue (Million) Forecast, by Application 2019 & 2032
- Table 44: South Korea US LNG Bunkering Industry Revenue (Million) Forecast, by Application 2019 & 2032
- Table 45: ASEAN US LNG Bunkering Industry Revenue (Million) Forecast, by Application 2019 & 2032
- Table 46: Oceania US LNG Bunkering Industry Revenue (Million) Forecast, by Application 2019 & 2032
- Table 47: Rest of Asia Pacific US LNG Bunkering Industry Revenue (Million) Forecast, by Application 2019 & 2032
Frequently Asked Questions
1. What is the projected Compound Annual Growth Rate (CAGR) of the US LNG Bunkering Industry?
The projected CAGR is approximately > 5.20%.
2. Which companies are prominent players in the US LNG Bunkering Industry?
Key companies in the market include NorthStar Holdco Energy LLC, Harvey Gulf International Marine LLC, Eagle LNG Partners LLC, Crowley Maritime Corporation, Royal Dutch Shell PLC, Conrad Shipyards LLC, JAX LNG LLC.
3. What are the main segments of the US LNG Bunkering Industry?
The market segments include End-User.
4. Can you provide details about the market size?
The market size is estimated to be USD XX Million as of 2022.
5. What are some drivers contributing to market growth?
4.; Increasing Production from Unconventional Sources4.; Growing Energy Demand in the Region.
6. What are the notable trends driving market growth?
Container Fleet is Expected to Dominate in the Market.
7. Are there any restraints impacting market growth?
4.; Environmental Concerns.
8. Can you provide examples of recent developments in the market?
N/A
9. What pricing options are available for accessing the report?
Pricing options include single-user, multi-user, and enterprise licenses priced at USD 3800, USD 4500, and USD 5800 respectively.
10. Is the market size provided in terms of value or volume?
The market size is provided in terms of value, measured in Million.
11. Are there any specific market keywords associated with the report?
Yes, the market keyword associated with the report is "US LNG Bunkering Industry," which aids in identifying and referencing the specific market segment covered.
12. How do I determine which pricing option suits my needs best?
The pricing options vary based on user requirements and access needs. Individual users may opt for single-user licenses, while businesses requiring broader access may choose multi-user or enterprise licenses for cost-effective access to the report.
13. Are there any additional resources or data provided in the US LNG Bunkering Industry report?
While the report offers comprehensive insights, it's advisable to review the specific contents or supplementary materials provided to ascertain if additional resources or data are available.
14. How can I stay updated on further developments or reports in the US LNG Bunkering Industry?
To stay informed about further developments, trends, and reports in the US LNG Bunkering Industry, consider subscribing to industry newsletters, following relevant companies and organizations, or regularly checking reputable industry news sources and publications.
Methodology
Step 1 - Identification of Relevant Samples Size from Population Database


Step 2 - Approaches for Defining Global Market Size (Value, Volume* & Price*)

Note*: In applicable scenarios
Step 3 - Data Sources
Primary Research
- Web Analytics
- Survey Reports
- Research Institute
- Latest Research Reports
- Opinion Leaders
Secondary Research
- Annual Reports
- White Paper
- Latest Press Release
- Industry Association
- Paid Database
- Investor Presentations

Step 4 - Data Triangulation
Involves using different sources of information in order to increase the validity of a study
These sources are likely to be stakeholders in a program - participants, other researchers, program staff, other community members, and so on.
Then we put all data in single framework & apply various statistical tools to find out the dynamic on the market.
During the analysis stage, feedback from the stakeholder groups would be compared to determine areas of agreement as well as areas of divergence
