

Key Insights
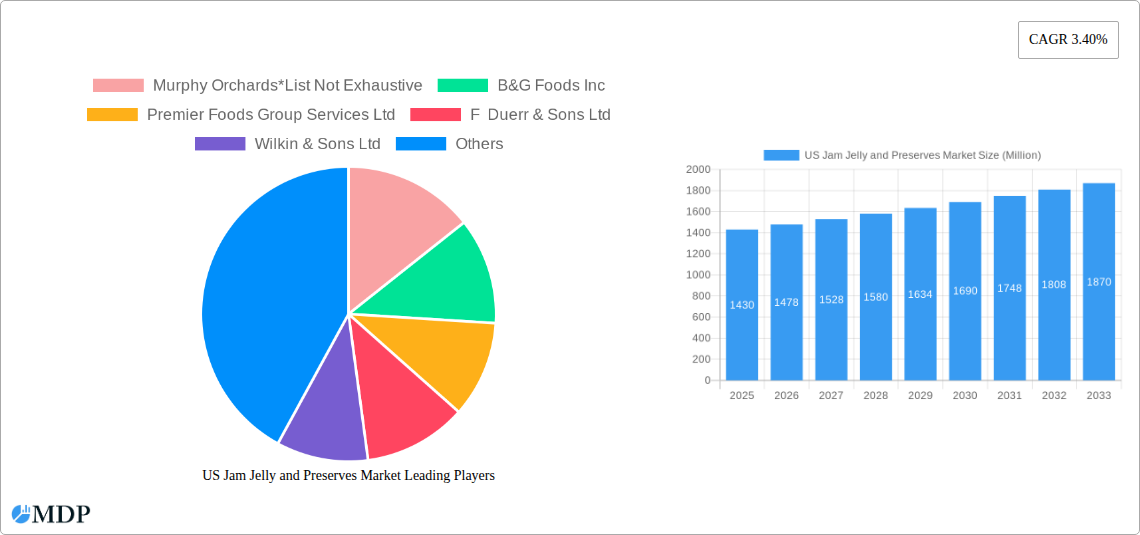
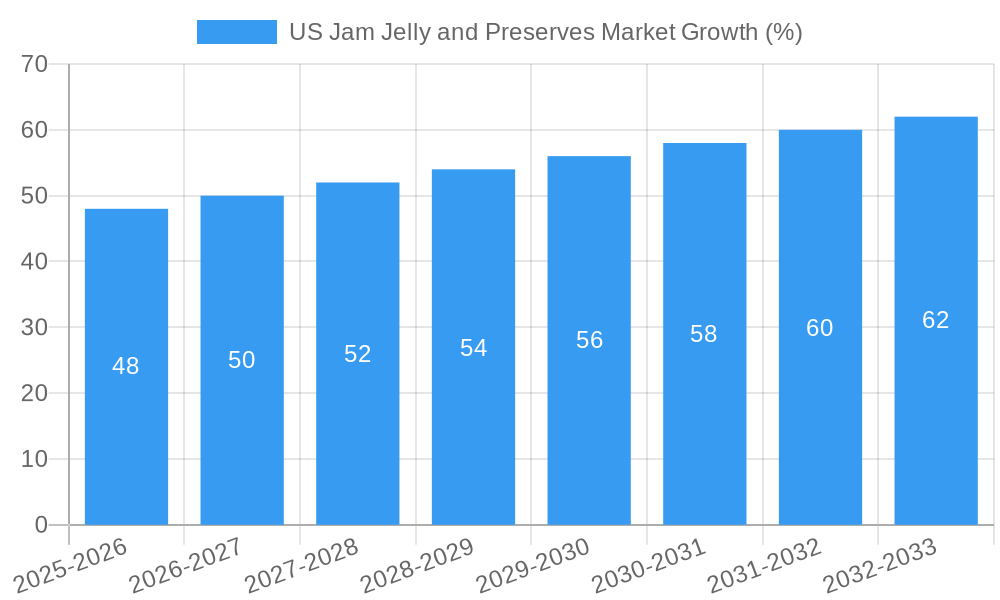
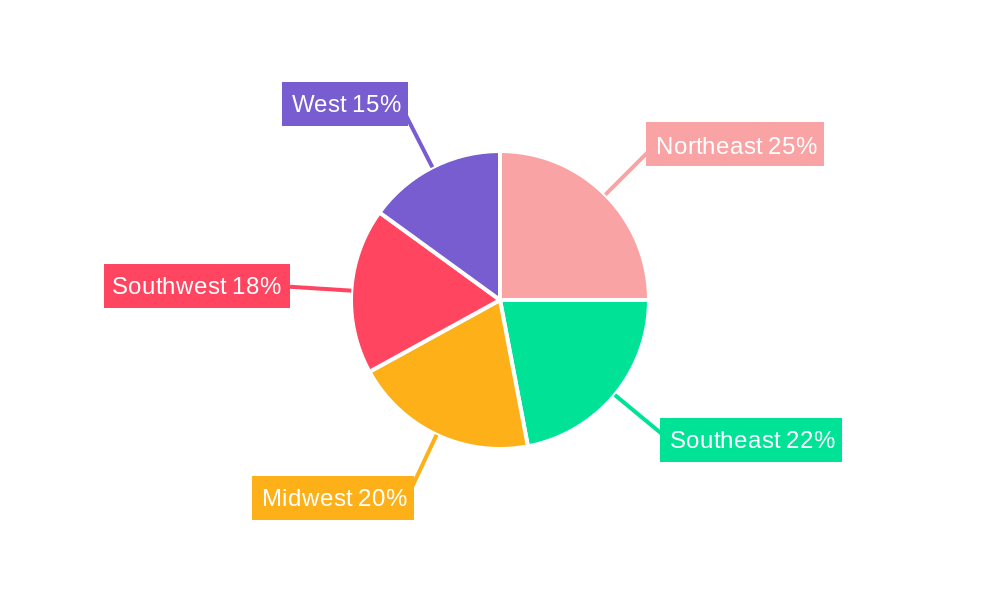
The US jam, jelly, and preserves market, valued at $1430 million in 2025, is projected to experience steady growth, driven by increasing consumer demand for convenient breakfast options and versatile culinary ingredients. The market's Compound Annual Growth Rate (CAGR) of 3.40% from 2025 to 2033 indicates a consistent expansion, fueled by rising health consciousness, with a focus on natural and organic products, and the increasing popularity of gourmet and artisanal jams and preserves. Supermarkets and hypermarkets remain the dominant distribution channel, but online sales are experiencing significant growth, reflecting changing consumer shopping habits and the convenience offered by e-commerce platforms. The market segmentation reveals a strong preference for jams and jellies, followed by marmalades and preserves, suggesting consumer preferences for specific flavor profiles and textures. Competitive pressures are evident with established players like J.M. Smucker, Kraft Heinz, and Conagra Foods Inc. alongside smaller, regional brands focusing on niche markets. The regional distribution shows varied consumption patterns across the United States, with the Northeast, West, and Southeast likely to be leading consumers, reflecting population density and regional culinary trends.
The projected growth in the US jam, jelly, and preserves market is influenced by several factors. Increased disposable incomes, especially in urban areas, allow consumers to spend more on premium and specialized products. Furthermore, the burgeoning foodservice sector (restaurants, cafes) contributes to higher demand, particularly for specialty jams and preserves used as ingredients or garnishes. However, potential restraints include fluctuating fruit prices, impacting production costs and profitability. Additionally, increasing health concerns related to sugar content might lead some consumers to seek healthier alternatives or reduced sugar options, thereby requiring manufacturers to adapt their product offerings. The industry's future success hinges on innovation, offering healthier options (e.g., reduced-sugar, organic variants), embracing sustainable sourcing practices, and strategically leveraging online channels to reach a wider consumer base.
US Jam, Jelly, and Preserves Market: A Comprehensive Report (2019-2033)
This comprehensive report provides a detailed analysis of the US jam, jelly, and preserves market, offering invaluable insights for industry stakeholders, investors, and strategic decision-makers. With a study period spanning 2019-2033, a base year of 2025, and a forecast period from 2025-2033, this report delivers a clear picture of market dynamics, trends, and future projections. The report leverages extensive data analysis and expert insights to unveil significant growth opportunities within this dynamic sector. The market size is predicted to reach xx Million by 2033.
US Jam, Jelly, and Preserves Market Market Dynamics & Concentration
This section analyzes the competitive landscape, innovation drivers, regulatory influences, and market trends within the US jam, jelly, and preserves industry. The market exhibits a moderately concentrated structure, with key players holding significant market share. However, the presence of numerous smaller, regional brands contributes to a dynamic competitive landscape.
Market Concentration: The top 5 players account for approximately xx% of the total market share in 2025. The remaining share is distributed among a multitude of regional and smaller national brands. This indicates both opportunities for growth for established players and for niche players to carve out their market positions.
Innovation Drivers: Consumer demand for healthier, more natural options is a major driver of innovation. This has led to a rise in organic, low-sugar, and specialty jams and preserves. Technological advancements in processing and packaging are also contributing factors.
Regulatory Framework: FDA regulations regarding labeling, food safety, and ingredient sourcing significantly impact market operations. Compliance is crucial for all market participants.
Product Substitutes: Alternative spreads, such as nut butters and fruit spreads made from alternative sweeteners are emerging as significant substitutes.
End-User Trends: Consumers are increasingly seeking convenient, versatile, and premium products, influencing product development and distribution strategies.
M&A Activities: The number of M&A deals in the sector has averaged xx per year over the historical period (2019-2024), indicating consolidation trends among larger players.
US Jam, Jelly, and Preserves Market Industry Trends & Analysis
The US jam, jelly, and preserves market demonstrates consistent growth, driven by a variety of factors. The Compound Annual Growth Rate (CAGR) for the historical period (2019-2024) is estimated to be xx%, with projections indicating a CAGR of xx% during the forecast period (2025-2033). Market penetration in key segments is also expanding as consumer preferences evolve. This growth is further fueled by technological advancements in product development, evolving consumer tastes, and strategic partnerships fostering innovation. The increasing popularity of artisanal and gourmet jams and preserves, coupled with the burgeoning demand for convenient snacking options, further contributes to the upward trajectory. The market has experienced a notable shift in consumer preferences toward healthier options, resulting in an increased demand for products with low sugar content, organic ingredients, and unique flavor profiles. The impact of technological disruptions is increasingly being felt through optimized production processes and innovative packaging solutions. The competitive landscape remains highly dynamic, with both established players and emerging brands actively vying for market share. The focus is on product differentiation through unique flavor profiles, health-conscious ingredients, and sustainable packaging solutions.
Leading Markets & Segments in US Jam Jelly and Preserves Market
The supermarket/hypermarket channel remains the dominant distribution channel for jams, jellies, and preserves. This channel holds approximately xx% of the market share in 2025. The jam and jellies segment holds the largest market share by product type.
Dominant Segment: The Jam and Jellies segment demonstrates the highest market share, driven by wide consumer acceptance and availability.
Distribution Channel Analysis:
- Supermarket/Hypermarket: Wide reach, established supply chains, and bulk purchasing power contribute to its dominance.
- Convenience Stores: Growing importance due to convenience and impulse buying.
- Online Stores: Rapid growth driven by e-commerce expansion and increased online grocery shopping.
- Other Distribution Channels: Specialty stores, farmers' markets, and direct-to-consumer sales represent niche markets.
Key Drivers:
- Strong consumer demand for convenience and diverse flavor profiles.
- Robust retail infrastructure supporting wide product distribution.
- Rising disposable incomes in key target demographics.
US Jam Jelly and Preserves Market Product Developments
Recent product innovations have focused on catering to health-conscious consumers, with a surge in organic, low-sugar, and gluten-free options. Manufacturers are employing innovative packaging technologies to extend shelf life and enhance product appeal. Functional ingredients, such as probiotics and antioxidants, are being incorporated to boost nutritional value and appeal to specific health-conscious segments. This reflects the trend towards healthier and more convenient options in response to evolving consumer demands.
Key Drivers of US Jam Jelly and Preserves Market Growth
Several factors drive the market's growth trajectory. Health-conscious consumers are driving demand for low-sugar and organic products. Technological advancements in production and packaging lead to efficiency improvements and improved product quality. Government initiatives promoting domestic agriculture also contribute to market expansion. The rising preference for convenient and ready-to-eat options, especially among younger demographics, further contributes to market expansion.
Challenges in the US Jam Jelly and Preserves Market Market
Fluctuations in raw material prices, particularly fruit prices, pose a significant challenge to profitability. Intense competition from established players and emerging brands necessitates continuous innovation and strategic product development. Strict regulatory requirements regarding labeling and ingredient sourcing increase operational complexities and costs.
Emerging Opportunities in US Jam Jelly and Preserves Market
The rising popularity of functional foods and the growing demand for vegan and plant-based options create significant market opportunities. Strategic partnerships with food service providers and e-commerce platforms can significantly broaden market reach. Expansion into emerging regional markets and exploration of new flavor profiles provide further avenues for growth.
Leading Players in the US Jam Jelly and Preserves Market Sector
- Murphy Orchards *List Not Exhaustive
- B&G Foods Inc
- Premier Foods Group Services Ltd
- F Duerr & Sons Ltd
- Wilkin & Sons Ltd
- The Hain Celestial Group Inc
- National Grape Cooperative Association
- The J M Smucker Company
- The Kraft Heinz Company
- Andros Group
- Conagra Foods Inc
Key Milestones in US Jam Jelly and Preserves Market Industry
- February 2021: Good Good introduced three new keto-friendly, no added sugar jam flavors, showcasing a trend toward healthier options.
- September 2022: Kraft Heinz partnered with StartLife, accelerating innovation within their product portfolio and responding to consumer demand.
- January 2023: Conagra Brands launched Snack Pack Starburst All Pink Juicy Gels, highlighting innovative product development and leveraging established brand recognition.
Strategic Outlook for US Jam Jelly and Preserves Market Market
The US jam, jelly, and preserves market is poised for continued growth, driven by evolving consumer preferences and innovative product development. Strategic focus on health and wellness, sustainable sourcing, and expansion into new distribution channels will be crucial for long-term success. Companies that successfully adapt to shifting consumer demands and capitalize on emerging trends will be best positioned for market leadership.
US Jam Jelly and Preserves Market Segmentation
-
1. Product Type
- 1.1. Jam and Jellies
- 1.2. Marmalade
- 1.3. Preserves
-
2. Distribution Channel
- 2.1. Supermarket/Hypermarket
- 2.2. Convenience Store
- 2.3. Online Stores
- 2.4. Other Distribution Channels
US Jam Jelly and Preserves Market Segmentation By Geography
-
1. North America
- 1.1. United States
- 1.2. Canada
- 1.3. Mexico
-
2. South America
- 2.1. Brazil
- 2.2. Argentina
- 2.3. Rest of South America
-
3. Europe
- 3.1. United Kingdom
- 3.2. Germany
- 3.3. France
- 3.4. Italy
- 3.5. Spain
- 3.6. Russia
- 3.7. Benelux
- 3.8. Nordics
- 3.9. Rest of Europe
-
4. Middle East & Africa
- 4.1. Turkey
- 4.2. Israel
- 4.3. GCC
- 4.4. North Africa
- 4.5. South Africa
- 4.6. Rest of Middle East & Africa
-
5. Asia Pacific
- 5.1. China
- 5.2. India
- 5.3. Japan
- 5.4. South Korea
- 5.5. ASEAN
- 5.6. Oceania
- 5.7. Rest of Asia Pacific
US Jam Jelly and Preserves Market REPORT HIGHLIGHTS
| Aspects | Details |
|---|---|
| Study Period | 2019-2033 |
| Base Year | 2024 |
| Estimated Year | 2025 |
| Forecast Period | 2025-2033 |
| Historical Period | 2019-2024 |
| Growth Rate | CAGR of 3.40% from 2019-2033 |
| Segmentation |
|
Table of Contents
- 1. Introduction
- 1.1. Research Scope
- 1.2. Market Segmentation
- 1.3. Research Methodology
- 1.4. Definitions and Assumptions
- 2. Executive Summary
- 2.1. Introduction
- 3. Market Dynamics
- 3.1. Introduction
- 3.2. Market Drivers
- 3.2.1. Prevalence of Lactose Intolerance Driving the Market; Growing Influence of Healthy Lifestyle Trends and Rising Non-Traditional Users
- 3.3. Market Restrains
- 3.3.1. Wide Availability of Alternative Protein Sources
- 3.4. Market Trends
- 3.4.1. Increasing Demand for Organic Food Products
- 4. Market Factor Analysis
- 4.1. Porters Five Forces
- 4.2. Supply/Value Chain
- 4.3. PESTEL analysis
- 4.4. Market Entropy
- 4.5. Patent/Trademark Analysis
- 5. Global US Jam Jelly and Preserves Market Analysis, Insights and Forecast, 2019-2031
- 5.1. Market Analysis, Insights and Forecast - by Product Type
- 5.1.1. Jam and Jellies
- 5.1.2. Marmalade
- 5.1.3. Preserves
- 5.2. Market Analysis, Insights and Forecast - by Distribution Channel
- 5.2.1. Supermarket/Hypermarket
- 5.2.2. Convenience Store
- 5.2.3. Online Stores
- 5.2.4. Other Distribution Channels
- 5.3. Market Analysis, Insights and Forecast - by Region
- 5.3.1. North America
- 5.3.2. South America
- 5.3.3. Europe
- 5.3.4. Middle East & Africa
- 5.3.5. Asia Pacific
- 5.1. Market Analysis, Insights and Forecast - by Product Type
- 6. North America US Jam Jelly and Preserves Market Analysis, Insights and Forecast, 2019-2031
- 6.1. Market Analysis, Insights and Forecast - by Product Type
- 6.1.1. Jam and Jellies
- 6.1.2. Marmalade
- 6.1.3. Preserves
- 6.2. Market Analysis, Insights and Forecast - by Distribution Channel
- 6.2.1. Supermarket/Hypermarket
- 6.2.2. Convenience Store
- 6.2.3. Online Stores
- 6.2.4. Other Distribution Channels
- 6.1. Market Analysis, Insights and Forecast - by Product Type
- 7. South America US Jam Jelly and Preserves Market Analysis, Insights and Forecast, 2019-2031
- 7.1. Market Analysis, Insights and Forecast - by Product Type
- 7.1.1. Jam and Jellies
- 7.1.2. Marmalade
- 7.1.3. Preserves
- 7.2. Market Analysis, Insights and Forecast - by Distribution Channel
- 7.2.1. Supermarket/Hypermarket
- 7.2.2. Convenience Store
- 7.2.3. Online Stores
- 7.2.4. Other Distribution Channels
- 7.1. Market Analysis, Insights and Forecast - by Product Type
- 8. Europe US Jam Jelly and Preserves Market Analysis, Insights and Forecast, 2019-2031
- 8.1. Market Analysis, Insights and Forecast - by Product Type
- 8.1.1. Jam and Jellies
- 8.1.2. Marmalade
- 8.1.3. Preserves
- 8.2. Market Analysis, Insights and Forecast - by Distribution Channel
- 8.2.1. Supermarket/Hypermarket
- 8.2.2. Convenience Store
- 8.2.3. Online Stores
- 8.2.4. Other Distribution Channels
- 8.1. Market Analysis, Insights and Forecast - by Product Type
- 9. Middle East & Africa US Jam Jelly and Preserves Market Analysis, Insights and Forecast, 2019-2031
- 9.1. Market Analysis, Insights and Forecast - by Product Type
- 9.1.1. Jam and Jellies
- 9.1.2. Marmalade
- 9.1.3. Preserves
- 9.2. Market Analysis, Insights and Forecast - by Distribution Channel
- 9.2.1. Supermarket/Hypermarket
- 9.2.2. Convenience Store
- 9.2.3. Online Stores
- 9.2.4. Other Distribution Channels
- 9.1. Market Analysis, Insights and Forecast - by Product Type
- 10. Asia Pacific US Jam Jelly and Preserves Market Analysis, Insights and Forecast, 2019-2031
- 10.1. Market Analysis, Insights and Forecast - by Product Type
- 10.1.1. Jam and Jellies
- 10.1.2. Marmalade
- 10.1.3. Preserves
- 10.2. Market Analysis, Insights and Forecast - by Distribution Channel
- 10.2.1. Supermarket/Hypermarket
- 10.2.2. Convenience Store
- 10.2.3. Online Stores
- 10.2.4. Other Distribution Channels
- 10.1. Market Analysis, Insights and Forecast - by Product Type
- 11. Northeast US Jam Jelly and Preserves Market Analysis, Insights and Forecast, 2019-2031
- 12. Southeast US Jam Jelly and Preserves Market Analysis, Insights and Forecast, 2019-2031
- 13. Midwest US Jam Jelly and Preserves Market Analysis, Insights and Forecast, 2019-2031
- 14. Southwest US Jam Jelly and Preserves Market Analysis, Insights and Forecast, 2019-2031
- 15. West US Jam Jelly and Preserves Market Analysis, Insights and Forecast, 2019-2031
- 16. Competitive Analysis
- 16.1. Global Market Share Analysis 2024
- 16.2. Company Profiles
- 16.2.1 Murphy Orchards*List Not Exhaustive
- 16.2.1.1. Overview
- 16.2.1.2. Products
- 16.2.1.3. SWOT Analysis
- 16.2.1.4. Recent Developments
- 16.2.1.5. Financials (Based on Availability)
- 16.2.2 B&G Foods Inc
- 16.2.2.1. Overview
- 16.2.2.2. Products
- 16.2.2.3. SWOT Analysis
- 16.2.2.4. Recent Developments
- 16.2.2.5. Financials (Based on Availability)
- 16.2.3 Premier Foods Group Services Ltd
- 16.2.3.1. Overview
- 16.2.3.2. Products
- 16.2.3.3. SWOT Analysis
- 16.2.3.4. Recent Developments
- 16.2.3.5. Financials (Based on Availability)
- 16.2.4 F Duerr & Sons Ltd
- 16.2.4.1. Overview
- 16.2.4.2. Products
- 16.2.4.3. SWOT Analysis
- 16.2.4.4. Recent Developments
- 16.2.4.5. Financials (Based on Availability)
- 16.2.5 Wilkin & Sons Ltd
- 16.2.5.1. Overview
- 16.2.5.2. Products
- 16.2.5.3. SWOT Analysis
- 16.2.5.4. Recent Developments
- 16.2.5.5. Financials (Based on Availability)
- 16.2.6 The Hain Celestial Group Inc
- 16.2.6.1. Overview
- 16.2.6.2. Products
- 16.2.6.3. SWOT Analysis
- 16.2.6.4. Recent Developments
- 16.2.6.5. Financials (Based on Availability)
- 16.2.7 National Grape Cooperative Association
- 16.2.7.1. Overview
- 16.2.7.2. Products
- 16.2.7.3. SWOT Analysis
- 16.2.7.4. Recent Developments
- 16.2.7.5. Financials (Based on Availability)
- 16.2.8 The J M Smucker Company
- 16.2.8.1. Overview
- 16.2.8.2. Products
- 16.2.8.3. SWOT Analysis
- 16.2.8.4. Recent Developments
- 16.2.8.5. Financials (Based on Availability)
- 16.2.9 The Kraft Heinz Company
- 16.2.9.1. Overview
- 16.2.9.2. Products
- 16.2.9.3. SWOT Analysis
- 16.2.9.4. Recent Developments
- 16.2.9.5. Financials (Based on Availability)
- 16.2.10 Andros Group
- 16.2.10.1. Overview
- 16.2.10.2. Products
- 16.2.10.3. SWOT Analysis
- 16.2.10.4. Recent Developments
- 16.2.10.5. Financials (Based on Availability)
- 16.2.11 Conagra Foods Inc
- 16.2.11.1. Overview
- 16.2.11.2. Products
- 16.2.11.3. SWOT Analysis
- 16.2.11.4. Recent Developments
- 16.2.11.5. Financials (Based on Availability)
- 16.2.1 Murphy Orchards*List Not Exhaustive
List of Figures
- Figure 1: Global US Jam Jelly and Preserves Market Revenue Breakdown (Million, %) by Region 2024 & 2032
- Figure 2: Global US Jam Jelly and Preserves Market Volume Breakdown (Liters, %) by Region 2024 & 2032
- Figure 3: United states US Jam Jelly and Preserves Market Revenue (Million), by Country 2024 & 2032
- Figure 4: United states US Jam Jelly and Preserves Market Volume (Liters), by Country 2024 & 2032
- Figure 5: United states US Jam Jelly and Preserves Market Revenue Share (%), by Country 2024 & 2032
- Figure 6: United states US Jam Jelly and Preserves Market Volume Share (%), by Country 2024 & 2032
- Figure 7: North America US Jam Jelly and Preserves Market Revenue (Million), by Product Type 2024 & 2032
- Figure 8: North America US Jam Jelly and Preserves Market Volume (Liters), by Product Type 2024 & 2032
- Figure 9: North America US Jam Jelly and Preserves Market Revenue Share (%), by Product Type 2024 & 2032
- Figure 10: North America US Jam Jelly and Preserves Market Volume Share (%), by Product Type 2024 & 2032
- Figure 11: North America US Jam Jelly and Preserves Market Revenue (Million), by Distribution Channel 2024 & 2032
- Figure 12: North America US Jam Jelly and Preserves Market Volume (Liters), by Distribution Channel 2024 & 2032
- Figure 13: North America US Jam Jelly and Preserves Market Revenue Share (%), by Distribution Channel 2024 & 2032
- Figure 14: North America US Jam Jelly and Preserves Market Volume Share (%), by Distribution Channel 2024 & 2032
- Figure 15: North America US Jam Jelly and Preserves Market Revenue (Million), by Country 2024 & 2032
- Figure 16: North America US Jam Jelly and Preserves Market Volume (Liters), by Country 2024 & 2032
- Figure 17: North America US Jam Jelly and Preserves Market Revenue Share (%), by Country 2024 & 2032
- Figure 18: North America US Jam Jelly and Preserves Market Volume Share (%), by Country 2024 & 2032
- Figure 19: South America US Jam Jelly and Preserves Market Revenue (Million), by Product Type 2024 & 2032
- Figure 20: South America US Jam Jelly and Preserves Market Volume (Liters), by Product Type 2024 & 2032
- Figure 21: South America US Jam Jelly and Preserves Market Revenue Share (%), by Product Type 2024 & 2032
- Figure 22: South America US Jam Jelly and Preserves Market Volume Share (%), by Product Type 2024 & 2032
- Figure 23: South America US Jam Jelly and Preserves Market Revenue (Million), by Distribution Channel 2024 & 2032
- Figure 24: South America US Jam Jelly and Preserves Market Volume (Liters), by Distribution Channel 2024 & 2032
- Figure 25: South America US Jam Jelly and Preserves Market Revenue Share (%), by Distribution Channel 2024 & 2032
- Figure 26: South America US Jam Jelly and Preserves Market Volume Share (%), by Distribution Channel 2024 & 2032
- Figure 27: South America US Jam Jelly and Preserves Market Revenue (Million), by Country 2024 & 2032
- Figure 28: South America US Jam Jelly and Preserves Market Volume (Liters), by Country 2024 & 2032
- Figure 29: South America US Jam Jelly and Preserves Market Revenue Share (%), by Country 2024 & 2032
- Figure 30: South America US Jam Jelly and Preserves Market Volume Share (%), by Country 2024 & 2032
- Figure 31: Europe US Jam Jelly and Preserves Market Revenue (Million), by Product Type 2024 & 2032
- Figure 32: Europe US Jam Jelly and Preserves Market Volume (Liters), by Product Type 2024 & 2032
- Figure 33: Europe US Jam Jelly and Preserves Market Revenue Share (%), by Product Type 2024 & 2032
- Figure 34: Europe US Jam Jelly and Preserves Market Volume Share (%), by Product Type 2024 & 2032
- Figure 35: Europe US Jam Jelly and Preserves Market Revenue (Million), by Distribution Channel 2024 & 2032
- Figure 36: Europe US Jam Jelly and Preserves Market Volume (Liters), by Distribution Channel 2024 & 2032
- Figure 37: Europe US Jam Jelly and Preserves Market Revenue Share (%), by Distribution Channel 2024 & 2032
- Figure 38: Europe US Jam Jelly and Preserves Market Volume Share (%), by Distribution Channel 2024 & 2032
- Figure 39: Europe US Jam Jelly and Preserves Market Revenue (Million), by Country 2024 & 2032
- Figure 40: Europe US Jam Jelly and Preserves Market Volume (Liters), by Country 2024 & 2032
- Figure 41: Europe US Jam Jelly and Preserves Market Revenue Share (%), by Country 2024 & 2032
- Figure 42: Europe US Jam Jelly and Preserves Market Volume Share (%), by Country 2024 & 2032
- Figure 43: Middle East & Africa US Jam Jelly and Preserves Market Revenue (Million), by Product Type 2024 & 2032
- Figure 44: Middle East & Africa US Jam Jelly and Preserves Market Volume (Liters), by Product Type 2024 & 2032
- Figure 45: Middle East & Africa US Jam Jelly and Preserves Market Revenue Share (%), by Product Type 2024 & 2032
- Figure 46: Middle East & Africa US Jam Jelly and Preserves Market Volume Share (%), by Product Type 2024 & 2032
- Figure 47: Middle East & Africa US Jam Jelly and Preserves Market Revenue (Million), by Distribution Channel 2024 & 2032
- Figure 48: Middle East & Africa US Jam Jelly and Preserves Market Volume (Liters), by Distribution Channel 2024 & 2032
- Figure 49: Middle East & Africa US Jam Jelly and Preserves Market Revenue Share (%), by Distribution Channel 2024 & 2032
- Figure 50: Middle East & Africa US Jam Jelly and Preserves Market Volume Share (%), by Distribution Channel 2024 & 2032
- Figure 51: Middle East & Africa US Jam Jelly and Preserves Market Revenue (Million), by Country 2024 & 2032
- Figure 52: Middle East & Africa US Jam Jelly and Preserves Market Volume (Liters), by Country 2024 & 2032
- Figure 53: Middle East & Africa US Jam Jelly and Preserves Market Revenue Share (%), by Country 2024 & 2032
- Figure 54: Middle East & Africa US Jam Jelly and Preserves Market Volume Share (%), by Country 2024 & 2032
- Figure 55: Asia Pacific US Jam Jelly and Preserves Market Revenue (Million), by Product Type 2024 & 2032
- Figure 56: Asia Pacific US Jam Jelly and Preserves Market Volume (Liters), by Product Type 2024 & 2032
- Figure 57: Asia Pacific US Jam Jelly and Preserves Market Revenue Share (%), by Product Type 2024 & 2032
- Figure 58: Asia Pacific US Jam Jelly and Preserves Market Volume Share (%), by Product Type 2024 & 2032
- Figure 59: Asia Pacific US Jam Jelly and Preserves Market Revenue (Million), by Distribution Channel 2024 & 2032
- Figure 60: Asia Pacific US Jam Jelly and Preserves Market Volume (Liters), by Distribution Channel 2024 & 2032
- Figure 61: Asia Pacific US Jam Jelly and Preserves Market Revenue Share (%), by Distribution Channel 2024 & 2032
- Figure 62: Asia Pacific US Jam Jelly and Preserves Market Volume Share (%), by Distribution Channel 2024 & 2032
- Figure 63: Asia Pacific US Jam Jelly and Preserves Market Revenue (Million), by Country 2024 & 2032
- Figure 64: Asia Pacific US Jam Jelly and Preserves Market Volume (Liters), by Country 2024 & 2032
- Figure 65: Asia Pacific US Jam Jelly and Preserves Market Revenue Share (%), by Country 2024 & 2032
- Figure 66: Asia Pacific US Jam Jelly and Preserves Market Volume Share (%), by Country 2024 & 2032
List of Tables
- Table 1: Global US Jam Jelly and Preserves Market Revenue Million Forecast, by Region 2019 & 2032
- Table 2: Global US Jam Jelly and Preserves Market Volume Liters Forecast, by Region 2019 & 2032
- Table 3: Global US Jam Jelly and Preserves Market Revenue Million Forecast, by Product Type 2019 & 2032
- Table 4: Global US Jam Jelly and Preserves Market Volume Liters Forecast, by Product Type 2019 & 2032
- Table 5: Global US Jam Jelly and Preserves Market Revenue Million Forecast, by Distribution Channel 2019 & 2032
- Table 6: Global US Jam Jelly and Preserves Market Volume Liters Forecast, by Distribution Channel 2019 & 2032
- Table 7: Global US Jam Jelly and Preserves Market Revenue Million Forecast, by Region 2019 & 2032
- Table 8: Global US Jam Jelly and Preserves Market Volume Liters Forecast, by Region 2019 & 2032
- Table 9: Global US Jam Jelly and Preserves Market Revenue Million Forecast, by Country 2019 & 2032
- Table 10: Global US Jam Jelly and Preserves Market Volume Liters Forecast, by Country 2019 & 2032
- Table 11: Northeast US Jam Jelly and Preserves Market Revenue (Million) Forecast, by Application 2019 & 2032
- Table 12: Northeast US Jam Jelly and Preserves Market Volume (Liters) Forecast, by Application 2019 & 2032
- Table 13: Southeast US Jam Jelly and Preserves Market Revenue (Million) Forecast, by Application 2019 & 2032
- Table 14: Southeast US Jam Jelly and Preserves Market Volume (Liters) Forecast, by Application 2019 & 2032
- Table 15: Midwest US Jam Jelly and Preserves Market Revenue (Million) Forecast, by Application 2019 & 2032
- Table 16: Midwest US Jam Jelly and Preserves Market Volume (Liters) Forecast, by Application 2019 & 2032
- Table 17: Southwest US Jam Jelly and Preserves Market Revenue (Million) Forecast, by Application 2019 & 2032
- Table 18: Southwest US Jam Jelly and Preserves Market Volume (Liters) Forecast, by Application 2019 & 2032
- Table 19: West US Jam Jelly and Preserves Market Revenue (Million) Forecast, by Application 2019 & 2032
- Table 20: West US Jam Jelly and Preserves Market Volume (Liters) Forecast, by Application 2019 & 2032
- Table 21: Global US Jam Jelly and Preserves Market Revenue Million Forecast, by Product Type 2019 & 2032
- Table 22: Global US Jam Jelly and Preserves Market Volume Liters Forecast, by Product Type 2019 & 2032
- Table 23: Global US Jam Jelly and Preserves Market Revenue Million Forecast, by Distribution Channel 2019 & 2032
- Table 24: Global US Jam Jelly and Preserves Market Volume Liters Forecast, by Distribution Channel 2019 & 2032
- Table 25: Global US Jam Jelly and Preserves Market Revenue Million Forecast, by Country 2019 & 2032
- Table 26: Global US Jam Jelly and Preserves Market Volume Liters Forecast, by Country 2019 & 2032
- Table 27: United States US Jam Jelly and Preserves Market Revenue (Million) Forecast, by Application 2019 & 2032
- Table 28: United States US Jam Jelly and Preserves Market Volume (Liters) Forecast, by Application 2019 & 2032
- Table 29: Canada US Jam Jelly and Preserves Market Revenue (Million) Forecast, by Application 2019 & 2032
- Table 30: Canada US Jam Jelly and Preserves Market Volume (Liters) Forecast, by Application 2019 & 2032
- Table 31: Mexico US Jam Jelly and Preserves Market Revenue (Million) Forecast, by Application 2019 & 2032
- Table 32: Mexico US Jam Jelly and Preserves Market Volume (Liters) Forecast, by Application 2019 & 2032
- Table 33: Global US Jam Jelly and Preserves Market Revenue Million Forecast, by Product Type 2019 & 2032
- Table 34: Global US Jam Jelly and Preserves Market Volume Liters Forecast, by Product Type 2019 & 2032
- Table 35: Global US Jam Jelly and Preserves Market Revenue Million Forecast, by Distribution Channel 2019 & 2032
- Table 36: Global US Jam Jelly and Preserves Market Volume Liters Forecast, by Distribution Channel 2019 & 2032
- Table 37: Global US Jam Jelly and Preserves Market Revenue Million Forecast, by Country 2019 & 2032
- Table 38: Global US Jam Jelly and Preserves Market Volume Liters Forecast, by Country 2019 & 2032
- Table 39: Brazil US Jam Jelly and Preserves Market Revenue (Million) Forecast, by Application 2019 & 2032
- Table 40: Brazil US Jam Jelly and Preserves Market Volume (Liters) Forecast, by Application 2019 & 2032
- Table 41: Argentina US Jam Jelly and Preserves Market Revenue (Million) Forecast, by Application 2019 & 2032
- Table 42: Argentina US Jam Jelly and Preserves Market Volume (Liters) Forecast, by Application 2019 & 2032
- Table 43: Rest of South America US Jam Jelly and Preserves Market Revenue (Million) Forecast, by Application 2019 & 2032
- Table 44: Rest of South America US Jam Jelly and Preserves Market Volume (Liters) Forecast, by Application 2019 & 2032
- Table 45: Global US Jam Jelly and Preserves Market Revenue Million Forecast, by Product Type 2019 & 2032
- Table 46: Global US Jam Jelly and Preserves Market Volume Liters Forecast, by Product Type 2019 & 2032
- Table 47: Global US Jam Jelly and Preserves Market Revenue Million Forecast, by Distribution Channel 2019 & 2032
- Table 48: Global US Jam Jelly and Preserves Market Volume Liters Forecast, by Distribution Channel 2019 & 2032
- Table 49: Global US Jam Jelly and Preserves Market Revenue Million Forecast, by Country 2019 & 2032
- Table 50: Global US Jam Jelly and Preserves Market Volume Liters Forecast, by Country 2019 & 2032
- Table 51: United Kingdom US Jam Jelly and Preserves Market Revenue (Million) Forecast, by Application 2019 & 2032
- Table 52: United Kingdom US Jam Jelly and Preserves Market Volume (Liters) Forecast, by Application 2019 & 2032
- Table 53: Germany US Jam Jelly and Preserves Market Revenue (Million) Forecast, by Application 2019 & 2032
- Table 54: Germany US Jam Jelly and Preserves Market Volume (Liters) Forecast, by Application 2019 & 2032
- Table 55: France US Jam Jelly and Preserves Market Revenue (Million) Forecast, by Application 2019 & 2032
- Table 56: France US Jam Jelly and Preserves Market Volume (Liters) Forecast, by Application 2019 & 2032
- Table 57: Italy US Jam Jelly and Preserves Market Revenue (Million) Forecast, by Application 2019 & 2032
- Table 58: Italy US Jam Jelly and Preserves Market Volume (Liters) Forecast, by Application 2019 & 2032
- Table 59: Spain US Jam Jelly and Preserves Market Revenue (Million) Forecast, by Application 2019 & 2032
- Table 60: Spain US Jam Jelly and Preserves Market Volume (Liters) Forecast, by Application 2019 & 2032
- Table 61: Russia US Jam Jelly and Preserves Market Revenue (Million) Forecast, by Application 2019 & 2032
- Table 62: Russia US Jam Jelly and Preserves Market Volume (Liters) Forecast, by Application 2019 & 2032
- Table 63: Benelux US Jam Jelly and Preserves Market Revenue (Million) Forecast, by Application 2019 & 2032
- Table 64: Benelux US Jam Jelly and Preserves Market Volume (Liters) Forecast, by Application 2019 & 2032
- Table 65: Nordics US Jam Jelly and Preserves Market Revenue (Million) Forecast, by Application 2019 & 2032
- Table 66: Nordics US Jam Jelly and Preserves Market Volume (Liters) Forecast, by Application 2019 & 2032
- Table 67: Rest of Europe US Jam Jelly and Preserves Market Revenue (Million) Forecast, by Application 2019 & 2032
- Table 68: Rest of Europe US Jam Jelly and Preserves Market Volume (Liters) Forecast, by Application 2019 & 2032
- Table 69: Global US Jam Jelly and Preserves Market Revenue Million Forecast, by Product Type 2019 & 2032
- Table 70: Global US Jam Jelly and Preserves Market Volume Liters Forecast, by Product Type 2019 & 2032
- Table 71: Global US Jam Jelly and Preserves Market Revenue Million Forecast, by Distribution Channel 2019 & 2032
- Table 72: Global US Jam Jelly and Preserves Market Volume Liters Forecast, by Distribution Channel 2019 & 2032
- Table 73: Global US Jam Jelly and Preserves Market Revenue Million Forecast, by Country 2019 & 2032
- Table 74: Global US Jam Jelly and Preserves Market Volume Liters Forecast, by Country 2019 & 2032
- Table 75: Turkey US Jam Jelly and Preserves Market Revenue (Million) Forecast, by Application 2019 & 2032
- Table 76: Turkey US Jam Jelly and Preserves Market Volume (Liters) Forecast, by Application 2019 & 2032
- Table 77: Israel US Jam Jelly and Preserves Market Revenue (Million) Forecast, by Application 2019 & 2032
- Table 78: Israel US Jam Jelly and Preserves Market Volume (Liters) Forecast, by Application 2019 & 2032
- Table 79: GCC US Jam Jelly and Preserves Market Revenue (Million) Forecast, by Application 2019 & 2032
- Table 80: GCC US Jam Jelly and Preserves Market Volume (Liters) Forecast, by Application 2019 & 2032
- Table 81: North Africa US Jam Jelly and Preserves Market Revenue (Million) Forecast, by Application 2019 & 2032
- Table 82: North Africa US Jam Jelly and Preserves Market Volume (Liters) Forecast, by Application 2019 & 2032
- Table 83: South Africa US Jam Jelly and Preserves Market Revenue (Million) Forecast, by Application 2019 & 2032
- Table 84: South Africa US Jam Jelly and Preserves Market Volume (Liters) Forecast, by Application 2019 & 2032
- Table 85: Rest of Middle East & Africa US Jam Jelly and Preserves Market Revenue (Million) Forecast, by Application 2019 & 2032
- Table 86: Rest of Middle East & Africa US Jam Jelly and Preserves Market Volume (Liters) Forecast, by Application 2019 & 2032
- Table 87: Global US Jam Jelly and Preserves Market Revenue Million Forecast, by Product Type 2019 & 2032
- Table 88: Global US Jam Jelly and Preserves Market Volume Liters Forecast, by Product Type 2019 & 2032
- Table 89: Global US Jam Jelly and Preserves Market Revenue Million Forecast, by Distribution Channel 2019 & 2032
- Table 90: Global US Jam Jelly and Preserves Market Volume Liters Forecast, by Distribution Channel 2019 & 2032
- Table 91: Global US Jam Jelly and Preserves Market Revenue Million Forecast, by Country 2019 & 2032
- Table 92: Global US Jam Jelly and Preserves Market Volume Liters Forecast, by Country 2019 & 2032
- Table 93: China US Jam Jelly and Preserves Market Revenue (Million) Forecast, by Application 2019 & 2032
- Table 94: China US Jam Jelly and Preserves Market Volume (Liters) Forecast, by Application 2019 & 2032
- Table 95: India US Jam Jelly and Preserves Market Revenue (Million) Forecast, by Application 2019 & 2032
- Table 96: India US Jam Jelly and Preserves Market Volume (Liters) Forecast, by Application 2019 & 2032
- Table 97: Japan US Jam Jelly and Preserves Market Revenue (Million) Forecast, by Application 2019 & 2032
- Table 98: Japan US Jam Jelly and Preserves Market Volume (Liters) Forecast, by Application 2019 & 2032
- Table 99: South Korea US Jam Jelly and Preserves Market Revenue (Million) Forecast, by Application 2019 & 2032
- Table 100: South Korea US Jam Jelly and Preserves Market Volume (Liters) Forecast, by Application 2019 & 2032
- Table 101: ASEAN US Jam Jelly and Preserves Market Revenue (Million) Forecast, by Application 2019 & 2032
- Table 102: ASEAN US Jam Jelly and Preserves Market Volume (Liters) Forecast, by Application 2019 & 2032
- Table 103: Oceania US Jam Jelly and Preserves Market Revenue (Million) Forecast, by Application 2019 & 2032
- Table 104: Oceania US Jam Jelly and Preserves Market Volume (Liters) Forecast, by Application 2019 & 2032
- Table 105: Rest of Asia Pacific US Jam Jelly and Preserves Market Revenue (Million) Forecast, by Application 2019 & 2032
- Table 106: Rest of Asia Pacific US Jam Jelly and Preserves Market Volume (Liters) Forecast, by Application 2019 & 2032
Frequently Asked Questions
1. What is the projected Compound Annual Growth Rate (CAGR) of the US Jam Jelly and Preserves Market?
The projected CAGR is approximately 3.40%.
2. Which companies are prominent players in the US Jam Jelly and Preserves Market?
Key companies in the market include Murphy Orchards*List Not Exhaustive, B&G Foods Inc, Premier Foods Group Services Ltd, F Duerr & Sons Ltd, Wilkin & Sons Ltd, The Hain Celestial Group Inc, National Grape Cooperative Association, The J M Smucker Company, The Kraft Heinz Company, Andros Group, Conagra Foods Inc.
3. What are the main segments of the US Jam Jelly and Preserves Market?
The market segments include Product Type, Distribution Channel.
4. Can you provide details about the market size?
The market size is estimated to be USD 1430 Million as of 2022.
5. What are some drivers contributing to market growth?
Prevalence of Lactose Intolerance Driving the Market; Growing Influence of Healthy Lifestyle Trends and Rising Non-Traditional Users.
6. What are the notable trends driving market growth?
Increasing Demand for Organic Food Products.
7. Are there any restraints impacting market growth?
Wide Availability of Alternative Protein Sources.
8. Can you provide examples of recent developments in the market?
January 2023: Conagra Brands unveiled a new line of products, including the Snack Pack Starburst All Pink Juicy Gels. These delightful treats are specifically crafted with the signature all-pink flavor to replicate the irresistible experience of savoring a strawberry-flavored Starburst.
9. What pricing options are available for accessing the report?
Pricing options include single-user, multi-user, and enterprise licenses priced at USD 3800, USD 4500, and USD 5800 respectively.
10. Is the market size provided in terms of value or volume?
The market size is provided in terms of value, measured in Million and volume, measured in Liters.
11. Are there any specific market keywords associated with the report?
Yes, the market keyword associated with the report is "US Jam Jelly and Preserves Market," which aids in identifying and referencing the specific market segment covered.
12. How do I determine which pricing option suits my needs best?
The pricing options vary based on user requirements and access needs. Individual users may opt for single-user licenses, while businesses requiring broader access may choose multi-user or enterprise licenses for cost-effective access to the report.
13. Are there any additional resources or data provided in the US Jam Jelly and Preserves Market report?
While the report offers comprehensive insights, it's advisable to review the specific contents or supplementary materials provided to ascertain if additional resources or data are available.
14. How can I stay updated on further developments or reports in the US Jam Jelly and Preserves Market?
To stay informed about further developments, trends, and reports in the US Jam Jelly and Preserves Market, consider subscribing to industry newsletters, following relevant companies and organizations, or regularly checking reputable industry news sources and publications.
Methodology
Step 1 - Identification of Relevant Samples Size from Population Database


Step 2 - Approaches for Defining Global Market Size (Value, Volume* & Price*)

Note*: In applicable scenarios
Step 3 - Data Sources
Primary Research
- Web Analytics
- Survey Reports
- Research Institute
- Latest Research Reports
- Opinion Leaders
Secondary Research
- Annual Reports
- White Paper
- Latest Press Release
- Industry Association
- Paid Database
- Investor Presentations

Step 4 - Data Triangulation
Involves using different sources of information in order to increase the validity of a study
These sources are likely to be stakeholders in a program - participants, other researchers, program staff, other community members, and so on.
Then we put all data in single framework & apply various statistical tools to find out the dynamic on the market.
During the analysis stage, feedback from the stakeholder groups would be compared to determine areas of agreement as well as areas of divergence
