

Key Insights
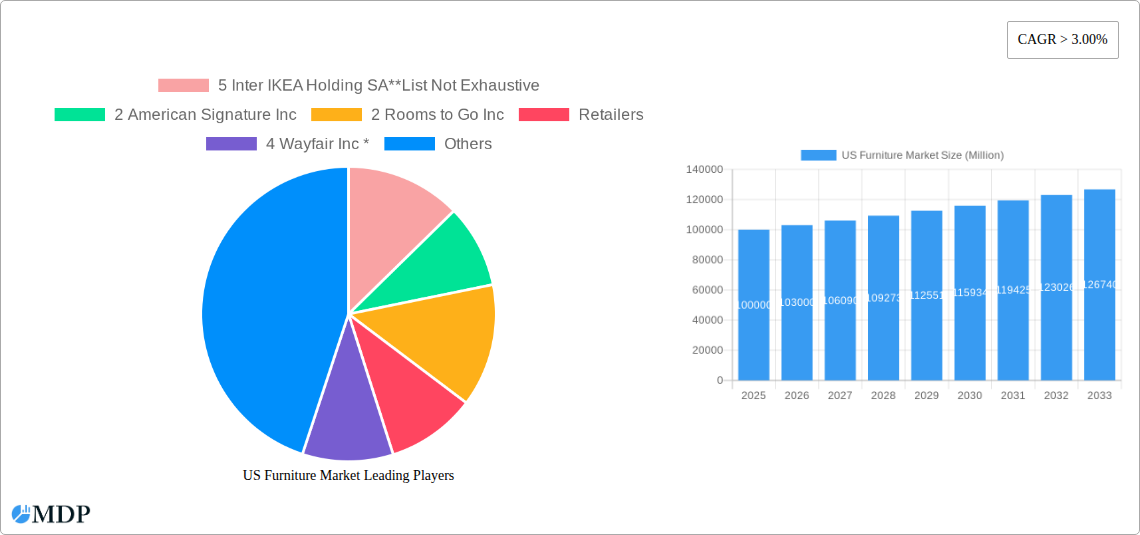
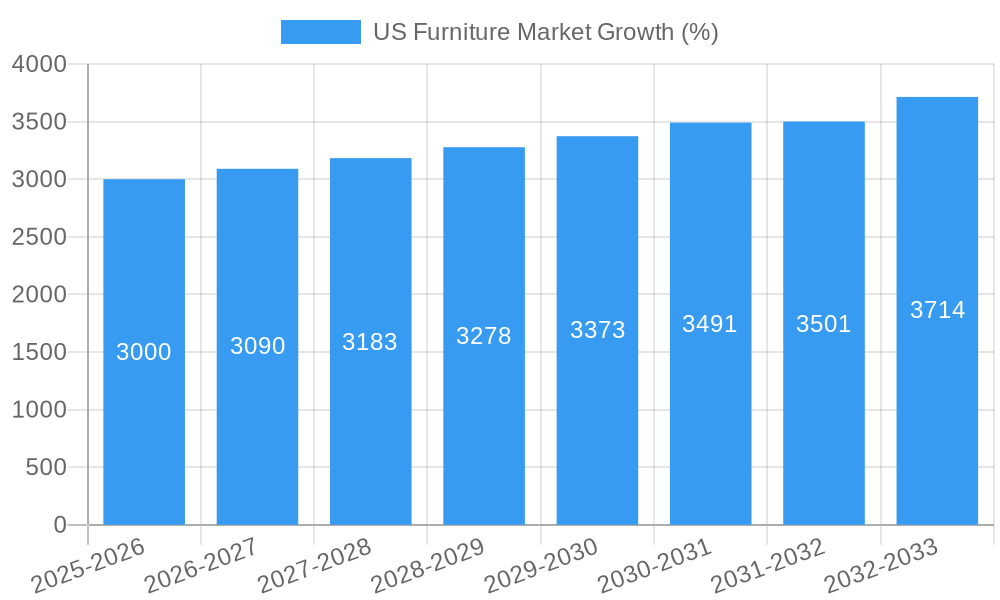
The US furniture market, valued at approximately $100 billion in 2025, is projected to experience robust growth, exhibiting a Compound Annual Growth Rate (CAGR) exceeding 3% from 2025 to 2033. This expansion is fueled by several key drivers. Rising disposable incomes, particularly among millennials and Gen Z, are stimulating demand for home furnishings. Furthermore, the increasing popularity of home renovation and improvement projects, coupled with a shift towards remote work and a greater emphasis on creating comfortable and functional home environments, are significantly contributing to market growth. The trend towards sustainable and ethically sourced furniture is also gaining traction, influencing consumer purchasing decisions and prompting manufacturers to adopt more eco-friendly practices. However, the market faces certain restraints, including supply chain disruptions, increasing raw material costs, and fluctuating consumer confidence impacting discretionary spending.
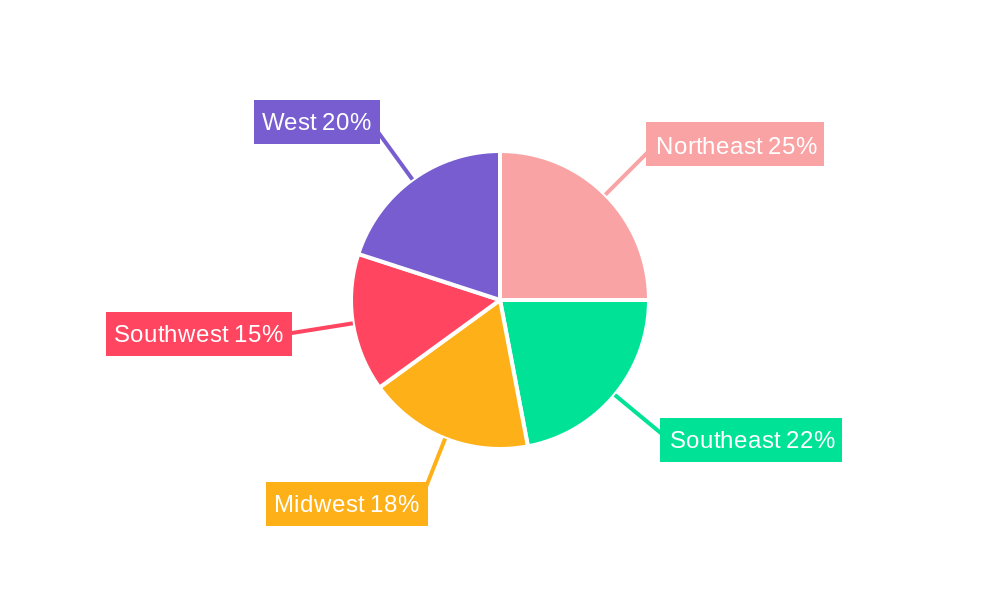
Segmentation analysis reveals that kitchen furniture holds a substantial market share, followed by living and bedroom furniture. Online stores are rapidly gaining prominence as a distribution channel, driven by the convenience and accessibility they offer. Major players like Inter IKEA Holding, American Signature, Rooms To Go, Wayfair, Crate & Barrel, Williams-Sonoma, La-Z-Boy, Ashley Furniture, and Bed Bath & Beyond are shaping the competitive landscape. Regional variations exist, with the Northeast, Southeast, and West Coast experiencing higher demand compared to the Midwest and Southwest, reflecting varying population density, income levels, and housing preferences. Future growth will likely be driven by technological advancements in furniture design and manufacturing, the rise of personalized furniture solutions, and the integration of smart home technology into furniture pieces. This growth projection assumes a stable macroeconomic environment and continued consumer interest in home improvement and furnishing.
US Furniture Market Report: 2019-2033 Forecast
Dive deep into the dynamic US furniture market with this comprehensive report, projecting trends to 2033. This in-depth analysis provides critical insights for manufacturers, retailers, and investors seeking to navigate this ever-evolving landscape. From market sizing and segmentation to competitive dynamics and emerging opportunities, this report equips you with the data-driven intelligence you need to make informed strategic decisions. The report covers the period 2019-2033, with a base year of 2025 and a forecast period spanning 2025-2033.
US Furniture Market Market Dynamics & Concentration
The US furniture market, valued at $xx Million in 2025, exhibits a moderately concentrated landscape with key players controlling significant market share. Market concentration is influenced by factors like brand recognition, economies of scale, and established distribution networks. Innovation in materials, design, and manufacturing processes is a crucial driver, pushing the market towards sustainability and personalization. Regulatory frameworks, including safety and environmental standards, shape product development and manufacturing practices. The presence of substitute products, such as secondhand furniture and repurposed items, exerts competitive pressure, though the demand for high-quality, durable furniture remains strong. End-user trends, notably towards minimalist aesthetics and multi-functional furniture, significantly influence product design and demand. Mergers and acquisitions (M&A) activity has been notable, with xx M&A deals recorded between 2019 and 2024, contributing to market consolidation and reshaping the competitive landscape. Key players hold significant market share, with the top 5 holding an estimated xx% of the market in 2025.
- Market Concentration: Moderately concentrated, with top players holding significant market share.
- Innovation Drivers: Sustainable materials, personalized designs, smart furniture integration.
- Regulatory Framework: Safety and environmental standards influencing manufacturing practices.
- Product Substitutes: Secondhand furniture and repurposed items pose competitive pressure.
- End-User Trends: Growing preference for minimalist designs and multifunctional furniture.
- M&A Activity: xx deals between 2019-2024, resulting in market consolidation.
US Furniture Market Industry Trends & Analysis
The US furniture market is projected to witness a CAGR of xx% during the forecast period (2025-2033), driven by several factors. Rising disposable incomes and increasing urbanization fuel demand for home furnishings. Technological disruptions, particularly in e-commerce and digital marketing, are transforming the distribution landscape. Consumer preferences are shifting towards sustainable and ethically sourced products, pushing manufacturers to adopt eco-friendly practices. Competitive dynamics are intense, with established players facing challenges from emerging online retailers and smaller, niche brands. Market penetration of online furniture sales is steadily increasing, reaching an estimated xx% in 2025, demonstrating the significant impact of e-commerce. Furthermore, shifting consumer preferences toward personalized and customizable furniture are driving product innovation and impacting market growth.
Leading Markets & Segments in US Furniture Market
The US furniture market is geographically diverse, with significant variations in demand across regions. However, specific regional dominance data is not available and therefore cannot be included in this report.
By Product:
- Living and Bedroom Furniture: This segment dominates the market, driven by high demand for comfort and personalization. Key drivers include rising disposable incomes and increasing urbanization.
- Kitchen Furniture: This segment is experiencing steady growth, fueled by trends in home renovation and kitchen remodeling.
- Outdoor Furniture: Growth is fueled by an increasing interest in outdoor living spaces.
- Bathroom Furniture: Growth is driven by homeowners investing in renovations and upgrades.
- Other Furniture: This category encompasses a variety of furniture types, showing consistent yet less pronounced growth.
By Distribution Channel:
- Online Stores: This channel is experiencing rapid growth, driven by the convenience and wide selection offered by e-commerce platforms.
- Specialty Stores: While facing competition from online retailers, specialty stores maintain a significant market share by offering curated collections and expert advice.
- Home Centers: These retailers offer a broad range of furniture styles at competitive prices.
- Flagship Stores: Brick-and-mortar stores maintain their relevance through brand experience and personalized service.
US Furniture Market Product Developments
Recent product innovations focus on incorporating smart technology, sustainable materials, and modular designs to cater to evolving consumer needs. Smart furniture integrates technology for enhanced functionality and convenience, while sustainable materials address growing environmental concerns. Modular designs offer flexibility and adaptability, aligning with the trend toward smaller living spaces and customizable interiors. These innovations enhance the overall value proposition, creating competitive advantages in the market.
Key Drivers of US Furniture Market Growth
Several factors contribute to the growth of the US furniture market. Technological advancements in design and manufacturing lead to more efficient production and innovative product offerings. Economic growth and rising disposable incomes boost consumer spending on home furnishings. Favorable government policies and initiatives promoting sustainable practices support market expansion.
Challenges in the US Furniture Market Market
The US furniture market faces several challenges. Fluctuations in raw material costs and supply chain disruptions impact production costs and profitability. Intense competition from both established players and emerging brands necessitates continuous innovation and efficient operations. Stringent environmental regulations and increasing concerns about sustainability add to the complexity of manufacturing and distribution.
Emerging Opportunities in US Furniture Market
The US furniture market presents significant long-term growth opportunities. The increasing adoption of e-commerce and digital marketing creates avenues for enhanced reach and customer engagement. Strategic partnerships and collaborations can unlock new markets and accelerate product innovation. Expansion into niche segments and customization options allow companies to cater to specific customer preferences and lifestyles. The integration of technology and sustainable practices offer further opportunities to enhance both product value and brand image.
Leading Players in the US Furniture Market Sector
- 5 Inter IKEA Holding SA
- 2 American Signature Inc
- 2 Rooms To Go Inc
- 4 Wayfair Inc
- 3 Crate and Barrel
- 3 Williams-Sonoma Inc
- 4 La-Z-Boy
- 1 Ashley Furniture Store
- 1 Bed Bath & Beyond Inc
Key Milestones in US Furniture Market Industry
- 2020: Increased online furniture sales due to pandemic-related lockdowns.
- 2021: Supply chain disruptions and material cost increases impacted production.
- 2022: Focus on sustainable and eco-friendly furniture manufacturing increased.
- 2023: Innovation in smart home furniture technology gained momentum.
- (Further milestones require specific data for inclusion.)
Strategic Outlook for US Furniture Market Market
The US furniture market is poised for continued growth, driven by technological advancements, changing consumer preferences, and a focus on sustainability. Companies that can effectively adapt to evolving market trends, leverage technological innovations, and offer personalized and sustainable products are best positioned for success. Strategic partnerships and expansion into emerging markets present further opportunities for long-term growth and profitability.
US Furniture Market Segmentation
- 1. Production Analysis
- 2. Consumption Analysis
- 3. Import Market Analysis (Value & Volume)
- 4. Export Market Analysis (Value & Volume)
- 5. Price Trend Analysis
US Furniture Market Segmentation By Geography
-
1. North America
- 1.1. United States
- 1.2. Canada
- 1.3. Mexico
-
2. South America
- 2.1. Brazil
- 2.2. Argentina
- 2.3. Rest of South America
-
3. Europe
- 3.1. United Kingdom
- 3.2. Germany
- 3.3. France
- 3.4. Italy
- 3.5. Spain
- 3.6. Russia
- 3.7. Benelux
- 3.8. Nordics
- 3.9. Rest of Europe
-
4. Middle East & Africa
- 4.1. Turkey
- 4.2. Israel
- 4.3. GCC
- 4.4. North Africa
- 4.5. South Africa
- 4.6. Rest of Middle East & Africa
-
5. Asia Pacific
- 5.1. China
- 5.2. India
- 5.3. Japan
- 5.4. South Korea
- 5.5. ASEAN
- 5.6. Oceania
- 5.7. Rest of Asia Pacific
US Furniture Market REPORT HIGHLIGHTS
| Aspects | Details |
|---|---|
| Study Period | 2019-2033 |
| Base Year | 2024 |
| Estimated Year | 2025 |
| Forecast Period | 2025-2033 |
| Historical Period | 2019-2024 |
| Growth Rate | CAGR of > 3.00% from 2019-2033 |
| Segmentation |
|
Table of Contents
- 1. Introduction
- 1.1. Research Scope
- 1.2. Market Segmentation
- 1.3. Research Methodology
- 1.4. Definitions and Assumptions
- 2. Executive Summary
- 2.1. Introduction
- 3. Market Dynamics
- 3.1. Introduction
- 3.2. Market Drivers
- 3.2.1. Rising Urbanization and Population Growth; Growth in the Construction Industry is Driving the Market
- 3.3. Market Restrains
- 3.3.1. Economic Uncertainty; Increasing Competition in the Market
- 3.4. Market Trends
- 3.4.1. Growing Sales of Bedroom Furniture is Driving the Market
- 4. Market Factor Analysis
- 4.1. Porters Five Forces
- 4.2. Supply/Value Chain
- 4.3. PESTEL analysis
- 4.4. Market Entropy
- 4.5. Patent/Trademark Analysis
- 5. Global US Furniture Market Analysis, Insights and Forecast, 2019-2031
- 5.1. Market Analysis, Insights and Forecast - by Production Analysis
- 5.2. Market Analysis, Insights and Forecast - by Consumption Analysis
- 5.3. Market Analysis, Insights and Forecast - by Import Market Analysis (Value & Volume)
- 5.4. Market Analysis, Insights and Forecast - by Export Market Analysis (Value & Volume)
- 5.5. Market Analysis, Insights and Forecast - by Price Trend Analysis
- 5.6. Market Analysis, Insights and Forecast - by Region
- 5.6.1. North America
- 5.6.2. South America
- 5.6.3. Europe
- 5.6.4. Middle East & Africa
- 5.6.5. Asia Pacific
- 5.1. Market Analysis, Insights and Forecast - by Production Analysis
- 6. North America US Furniture Market Analysis, Insights and Forecast, 2019-2031
- 6.1. Market Analysis, Insights and Forecast - by Production Analysis
- 6.2. Market Analysis, Insights and Forecast - by Consumption Analysis
- 6.3. Market Analysis, Insights and Forecast - by Import Market Analysis (Value & Volume)
- 6.4. Market Analysis, Insights and Forecast - by Export Market Analysis (Value & Volume)
- 6.5. Market Analysis, Insights and Forecast - by Price Trend Analysis
- 6.1. Market Analysis, Insights and Forecast - by Production Analysis
- 7. South America US Furniture Market Analysis, Insights and Forecast, 2019-2031
- 7.1. Market Analysis, Insights and Forecast - by Production Analysis
- 7.2. Market Analysis, Insights and Forecast - by Consumption Analysis
- 7.3. Market Analysis, Insights and Forecast - by Import Market Analysis (Value & Volume)
- 7.4. Market Analysis, Insights and Forecast - by Export Market Analysis (Value & Volume)
- 7.5. Market Analysis, Insights and Forecast - by Price Trend Analysis
- 7.1. Market Analysis, Insights and Forecast - by Production Analysis
- 8. Europe US Furniture Market Analysis, Insights and Forecast, 2019-2031
- 8.1. Market Analysis, Insights and Forecast - by Production Analysis
- 8.2. Market Analysis, Insights and Forecast - by Consumption Analysis
- 8.3. Market Analysis, Insights and Forecast - by Import Market Analysis (Value & Volume)
- 8.4. Market Analysis, Insights and Forecast - by Export Market Analysis (Value & Volume)
- 8.5. Market Analysis, Insights and Forecast - by Price Trend Analysis
- 8.1. Market Analysis, Insights and Forecast - by Production Analysis
- 9. Middle East & Africa US Furniture Market Analysis, Insights and Forecast, 2019-2031
- 9.1. Market Analysis, Insights and Forecast - by Production Analysis
- 9.2. Market Analysis, Insights and Forecast - by Consumption Analysis
- 9.3. Market Analysis, Insights and Forecast - by Import Market Analysis (Value & Volume)
- 9.4. Market Analysis, Insights and Forecast - by Export Market Analysis (Value & Volume)
- 9.5. Market Analysis, Insights and Forecast - by Price Trend Analysis
- 9.1. Market Analysis, Insights and Forecast - by Production Analysis
- 10. Asia Pacific US Furniture Market Analysis, Insights and Forecast, 2019-2031
- 10.1. Market Analysis, Insights and Forecast - by Production Analysis
- 10.2. Market Analysis, Insights and Forecast - by Consumption Analysis
- 10.3. Market Analysis, Insights and Forecast - by Import Market Analysis (Value & Volume)
- 10.4. Market Analysis, Insights and Forecast - by Export Market Analysis (Value & Volume)
- 10.5. Market Analysis, Insights and Forecast - by Price Trend Analysis
- 10.1. Market Analysis, Insights and Forecast - by Production Analysis
- 11. Northeast US Furniture Market Analysis, Insights and Forecast, 2019-2031
- 12. Southeast US Furniture Market Analysis, Insights and Forecast, 2019-2031
- 13. Midwest US Furniture Market Analysis, Insights and Forecast, 2019-2031
- 14. Southwest US Furniture Market Analysis, Insights and Forecast, 2019-2031
- 15. West US Furniture Market Analysis, Insights and Forecast, 2019-2031
- 16. Competitive Analysis
- 16.1. Global Market Share Analysis 2024
- 16.2. Company Profiles
- 16.2.1 5 Inter IKEA Holding SA**List Not Exhaustive
- 16.2.1.1. Overview
- 16.2.1.2. Products
- 16.2.1.3. SWOT Analysis
- 16.2.1.4. Recent Developments
- 16.2.1.5. Financials (Based on Availability)
- 16.2.2 2 American Signature Inc
- 16.2.2.1. Overview
- 16.2.2.2. Products
- 16.2.2.3. SWOT Analysis
- 16.2.2.4. Recent Developments
- 16.2.2.5. Financials (Based on Availability)
- 16.2.3 2 Rooms to Go Inc
- 16.2.3.1. Overview
- 16.2.3.2. Products
- 16.2.3.3. SWOT Analysis
- 16.2.3.4. Recent Developments
- 16.2.3.5. Financials (Based on Availability)
- 16.2.4 Retailers
- 16.2.4.1. Overview
- 16.2.4.2. Products
- 16.2.4.3. SWOT Analysis
- 16.2.4.4. Recent Developments
- 16.2.4.5. Financials (Based on Availability)
- 16.2.5 4 Wayfair Inc *
- 16.2.5.1. Overview
- 16.2.5.2. Products
- 16.2.5.3. SWOT Analysis
- 16.2.5.4. Recent Developments
- 16.2.5.5. Financials (Based on Availability)
- 16.2.6 3 Crate and Barrel
- 16.2.6.1. Overview
- 16.2.6.2. Products
- 16.2.6.3. SWOT Analysis
- 16.2.6.4. Recent Developments
- 16.2.6.5. Financials (Based on Availability)
- 16.2.7 3 Williams-Sonoma Inc
- 16.2.7.1. Overview
- 16.2.7.2. Products
- 16.2.7.3. SWOT Analysis
- 16.2.7.4. Recent Developments
- 16.2.7.5. Financials (Based on Availability)
- 16.2.8 4 La-Z-Boy
- 16.2.8.1. Overview
- 16.2.8.2. Products
- 16.2.8.3. SWOT Analysis
- 16.2.8.4. Recent Developments
- 16.2.8.5. Financials (Based on Availability)
- 16.2.9 1 Ashley Furniture Store
- 16.2.9.1. Overview
- 16.2.9.2. Products
- 16.2.9.3. SWOT Analysis
- 16.2.9.4. Recent Developments
- 16.2.9.5. Financials (Based on Availability)
- 16.2.10 1 Bed Bath & Beyond Inc
- 16.2.10.1. Overview
- 16.2.10.2. Products
- 16.2.10.3. SWOT Analysis
- 16.2.10.4. Recent Developments
- 16.2.10.5. Financials (Based on Availability)
- 16.2.11 Manufacturers
- 16.2.11.1. Overview
- 16.2.11.2. Products
- 16.2.11.3. SWOT Analysis
- 16.2.11.4. Recent Developments
- 16.2.11.5. Financials (Based on Availability)
- 16.2.1 5 Inter IKEA Holding SA**List Not Exhaustive
List of Figures
- Figure 1: Global US Furniture Market Revenue Breakdown (Million, %) by Region 2024 & 2032
- Figure 2: United states US Furniture Market Revenue (Million), by Country 2024 & 2032
- Figure 3: United states US Furniture Market Revenue Share (%), by Country 2024 & 2032
- Figure 4: North America US Furniture Market Revenue (Million), by Production Analysis 2024 & 2032
- Figure 5: North America US Furniture Market Revenue Share (%), by Production Analysis 2024 & 2032
- Figure 6: North America US Furniture Market Revenue (Million), by Consumption Analysis 2024 & 2032
- Figure 7: North America US Furniture Market Revenue Share (%), by Consumption Analysis 2024 & 2032
- Figure 8: North America US Furniture Market Revenue (Million), by Import Market Analysis (Value & Volume) 2024 & 2032
- Figure 9: North America US Furniture Market Revenue Share (%), by Import Market Analysis (Value & Volume) 2024 & 2032
- Figure 10: North America US Furniture Market Revenue (Million), by Export Market Analysis (Value & Volume) 2024 & 2032
- Figure 11: North America US Furniture Market Revenue Share (%), by Export Market Analysis (Value & Volume) 2024 & 2032
- Figure 12: North America US Furniture Market Revenue (Million), by Price Trend Analysis 2024 & 2032
- Figure 13: North America US Furniture Market Revenue Share (%), by Price Trend Analysis 2024 & 2032
- Figure 14: North America US Furniture Market Revenue (Million), by Country 2024 & 2032
- Figure 15: North America US Furniture Market Revenue Share (%), by Country 2024 & 2032
- Figure 16: South America US Furniture Market Revenue (Million), by Production Analysis 2024 & 2032
- Figure 17: South America US Furniture Market Revenue Share (%), by Production Analysis 2024 & 2032
- Figure 18: South America US Furniture Market Revenue (Million), by Consumption Analysis 2024 & 2032
- Figure 19: South America US Furniture Market Revenue Share (%), by Consumption Analysis 2024 & 2032
- Figure 20: South America US Furniture Market Revenue (Million), by Import Market Analysis (Value & Volume) 2024 & 2032
- Figure 21: South America US Furniture Market Revenue Share (%), by Import Market Analysis (Value & Volume) 2024 & 2032
- Figure 22: South America US Furniture Market Revenue (Million), by Export Market Analysis (Value & Volume) 2024 & 2032
- Figure 23: South America US Furniture Market Revenue Share (%), by Export Market Analysis (Value & Volume) 2024 & 2032
- Figure 24: South America US Furniture Market Revenue (Million), by Price Trend Analysis 2024 & 2032
- Figure 25: South America US Furniture Market Revenue Share (%), by Price Trend Analysis 2024 & 2032
- Figure 26: South America US Furniture Market Revenue (Million), by Country 2024 & 2032
- Figure 27: South America US Furniture Market Revenue Share (%), by Country 2024 & 2032
- Figure 28: Europe US Furniture Market Revenue (Million), by Production Analysis 2024 & 2032
- Figure 29: Europe US Furniture Market Revenue Share (%), by Production Analysis 2024 & 2032
- Figure 30: Europe US Furniture Market Revenue (Million), by Consumption Analysis 2024 & 2032
- Figure 31: Europe US Furniture Market Revenue Share (%), by Consumption Analysis 2024 & 2032
- Figure 32: Europe US Furniture Market Revenue (Million), by Import Market Analysis (Value & Volume) 2024 & 2032
- Figure 33: Europe US Furniture Market Revenue Share (%), by Import Market Analysis (Value & Volume) 2024 & 2032
- Figure 34: Europe US Furniture Market Revenue (Million), by Export Market Analysis (Value & Volume) 2024 & 2032
- Figure 35: Europe US Furniture Market Revenue Share (%), by Export Market Analysis (Value & Volume) 2024 & 2032
- Figure 36: Europe US Furniture Market Revenue (Million), by Price Trend Analysis 2024 & 2032
- Figure 37: Europe US Furniture Market Revenue Share (%), by Price Trend Analysis 2024 & 2032
- Figure 38: Europe US Furniture Market Revenue (Million), by Country 2024 & 2032
- Figure 39: Europe US Furniture Market Revenue Share (%), by Country 2024 & 2032
- Figure 40: Middle East & Africa US Furniture Market Revenue (Million), by Production Analysis 2024 & 2032
- Figure 41: Middle East & Africa US Furniture Market Revenue Share (%), by Production Analysis 2024 & 2032
- Figure 42: Middle East & Africa US Furniture Market Revenue (Million), by Consumption Analysis 2024 & 2032
- Figure 43: Middle East & Africa US Furniture Market Revenue Share (%), by Consumption Analysis 2024 & 2032
- Figure 44: Middle East & Africa US Furniture Market Revenue (Million), by Import Market Analysis (Value & Volume) 2024 & 2032
- Figure 45: Middle East & Africa US Furniture Market Revenue Share (%), by Import Market Analysis (Value & Volume) 2024 & 2032
- Figure 46: Middle East & Africa US Furniture Market Revenue (Million), by Export Market Analysis (Value & Volume) 2024 & 2032
- Figure 47: Middle East & Africa US Furniture Market Revenue Share (%), by Export Market Analysis (Value & Volume) 2024 & 2032
- Figure 48: Middle East & Africa US Furniture Market Revenue (Million), by Price Trend Analysis 2024 & 2032
- Figure 49: Middle East & Africa US Furniture Market Revenue Share (%), by Price Trend Analysis 2024 & 2032
- Figure 50: Middle East & Africa US Furniture Market Revenue (Million), by Country 2024 & 2032
- Figure 51: Middle East & Africa US Furniture Market Revenue Share (%), by Country 2024 & 2032
- Figure 52: Asia Pacific US Furniture Market Revenue (Million), by Production Analysis 2024 & 2032
- Figure 53: Asia Pacific US Furniture Market Revenue Share (%), by Production Analysis 2024 & 2032
- Figure 54: Asia Pacific US Furniture Market Revenue (Million), by Consumption Analysis 2024 & 2032
- Figure 55: Asia Pacific US Furniture Market Revenue Share (%), by Consumption Analysis 2024 & 2032
- Figure 56: Asia Pacific US Furniture Market Revenue (Million), by Import Market Analysis (Value & Volume) 2024 & 2032
- Figure 57: Asia Pacific US Furniture Market Revenue Share (%), by Import Market Analysis (Value & Volume) 2024 & 2032
- Figure 58: Asia Pacific US Furniture Market Revenue (Million), by Export Market Analysis (Value & Volume) 2024 & 2032
- Figure 59: Asia Pacific US Furniture Market Revenue Share (%), by Export Market Analysis (Value & Volume) 2024 & 2032
- Figure 60: Asia Pacific US Furniture Market Revenue (Million), by Price Trend Analysis 2024 & 2032
- Figure 61: Asia Pacific US Furniture Market Revenue Share (%), by Price Trend Analysis 2024 & 2032
- Figure 62: Asia Pacific US Furniture Market Revenue (Million), by Country 2024 & 2032
- Figure 63: Asia Pacific US Furniture Market Revenue Share (%), by Country 2024 & 2032
List of Tables
- Table 1: Global US Furniture Market Revenue Million Forecast, by Region 2019 & 2032
- Table 2: Global US Furniture Market Revenue Million Forecast, by Production Analysis 2019 & 2032
- Table 3: Global US Furniture Market Revenue Million Forecast, by Consumption Analysis 2019 & 2032
- Table 4: Global US Furniture Market Revenue Million Forecast, by Import Market Analysis (Value & Volume) 2019 & 2032
- Table 5: Global US Furniture Market Revenue Million Forecast, by Export Market Analysis (Value & Volume) 2019 & 2032
- Table 6: Global US Furniture Market Revenue Million Forecast, by Price Trend Analysis 2019 & 2032
- Table 7: Global US Furniture Market Revenue Million Forecast, by Region 2019 & 2032
- Table 8: Global US Furniture Market Revenue Million Forecast, by Country 2019 & 2032
- Table 9: Northeast US Furniture Market Revenue (Million) Forecast, by Application 2019 & 2032
- Table 10: Southeast US Furniture Market Revenue (Million) Forecast, by Application 2019 & 2032
- Table 11: Midwest US Furniture Market Revenue (Million) Forecast, by Application 2019 & 2032
- Table 12: Southwest US Furniture Market Revenue (Million) Forecast, by Application 2019 & 2032
- Table 13: West US Furniture Market Revenue (Million) Forecast, by Application 2019 & 2032
- Table 14: Global US Furniture Market Revenue Million Forecast, by Production Analysis 2019 & 2032
- Table 15: Global US Furniture Market Revenue Million Forecast, by Consumption Analysis 2019 & 2032
- Table 16: Global US Furniture Market Revenue Million Forecast, by Import Market Analysis (Value & Volume) 2019 & 2032
- Table 17: Global US Furniture Market Revenue Million Forecast, by Export Market Analysis (Value & Volume) 2019 & 2032
- Table 18: Global US Furniture Market Revenue Million Forecast, by Price Trend Analysis 2019 & 2032
- Table 19: Global US Furniture Market Revenue Million Forecast, by Country 2019 & 2032
- Table 20: United States US Furniture Market Revenue (Million) Forecast, by Application 2019 & 2032
- Table 21: Canada US Furniture Market Revenue (Million) Forecast, by Application 2019 & 2032
- Table 22: Mexico US Furniture Market Revenue (Million) Forecast, by Application 2019 & 2032
- Table 23: Global US Furniture Market Revenue Million Forecast, by Production Analysis 2019 & 2032
- Table 24: Global US Furniture Market Revenue Million Forecast, by Consumption Analysis 2019 & 2032
- Table 25: Global US Furniture Market Revenue Million Forecast, by Import Market Analysis (Value & Volume) 2019 & 2032
- Table 26: Global US Furniture Market Revenue Million Forecast, by Export Market Analysis (Value & Volume) 2019 & 2032
- Table 27: Global US Furniture Market Revenue Million Forecast, by Price Trend Analysis 2019 & 2032
- Table 28: Global US Furniture Market Revenue Million Forecast, by Country 2019 & 2032
- Table 29: Brazil US Furniture Market Revenue (Million) Forecast, by Application 2019 & 2032
- Table 30: Argentina US Furniture Market Revenue (Million) Forecast, by Application 2019 & 2032
- Table 31: Rest of South America US Furniture Market Revenue (Million) Forecast, by Application 2019 & 2032
- Table 32: Global US Furniture Market Revenue Million Forecast, by Production Analysis 2019 & 2032
- Table 33: Global US Furniture Market Revenue Million Forecast, by Consumption Analysis 2019 & 2032
- Table 34: Global US Furniture Market Revenue Million Forecast, by Import Market Analysis (Value & Volume) 2019 & 2032
- Table 35: Global US Furniture Market Revenue Million Forecast, by Export Market Analysis (Value & Volume) 2019 & 2032
- Table 36: Global US Furniture Market Revenue Million Forecast, by Price Trend Analysis 2019 & 2032
- Table 37: Global US Furniture Market Revenue Million Forecast, by Country 2019 & 2032
- Table 38: United Kingdom US Furniture Market Revenue (Million) Forecast, by Application 2019 & 2032
- Table 39: Germany US Furniture Market Revenue (Million) Forecast, by Application 2019 & 2032
- Table 40: France US Furniture Market Revenue (Million) Forecast, by Application 2019 & 2032
- Table 41: Italy US Furniture Market Revenue (Million) Forecast, by Application 2019 & 2032
- Table 42: Spain US Furniture Market Revenue (Million) Forecast, by Application 2019 & 2032
- Table 43: Russia US Furniture Market Revenue (Million) Forecast, by Application 2019 & 2032
- Table 44: Benelux US Furniture Market Revenue (Million) Forecast, by Application 2019 & 2032
- Table 45: Nordics US Furniture Market Revenue (Million) Forecast, by Application 2019 & 2032
- Table 46: Rest of Europe US Furniture Market Revenue (Million) Forecast, by Application 2019 & 2032
- Table 47: Global US Furniture Market Revenue Million Forecast, by Production Analysis 2019 & 2032
- Table 48: Global US Furniture Market Revenue Million Forecast, by Consumption Analysis 2019 & 2032
- Table 49: Global US Furniture Market Revenue Million Forecast, by Import Market Analysis (Value & Volume) 2019 & 2032
- Table 50: Global US Furniture Market Revenue Million Forecast, by Export Market Analysis (Value & Volume) 2019 & 2032
- Table 51: Global US Furniture Market Revenue Million Forecast, by Price Trend Analysis 2019 & 2032
- Table 52: Global US Furniture Market Revenue Million Forecast, by Country 2019 & 2032
- Table 53: Turkey US Furniture Market Revenue (Million) Forecast, by Application 2019 & 2032
- Table 54: Israel US Furniture Market Revenue (Million) Forecast, by Application 2019 & 2032
- Table 55: GCC US Furniture Market Revenue (Million) Forecast, by Application 2019 & 2032
- Table 56: North Africa US Furniture Market Revenue (Million) Forecast, by Application 2019 & 2032
- Table 57: South Africa US Furniture Market Revenue (Million) Forecast, by Application 2019 & 2032
- Table 58: Rest of Middle East & Africa US Furniture Market Revenue (Million) Forecast, by Application 2019 & 2032
- Table 59: Global US Furniture Market Revenue Million Forecast, by Production Analysis 2019 & 2032
- Table 60: Global US Furniture Market Revenue Million Forecast, by Consumption Analysis 2019 & 2032
- Table 61: Global US Furniture Market Revenue Million Forecast, by Import Market Analysis (Value & Volume) 2019 & 2032
- Table 62: Global US Furniture Market Revenue Million Forecast, by Export Market Analysis (Value & Volume) 2019 & 2032
- Table 63: Global US Furniture Market Revenue Million Forecast, by Price Trend Analysis 2019 & 2032
- Table 64: Global US Furniture Market Revenue Million Forecast, by Country 2019 & 2032
- Table 65: China US Furniture Market Revenue (Million) Forecast, by Application 2019 & 2032
- Table 66: India US Furniture Market Revenue (Million) Forecast, by Application 2019 & 2032
- Table 67: Japan US Furniture Market Revenue (Million) Forecast, by Application 2019 & 2032
- Table 68: South Korea US Furniture Market Revenue (Million) Forecast, by Application 2019 & 2032
- Table 69: ASEAN US Furniture Market Revenue (Million) Forecast, by Application 2019 & 2032
- Table 70: Oceania US Furniture Market Revenue (Million) Forecast, by Application 2019 & 2032
- Table 71: Rest of Asia Pacific US Furniture Market Revenue (Million) Forecast, by Application 2019 & 2032
Frequently Asked Questions
1. What is the projected Compound Annual Growth Rate (CAGR) of the US Furniture Market?
The projected CAGR is approximately > 3.00%.
2. Which companies are prominent players in the US Furniture Market?
Key companies in the market include 5 Inter IKEA Holding SA**List Not Exhaustive, 2 American Signature Inc, 2 Rooms to Go Inc, Retailers, 4 Wayfair Inc *, 3 Crate and Barrel, 3 Williams-Sonoma Inc, 4 La-Z-Boy, 1 Ashley Furniture Store, 1 Bed Bath & Beyond Inc, Manufacturers.
3. What are the main segments of the US Furniture Market?
The market segments include Production Analysis, Consumption Analysis, Import Market Analysis (Value & Volume), Export Market Analysis (Value & Volume), Price Trend Analysis.
4. Can you provide details about the market size?
The market size is estimated to be USD XX Million as of 2022.
5. What are some drivers contributing to market growth?
Rising Urbanization and Population Growth; Growth in the Construction Industry is Driving the Market.
6. What are the notable trends driving market growth?
Growing Sales of Bedroom Furniture is Driving the Market.
7. Are there any restraints impacting market growth?
Economic Uncertainty; Increasing Competition in the Market.
8. Can you provide examples of recent developments in the market?
N/A
9. What pricing options are available for accessing the report?
Pricing options include single-user, multi-user, and enterprise licenses priced at USD 3800, USD 4500, and USD 5800 respectively.
10. Is the market size provided in terms of value or volume?
The market size is provided in terms of value, measured in Million.
11. Are there any specific market keywords associated with the report?
Yes, the market keyword associated with the report is "US Furniture Market," which aids in identifying and referencing the specific market segment covered.
12. How do I determine which pricing option suits my needs best?
The pricing options vary based on user requirements and access needs. Individual users may opt for single-user licenses, while businesses requiring broader access may choose multi-user or enterprise licenses for cost-effective access to the report.
13. Are there any additional resources or data provided in the US Furniture Market report?
While the report offers comprehensive insights, it's advisable to review the specific contents or supplementary materials provided to ascertain if additional resources or data are available.
14. How can I stay updated on further developments or reports in the US Furniture Market?
To stay informed about further developments, trends, and reports in the US Furniture Market, consider subscribing to industry newsletters, following relevant companies and organizations, or regularly checking reputable industry news sources and publications.
Methodology
Step 1 - Identification of Relevant Samples Size from Population Database


Step 2 - Approaches for Defining Global Market Size (Value, Volume* & Price*)

Note*: In applicable scenarios
Step 3 - Data Sources
Primary Research
- Web Analytics
- Survey Reports
- Research Institute
- Latest Research Reports
- Opinion Leaders
Secondary Research
- Annual Reports
- White Paper
- Latest Press Release
- Industry Association
- Paid Database
- Investor Presentations

Step 4 - Data Triangulation
Involves using different sources of information in order to increase the validity of a study
These sources are likely to be stakeholders in a program - participants, other researchers, program staff, other community members, and so on.
Then we put all data in single framework & apply various statistical tools to find out the dynamic on the market.
During the analysis stage, feedback from the stakeholder groups would be compared to determine areas of agreement as well as areas of divergence
