

Key Insights
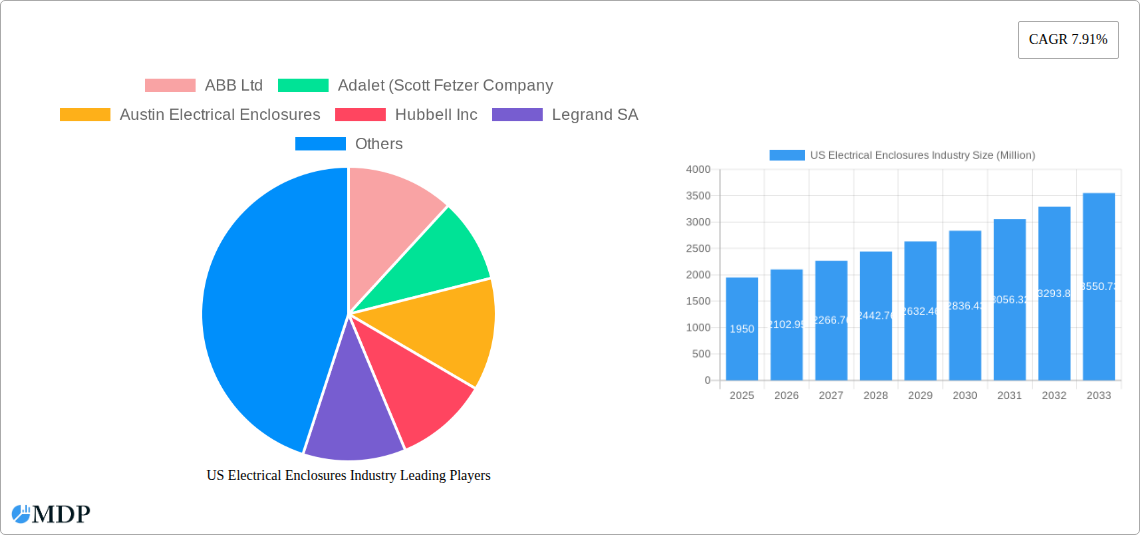
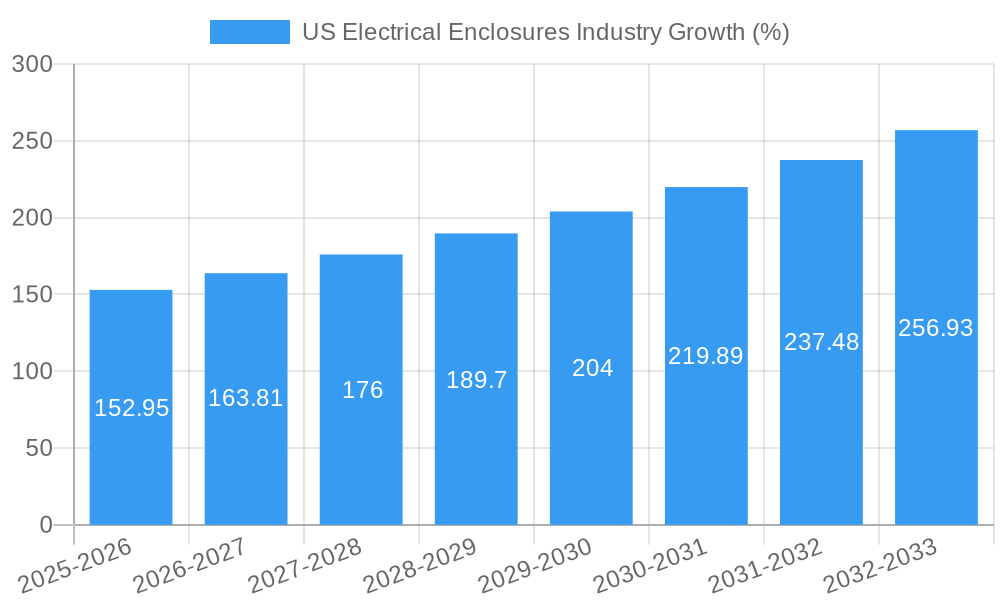
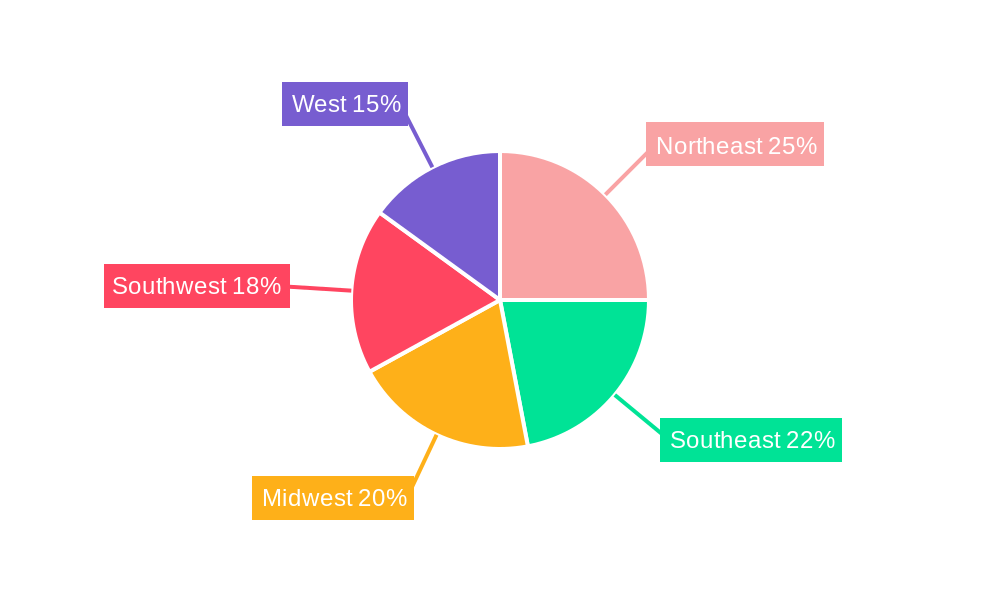
The US electrical enclosures market, valued at $1.95 billion in 2025, is poised for robust growth, exhibiting a Compound Annual Growth Rate (CAGR) of 7.91% from 2025 to 2033. This expansion is driven by several key factors. The ongoing surge in industrial automation and the increasing adoption of smart technologies across various sectors, including manufacturing, power generation, and transportation, are fueling demand for reliable and sophisticated electrical enclosures. Furthermore, stringent safety regulations and the need for enhanced protection against environmental factors are contributing to market growth. The residential segment, driven by smart home installations and renovations, is also experiencing considerable growth. Within material types, metallic enclosures maintain a significant market share due to their durability and robust performance characteristics; however, the demand for lightweight, corrosion-resistant non-metallic alternatives is steadily increasing. Geographic growth is expected to be relatively uniform across the US, although regions with established industrial bases and ongoing infrastructure development projects, such as the Northeast and West, might see slightly faster growth rates. Major players like ABB, Siemens, and Eaton are leveraging technological advancements and strategic partnerships to consolidate their market positions.
Competition is intense, with established players and emerging companies vying for market share. Key strategies for success include product innovation, focusing on customized solutions for specific end-user needs, and expanding distribution networks. The market faces some challenges, including fluctuating raw material prices and potential supply chain disruptions. However, the long-term outlook for the US electrical enclosures market remains positive, fueled by sustained investments in infrastructure, technological advancements in automation and renewable energy, and a growing emphasis on safety and environmental protection across diverse industrial sectors. The market segmentation across end-users (industrial, commercial, residential), material types (metallic, non-metallic), and applications (power generation, transportation, etc.) provides opportunities for specialized players to focus their efforts and gain a competitive advantage.
US Electrical Enclosures Industry Market Report: 2019-2033
This comprehensive report provides an in-depth analysis of the US Electrical Enclosures industry, covering market dynamics, trends, leading players, and future growth prospects. With a study period spanning 2019-2033 (base year 2025), this report offers invaluable insights for industry stakeholders, investors, and strategic decision-makers. The report utilizes robust data analysis to project a xx Million USD market size by 2033, showcasing a compelling CAGR of xx% during the forecast period (2025-2033).
US Electrical Enclosures Industry Market Dynamics & Concentration
The US electrical enclosures market is characterized by a moderately concentrated landscape with key players such as ABB Ltd, Hubbell Inc, Legrand SA, and Siemens AG holding significant market share. The market's dynamics are shaped by several factors, including:
- Innovation Drivers: Technological advancements in materials (e.g., lightweight composites), smart enclosures with integrated sensors and connectivity, and improved manufacturing techniques are driving innovation.
- Regulatory Frameworks: Compliance with safety and environmental regulations (like UL and NEC standards) significantly impacts product design and manufacturing processes. Stringent regulations drive adoption of higher-quality, safer enclosures.
- Product Substitutes: While metallic enclosures remain dominant, the market is witnessing growing adoption of non-metallic alternatives like plastic enclosures, particularly in specific applications where cost or weight are key considerations. This substitution is creating competitive pressures.
- End-User Trends: The increasing demand for automation and digitalization across various end-user segments (industrial, commercial, and residential) is driving growth in the electrical enclosures market. Industrial automation, in particular, is a major growth driver.
- M&A Activities: The industry has witnessed a moderate number of mergers and acquisitions (M&A) deals in recent years, with larger players acquiring smaller companies to expand their product portfolio and market reach. An estimated xx M&A deals occurred between 2019 and 2024, contributing to market consolidation. This consolidation leads to increased market concentration, as larger companies gain more market share.
US Electrical Enclosures Industry Industry Trends & Analysis
The US electrical enclosures market is experiencing robust growth, propelled by several key trends:
The market is expanding due to increased infrastructural development across various sectors, including industrial automation, renewable energy installations, and smart building initiatives. The rising adoption of smart technologies in buildings and industrial facilities is a notable driver, demanding more sophisticated and technologically advanced enclosures. These technologically advanced enclosures incorporate features like improved heat dissipation, enhanced protection against environmental factors, and embedded sensors for monitoring and control. A significant trend influencing the market is the shift toward sustainable and environmentally friendly manufacturing practices. Companies are increasingly focusing on using recycled materials and adopting energy-efficient production methods to reduce their environmental footprint. This focus on sustainability is not only driven by environmental concerns but also by consumer demand for greener products and government regulations promoting eco-conscious practices. Competition in the market is intense, with both established players and new entrants vying for market share. This intense competition leads to continuous innovation, price optimization, and customer-centric solutions.
Leading Markets & Segments in US Electrical Enclosures Industry
- By End-User: The industrial sector dominates the market, driven by the high demand for electrical enclosures in manufacturing, automation, and process industries. Commercial applications represent the second-largest segment due to the growth in construction and modernization of commercial buildings. Residential applications contribute a smaller share, primarily driven by home automation and electrical upgrades.
- By Material Type: Metallic enclosures continue to hold the largest market share due to their durability and protective capabilities. However, the non-metallic segment is experiencing growth, primarily driven by applications requiring lighter weight, lower cost, and corrosion resistance.
- By Application: Power generation and distribution, and the industrial sectors (Metal and Mining, Oil and Gas, and Process Industries) are the leading applications, driven by the large-scale infrastructure projects and industrial expansions.
The robust growth of the Industrial sector is attributed to continuous expansion in manufacturing facilities, increased automation, and the growing demand for sophisticated industrial processes. The key drivers for this dominance include government initiatives promoting industrial growth, continuous technological advancements in the industrial sector, and robust investment in manufacturing and infrastructure.
US Electrical Enclosures Industry Product Developments
Recent product innovations focus on smart features, improved durability, and enhanced safety. Manufacturers are incorporating advanced materials, improved sealing techniques, and integrated monitoring systems to enhance product performance and cater to the evolving needs of diverse applications. The market is witnessing a shift towards modular and customizable enclosure solutions, providing flexibility and adaptability for various applications. This trend provides manufacturers with a competitive advantage by offering tailored solutions to specific customer requirements and boosting market penetration.
Key Drivers of US Electrical Enclosures Industry Growth
The growth of the US electrical enclosures market is driven by a confluence of factors:
- Technological advancements: The incorporation of smart features, improved materials, and advanced manufacturing techniques are enhancing product capabilities and expanding market applications.
- Economic growth: Increased industrial activity and infrastructure development drive demand for electrical enclosures across diverse sectors.
- Regulatory compliance: Stringent safety and environmental regulations are mandating the use of high-quality and compliant enclosures.
Challenges in the US Electrical Enclosures Industry Market
The market faces challenges such as:
- Supply chain disruptions: Fluctuations in raw material prices and global supply chain complexities impact production costs and lead times.
- Intense competition: The presence of numerous established players and new entrants creates intense competition, putting pressure on pricing and margins.
- Regulatory hurdles: Compliance with evolving safety and environmental regulations necessitates continuous product development and adaptation, increasing costs and complexity.
Emerging Opportunities in US Electrical Enclosures Industry
Emerging opportunities include:
- Expansion into emerging markets: Growth in developing economies presents opportunities for expansion and increased market penetration.
- Strategic partnerships: Collaborations with technology providers and end-users enable the development of innovative enclosure solutions and expand market reach.
- Focus on sustainable practices: The adoption of eco-friendly materials and manufacturing processes opens new market avenues and enhances brand reputation.
Leading Players in the US Electrical Enclosures Industry Sector
- ABB Ltd
- Adalet (Scott Fetzer Company)
- Austin Electrical Enclosures
- Hubbell Inc
- Legrand SA
- Emerson Electric Co
- Siemens AG
- Schneider Electric SE
- Rittal GmbH & Co Kg
- AZZ Inc
- Nvent Electric PLC
- Hammond Manufacturing Ltd
- Eaton Corporation
Key Milestones in US Electrical Enclosures Industry Industry
- August 2021: Hammond Manufacturing Ltd announced a USD 24 Million expansion, adding painting and metal fabrication capacity. This expansion signals increased production capacity and reflects growing market demand.
- March 2021: Hubbell Control Solutions launched the NX Distributed Intelligence Lighting Control Panel (NXP2 Series), offering a centralized connection point solution that reduces deployment time and costs. This product launch demonstrates innovation within the industry and addresses market needs for cost-effective and efficient solutions.
Strategic Outlook for US Electrical Enclosures Industry Market
The US electrical enclosures market is poised for continued growth, driven by technological innovation, infrastructure development, and the increasing adoption of automation across various sectors. Strategic opportunities lie in developing customized solutions, focusing on sustainable manufacturing practices, and exploring partnerships to expand market reach and enhance product offerings. The market's future hinges on adapting to evolving technological advancements, addressing supply chain challenges, and catering to increasingly demanding customer needs.
US Electrical Enclosures Industry Segmentation
-
1. Material Type
- 1.1. Metallic
- 1.2. Non-metallic
-
2. Application
- 2.1. Power Generation and Distribution
- 2.2. Metal and Mining
- 2.3. Transportation
- 2.4. Oil and Gas
- 2.5. Commercial Spaces and Buildings
- 2.6. Process Industries
- 2.7. Other Applications
-
3. End-User
- 3.1. Industrial
- 3.2. Commercial
- 3.3. Residential
US Electrical Enclosures Industry Segmentation By Geography
-
1. North America
- 1.1. United States
- 1.2. Canada
- 1.3. Mexico
-
2. South America
- 2.1. Brazil
- 2.2. Argentina
- 2.3. Rest of South America
-
3. Europe
- 3.1. United Kingdom
- 3.2. Germany
- 3.3. France
- 3.4. Italy
- 3.5. Spain
- 3.6. Russia
- 3.7. Benelux
- 3.8. Nordics
- 3.9. Rest of Europe
-
4. Middle East & Africa
- 4.1. Turkey
- 4.2. Israel
- 4.3. GCC
- 4.4. North Africa
- 4.5. South Africa
- 4.6. Rest of Middle East & Africa
-
5. Asia Pacific
- 5.1. China
- 5.2. India
- 5.3. Japan
- 5.4. South Korea
- 5.5. ASEAN
- 5.6. Oceania
- 5.7. Rest of Asia Pacific
US Electrical Enclosures Industry REPORT HIGHLIGHTS
| Aspects | Details |
|---|---|
| Study Period | 2019-2033 |
| Base Year | 2024 |
| Estimated Year | 2025 |
| Forecast Period | 2025-2033 |
| Historical Period | 2019-2024 |
| Growth Rate | CAGR of 7.91% from 2019-2033 |
| Segmentation |
|
Table of Contents
- 1. Introduction
- 1.1. Research Scope
- 1.2. Market Segmentation
- 1.3. Research Methodology
- 1.4. Definitions and Assumptions
- 2. Executive Summary
- 2.1. Introduction
- 3. Market Dynamics
- 3.1. Introduction
- 3.2. Market Drivers
- 3.2.1. Growing Consumption and Capacity of Renewable Energy; Aging Power Generation and Distribution Network
- 3.3. Market Restrains
- 3.3.1. Economic Slowdown in Industries
- 3.4. Market Trends
- 3.4.1. Commercial spaces and buildings industry to drive the market demand
- 4. Market Factor Analysis
- 4.1. Porters Five Forces
- 4.2. Supply/Value Chain
- 4.3. PESTEL analysis
- 4.4. Market Entropy
- 4.5. Patent/Trademark Analysis
- 5. Global US Electrical Enclosures Industry Analysis, Insights and Forecast, 2019-2031
- 5.1. Market Analysis, Insights and Forecast - by Material Type
- 5.1.1. Metallic
- 5.1.2. Non-metallic
- 5.2. Market Analysis, Insights and Forecast - by Application
- 5.2.1. Power Generation and Distribution
- 5.2.2. Metal and Mining
- 5.2.3. Transportation
- 5.2.4. Oil and Gas
- 5.2.5. Commercial Spaces and Buildings
- 5.2.6. Process Industries
- 5.2.7. Other Applications
- 5.3. Market Analysis, Insights and Forecast - by End-User
- 5.3.1. Industrial
- 5.3.2. Commercial
- 5.3.3. Residential
- 5.4. Market Analysis, Insights and Forecast - by Region
- 5.4.1. North America
- 5.4.2. South America
- 5.4.3. Europe
- 5.4.4. Middle East & Africa
- 5.4.5. Asia Pacific
- 5.1. Market Analysis, Insights and Forecast - by Material Type
- 6. North America US Electrical Enclosures Industry Analysis, Insights and Forecast, 2019-2031
- 6.1. Market Analysis, Insights and Forecast - by Material Type
- 6.1.1. Metallic
- 6.1.2. Non-metallic
- 6.2. Market Analysis, Insights and Forecast - by Application
- 6.2.1. Power Generation and Distribution
- 6.2.2. Metal and Mining
- 6.2.3. Transportation
- 6.2.4. Oil and Gas
- 6.2.5. Commercial Spaces and Buildings
- 6.2.6. Process Industries
- 6.2.7. Other Applications
- 6.3. Market Analysis, Insights and Forecast - by End-User
- 6.3.1. Industrial
- 6.3.2. Commercial
- 6.3.3. Residential
- 6.1. Market Analysis, Insights and Forecast - by Material Type
- 7. South America US Electrical Enclosures Industry Analysis, Insights and Forecast, 2019-2031
- 7.1. Market Analysis, Insights and Forecast - by Material Type
- 7.1.1. Metallic
- 7.1.2. Non-metallic
- 7.2. Market Analysis, Insights and Forecast - by Application
- 7.2.1. Power Generation and Distribution
- 7.2.2. Metal and Mining
- 7.2.3. Transportation
- 7.2.4. Oil and Gas
- 7.2.5. Commercial Spaces and Buildings
- 7.2.6. Process Industries
- 7.2.7. Other Applications
- 7.3. Market Analysis, Insights and Forecast - by End-User
- 7.3.1. Industrial
- 7.3.2. Commercial
- 7.3.3. Residential
- 7.1. Market Analysis, Insights and Forecast - by Material Type
- 8. Europe US Electrical Enclosures Industry Analysis, Insights and Forecast, 2019-2031
- 8.1. Market Analysis, Insights and Forecast - by Material Type
- 8.1.1. Metallic
- 8.1.2. Non-metallic
- 8.2. Market Analysis, Insights and Forecast - by Application
- 8.2.1. Power Generation and Distribution
- 8.2.2. Metal and Mining
- 8.2.3. Transportation
- 8.2.4. Oil and Gas
- 8.2.5. Commercial Spaces and Buildings
- 8.2.6. Process Industries
- 8.2.7. Other Applications
- 8.3. Market Analysis, Insights and Forecast - by End-User
- 8.3.1. Industrial
- 8.3.2. Commercial
- 8.3.3. Residential
- 8.1. Market Analysis, Insights and Forecast - by Material Type
- 9. Middle East & Africa US Electrical Enclosures Industry Analysis, Insights and Forecast, 2019-2031
- 9.1. Market Analysis, Insights and Forecast - by Material Type
- 9.1.1. Metallic
- 9.1.2. Non-metallic
- 9.2. Market Analysis, Insights and Forecast - by Application
- 9.2.1. Power Generation and Distribution
- 9.2.2. Metal and Mining
- 9.2.3. Transportation
- 9.2.4. Oil and Gas
- 9.2.5. Commercial Spaces and Buildings
- 9.2.6. Process Industries
- 9.2.7. Other Applications
- 9.3. Market Analysis, Insights and Forecast - by End-User
- 9.3.1. Industrial
- 9.3.2. Commercial
- 9.3.3. Residential
- 9.1. Market Analysis, Insights and Forecast - by Material Type
- 10. Asia Pacific US Electrical Enclosures Industry Analysis, Insights and Forecast, 2019-2031
- 10.1. Market Analysis, Insights and Forecast - by Material Type
- 10.1.1. Metallic
- 10.1.2. Non-metallic
- 10.2. Market Analysis, Insights and Forecast - by Application
- 10.2.1. Power Generation and Distribution
- 10.2.2. Metal and Mining
- 10.2.3. Transportation
- 10.2.4. Oil and Gas
- 10.2.5. Commercial Spaces and Buildings
- 10.2.6. Process Industries
- 10.2.7. Other Applications
- 10.3. Market Analysis, Insights and Forecast - by End-User
- 10.3.1. Industrial
- 10.3.2. Commercial
- 10.3.3. Residential
- 10.1. Market Analysis, Insights and Forecast - by Material Type
- 11. Northeast US Electrical Enclosures Industry Analysis, Insights and Forecast, 2019-2031
- 12. Southeast US Electrical Enclosures Industry Analysis, Insights and Forecast, 2019-2031
- 13. Midwest US Electrical Enclosures Industry Analysis, Insights and Forecast, 2019-2031
- 14. Southwest US Electrical Enclosures Industry Analysis, Insights and Forecast, 2019-2031
- 15. West US Electrical Enclosures Industry Analysis, Insights and Forecast, 2019-2031
- 16. Competitive Analysis
- 16.1. Global Market Share Analysis 2024
- 16.2. Company Profiles
- 16.2.1 ABB Ltd
- 16.2.1.1. Overview
- 16.2.1.2. Products
- 16.2.1.3. SWOT Analysis
- 16.2.1.4. Recent Developments
- 16.2.1.5. Financials (Based on Availability)
- 16.2.2 Adalet (Scott Fetzer Company
- 16.2.2.1. Overview
- 16.2.2.2. Products
- 16.2.2.3. SWOT Analysis
- 16.2.2.4. Recent Developments
- 16.2.2.5. Financials (Based on Availability)
- 16.2.3 Austin Electrical Enclosures
- 16.2.3.1. Overview
- 16.2.3.2. Products
- 16.2.3.3. SWOT Analysis
- 16.2.3.4. Recent Developments
- 16.2.3.5. Financials (Based on Availability)
- 16.2.4 Hubbell Inc
- 16.2.4.1. Overview
- 16.2.4.2. Products
- 16.2.4.3. SWOT Analysis
- 16.2.4.4. Recent Developments
- 16.2.4.5. Financials (Based on Availability)
- 16.2.5 Legrand SA
- 16.2.5.1. Overview
- 16.2.5.2. Products
- 16.2.5.3. SWOT Analysis
- 16.2.5.4. Recent Developments
- 16.2.5.5. Financials (Based on Availability)
- 16.2.6 Emerson Electric Co
- 16.2.6.1. Overview
- 16.2.6.2. Products
- 16.2.6.3. SWOT Analysis
- 16.2.6.4. Recent Developments
- 16.2.6.5. Financials (Based on Availability)
- 16.2.7 Siemens AG
- 16.2.7.1. Overview
- 16.2.7.2. Products
- 16.2.7.3. SWOT Analysis
- 16.2.7.4. Recent Developments
- 16.2.7.5. Financials (Based on Availability)
- 16.2.8 Schneider Electric SE
- 16.2.8.1. Overview
- 16.2.8.2. Products
- 16.2.8.3. SWOT Analysis
- 16.2.8.4. Recent Developments
- 16.2.8.5. Financials (Based on Availability)
- 16.2.9 Rittal GmbH & Co Kg
- 16.2.9.1. Overview
- 16.2.9.2. Products
- 16.2.9.3. SWOT Analysis
- 16.2.9.4. Recent Developments
- 16.2.9.5. Financials (Based on Availability)
- 16.2.10 AZZ Inc
- 16.2.10.1. Overview
- 16.2.10.2. Products
- 16.2.10.3. SWOT Analysis
- 16.2.10.4. Recent Developments
- 16.2.10.5. Financials (Based on Availability)
- 16.2.11 Nvent Electric PLC
- 16.2.11.1. Overview
- 16.2.11.2. Products
- 16.2.11.3. SWOT Analysis
- 16.2.11.4. Recent Developments
- 16.2.11.5. Financials (Based on Availability)
- 16.2.12 Hammond Manufacturing Ltd
- 16.2.12.1. Overview
- 16.2.12.2. Products
- 16.2.12.3. SWOT Analysis
- 16.2.12.4. Recent Developments
- 16.2.12.5. Financials (Based on Availability)
- 16.2.13 Eaton Corporation
- 16.2.13.1. Overview
- 16.2.13.2. Products
- 16.2.13.3. SWOT Analysis
- 16.2.13.4. Recent Developments
- 16.2.13.5. Financials (Based on Availability)
- 16.2.1 ABB Ltd
List of Figures
- Figure 1: Global US Electrical Enclosures Industry Revenue Breakdown (Million, %) by Region 2024 & 2032
- Figure 2: United states US Electrical Enclosures Industry Revenue (Million), by Country 2024 & 2032
- Figure 3: United states US Electrical Enclosures Industry Revenue Share (%), by Country 2024 & 2032
- Figure 4: North America US Electrical Enclosures Industry Revenue (Million), by Material Type 2024 & 2032
- Figure 5: North America US Electrical Enclosures Industry Revenue Share (%), by Material Type 2024 & 2032
- Figure 6: North America US Electrical Enclosures Industry Revenue (Million), by Application 2024 & 2032
- Figure 7: North America US Electrical Enclosures Industry Revenue Share (%), by Application 2024 & 2032
- Figure 8: North America US Electrical Enclosures Industry Revenue (Million), by End-User 2024 & 2032
- Figure 9: North America US Electrical Enclosures Industry Revenue Share (%), by End-User 2024 & 2032
- Figure 10: North America US Electrical Enclosures Industry Revenue (Million), by Country 2024 & 2032
- Figure 11: North America US Electrical Enclosures Industry Revenue Share (%), by Country 2024 & 2032
- Figure 12: South America US Electrical Enclosures Industry Revenue (Million), by Material Type 2024 & 2032
- Figure 13: South America US Electrical Enclosures Industry Revenue Share (%), by Material Type 2024 & 2032
- Figure 14: South America US Electrical Enclosures Industry Revenue (Million), by Application 2024 & 2032
- Figure 15: South America US Electrical Enclosures Industry Revenue Share (%), by Application 2024 & 2032
- Figure 16: South America US Electrical Enclosures Industry Revenue (Million), by End-User 2024 & 2032
- Figure 17: South America US Electrical Enclosures Industry Revenue Share (%), by End-User 2024 & 2032
- Figure 18: South America US Electrical Enclosures Industry Revenue (Million), by Country 2024 & 2032
- Figure 19: South America US Electrical Enclosures Industry Revenue Share (%), by Country 2024 & 2032
- Figure 20: Europe US Electrical Enclosures Industry Revenue (Million), by Material Type 2024 & 2032
- Figure 21: Europe US Electrical Enclosures Industry Revenue Share (%), by Material Type 2024 & 2032
- Figure 22: Europe US Electrical Enclosures Industry Revenue (Million), by Application 2024 & 2032
- Figure 23: Europe US Electrical Enclosures Industry Revenue Share (%), by Application 2024 & 2032
- Figure 24: Europe US Electrical Enclosures Industry Revenue (Million), by End-User 2024 & 2032
- Figure 25: Europe US Electrical Enclosures Industry Revenue Share (%), by End-User 2024 & 2032
- Figure 26: Europe US Electrical Enclosures Industry Revenue (Million), by Country 2024 & 2032
- Figure 27: Europe US Electrical Enclosures Industry Revenue Share (%), by Country 2024 & 2032
- Figure 28: Middle East & Africa US Electrical Enclosures Industry Revenue (Million), by Material Type 2024 & 2032
- Figure 29: Middle East & Africa US Electrical Enclosures Industry Revenue Share (%), by Material Type 2024 & 2032
- Figure 30: Middle East & Africa US Electrical Enclosures Industry Revenue (Million), by Application 2024 & 2032
- Figure 31: Middle East & Africa US Electrical Enclosures Industry Revenue Share (%), by Application 2024 & 2032
- Figure 32: Middle East & Africa US Electrical Enclosures Industry Revenue (Million), by End-User 2024 & 2032
- Figure 33: Middle East & Africa US Electrical Enclosures Industry Revenue Share (%), by End-User 2024 & 2032
- Figure 34: Middle East & Africa US Electrical Enclosures Industry Revenue (Million), by Country 2024 & 2032
- Figure 35: Middle East & Africa US Electrical Enclosures Industry Revenue Share (%), by Country 2024 & 2032
- Figure 36: Asia Pacific US Electrical Enclosures Industry Revenue (Million), by Material Type 2024 & 2032
- Figure 37: Asia Pacific US Electrical Enclosures Industry Revenue Share (%), by Material Type 2024 & 2032
- Figure 38: Asia Pacific US Electrical Enclosures Industry Revenue (Million), by Application 2024 & 2032
- Figure 39: Asia Pacific US Electrical Enclosures Industry Revenue Share (%), by Application 2024 & 2032
- Figure 40: Asia Pacific US Electrical Enclosures Industry Revenue (Million), by End-User 2024 & 2032
- Figure 41: Asia Pacific US Electrical Enclosures Industry Revenue Share (%), by End-User 2024 & 2032
- Figure 42: Asia Pacific US Electrical Enclosures Industry Revenue (Million), by Country 2024 & 2032
- Figure 43: Asia Pacific US Electrical Enclosures Industry Revenue Share (%), by Country 2024 & 2032
List of Tables
- Table 1: Global US Electrical Enclosures Industry Revenue Million Forecast, by Region 2019 & 2032
- Table 2: Global US Electrical Enclosures Industry Revenue Million Forecast, by Material Type 2019 & 2032
- Table 3: Global US Electrical Enclosures Industry Revenue Million Forecast, by Application 2019 & 2032
- Table 4: Global US Electrical Enclosures Industry Revenue Million Forecast, by End-User 2019 & 2032
- Table 5: Global US Electrical Enclosures Industry Revenue Million Forecast, by Region 2019 & 2032
- Table 6: Global US Electrical Enclosures Industry Revenue Million Forecast, by Country 2019 & 2032
- Table 7: Northeast US Electrical Enclosures Industry Revenue (Million) Forecast, by Application 2019 & 2032
- Table 8: Southeast US Electrical Enclosures Industry Revenue (Million) Forecast, by Application 2019 & 2032
- Table 9: Midwest US Electrical Enclosures Industry Revenue (Million) Forecast, by Application 2019 & 2032
- Table 10: Southwest US Electrical Enclosures Industry Revenue (Million) Forecast, by Application 2019 & 2032
- Table 11: West US Electrical Enclosures Industry Revenue (Million) Forecast, by Application 2019 & 2032
- Table 12: Global US Electrical Enclosures Industry Revenue Million Forecast, by Material Type 2019 & 2032
- Table 13: Global US Electrical Enclosures Industry Revenue Million Forecast, by Application 2019 & 2032
- Table 14: Global US Electrical Enclosures Industry Revenue Million Forecast, by End-User 2019 & 2032
- Table 15: Global US Electrical Enclosures Industry Revenue Million Forecast, by Country 2019 & 2032
- Table 16: United States US Electrical Enclosures Industry Revenue (Million) Forecast, by Application 2019 & 2032
- Table 17: Canada US Electrical Enclosures Industry Revenue (Million) Forecast, by Application 2019 & 2032
- Table 18: Mexico US Electrical Enclosures Industry Revenue (Million) Forecast, by Application 2019 & 2032
- Table 19: Global US Electrical Enclosures Industry Revenue Million Forecast, by Material Type 2019 & 2032
- Table 20: Global US Electrical Enclosures Industry Revenue Million Forecast, by Application 2019 & 2032
- Table 21: Global US Electrical Enclosures Industry Revenue Million Forecast, by End-User 2019 & 2032
- Table 22: Global US Electrical Enclosures Industry Revenue Million Forecast, by Country 2019 & 2032
- Table 23: Brazil US Electrical Enclosures Industry Revenue (Million) Forecast, by Application 2019 & 2032
- Table 24: Argentina US Electrical Enclosures Industry Revenue (Million) Forecast, by Application 2019 & 2032
- Table 25: Rest of South America US Electrical Enclosures Industry Revenue (Million) Forecast, by Application 2019 & 2032
- Table 26: Global US Electrical Enclosures Industry Revenue Million Forecast, by Material Type 2019 & 2032
- Table 27: Global US Electrical Enclosures Industry Revenue Million Forecast, by Application 2019 & 2032
- Table 28: Global US Electrical Enclosures Industry Revenue Million Forecast, by End-User 2019 & 2032
- Table 29: Global US Electrical Enclosures Industry Revenue Million Forecast, by Country 2019 & 2032
- Table 30: United Kingdom US Electrical Enclosures Industry Revenue (Million) Forecast, by Application 2019 & 2032
- Table 31: Germany US Electrical Enclosures Industry Revenue (Million) Forecast, by Application 2019 & 2032
- Table 32: France US Electrical Enclosures Industry Revenue (Million) Forecast, by Application 2019 & 2032
- Table 33: Italy US Electrical Enclosures Industry Revenue (Million) Forecast, by Application 2019 & 2032
- Table 34: Spain US Electrical Enclosures Industry Revenue (Million) Forecast, by Application 2019 & 2032
- Table 35: Russia US Electrical Enclosures Industry Revenue (Million) Forecast, by Application 2019 & 2032
- Table 36: Benelux US Electrical Enclosures Industry Revenue (Million) Forecast, by Application 2019 & 2032
- Table 37: Nordics US Electrical Enclosures Industry Revenue (Million) Forecast, by Application 2019 & 2032
- Table 38: Rest of Europe US Electrical Enclosures Industry Revenue (Million) Forecast, by Application 2019 & 2032
- Table 39: Global US Electrical Enclosures Industry Revenue Million Forecast, by Material Type 2019 & 2032
- Table 40: Global US Electrical Enclosures Industry Revenue Million Forecast, by Application 2019 & 2032
- Table 41: Global US Electrical Enclosures Industry Revenue Million Forecast, by End-User 2019 & 2032
- Table 42: Global US Electrical Enclosures Industry Revenue Million Forecast, by Country 2019 & 2032
- Table 43: Turkey US Electrical Enclosures Industry Revenue (Million) Forecast, by Application 2019 & 2032
- Table 44: Israel US Electrical Enclosures Industry Revenue (Million) Forecast, by Application 2019 & 2032
- Table 45: GCC US Electrical Enclosures Industry Revenue (Million) Forecast, by Application 2019 & 2032
- Table 46: North Africa US Electrical Enclosures Industry Revenue (Million) Forecast, by Application 2019 & 2032
- Table 47: South Africa US Electrical Enclosures Industry Revenue (Million) Forecast, by Application 2019 & 2032
- Table 48: Rest of Middle East & Africa US Electrical Enclosures Industry Revenue (Million) Forecast, by Application 2019 & 2032
- Table 49: Global US Electrical Enclosures Industry Revenue Million Forecast, by Material Type 2019 & 2032
- Table 50: Global US Electrical Enclosures Industry Revenue Million Forecast, by Application 2019 & 2032
- Table 51: Global US Electrical Enclosures Industry Revenue Million Forecast, by End-User 2019 & 2032
- Table 52: Global US Electrical Enclosures Industry Revenue Million Forecast, by Country 2019 & 2032
- Table 53: China US Electrical Enclosures Industry Revenue (Million) Forecast, by Application 2019 & 2032
- Table 54: India US Electrical Enclosures Industry Revenue (Million) Forecast, by Application 2019 & 2032
- Table 55: Japan US Electrical Enclosures Industry Revenue (Million) Forecast, by Application 2019 & 2032
- Table 56: South Korea US Electrical Enclosures Industry Revenue (Million) Forecast, by Application 2019 & 2032
- Table 57: ASEAN US Electrical Enclosures Industry Revenue (Million) Forecast, by Application 2019 & 2032
- Table 58: Oceania US Electrical Enclosures Industry Revenue (Million) Forecast, by Application 2019 & 2032
- Table 59: Rest of Asia Pacific US Electrical Enclosures Industry Revenue (Million) Forecast, by Application 2019 & 2032
Frequently Asked Questions
1. What is the projected Compound Annual Growth Rate (CAGR) of the US Electrical Enclosures Industry?
The projected CAGR is approximately 7.91%.
2. Which companies are prominent players in the US Electrical Enclosures Industry?
Key companies in the market include ABB Ltd, Adalet (Scott Fetzer Company, Austin Electrical Enclosures, Hubbell Inc, Legrand SA, Emerson Electric Co, Siemens AG, Schneider Electric SE, Rittal GmbH & Co Kg, AZZ Inc, Nvent Electric PLC, Hammond Manufacturing Ltd, Eaton Corporation.
3. What are the main segments of the US Electrical Enclosures Industry?
The market segments include Material Type, Application, End-User.
4. Can you provide details about the market size?
The market size is estimated to be USD 1.95 Million as of 2022.
5. What are some drivers contributing to market growth?
Growing Consumption and Capacity of Renewable Energy; Aging Power Generation and Distribution Network.
6. What are the notable trends driving market growth?
Commercial spaces and buildings industry to drive the market demand.
7. Are there any restraints impacting market growth?
Economic Slowdown in Industries.
8. Can you provide examples of recent developments in the market?
August 2021 - Hammond Manufacturing Ltd announced a USD 24 million expansion to provide more painting and metal fabrication capacity. The new 96,000-sq. Ft facility is scheduled to be operational by the end of 2022. The company manufactures electronic and electrical products, including metallic and non-metallic enclosures, racks, small cases, outlet strips, surge suppressors, and electronic transformers.
9. What pricing options are available for accessing the report?
Pricing options include single-user, multi-user, and enterprise licenses priced at USD 3800, USD 4500, and USD 5800 respectively.
10. Is the market size provided in terms of value or volume?
The market size is provided in terms of value, measured in Million.
11. Are there any specific market keywords associated with the report?
Yes, the market keyword associated with the report is "US Electrical Enclosures Industry," which aids in identifying and referencing the specific market segment covered.
12. How do I determine which pricing option suits my needs best?
The pricing options vary based on user requirements and access needs. Individual users may opt for single-user licenses, while businesses requiring broader access may choose multi-user or enterprise licenses for cost-effective access to the report.
13. Are there any additional resources or data provided in the US Electrical Enclosures Industry report?
While the report offers comprehensive insights, it's advisable to review the specific contents or supplementary materials provided to ascertain if additional resources or data are available.
14. How can I stay updated on further developments or reports in the US Electrical Enclosures Industry?
To stay informed about further developments, trends, and reports in the US Electrical Enclosures Industry, consider subscribing to industry newsletters, following relevant companies and organizations, or regularly checking reputable industry news sources and publications.
Methodology
Step 1 - Identification of Relevant Samples Size from Population Database


Step 2 - Approaches for Defining Global Market Size (Value, Volume* & Price*)

Note*: In applicable scenarios
Step 3 - Data Sources
Primary Research
- Web Analytics
- Survey Reports
- Research Institute
- Latest Research Reports
- Opinion Leaders
Secondary Research
- Annual Reports
- White Paper
- Latest Press Release
- Industry Association
- Paid Database
- Investor Presentations

Step 4 - Data Triangulation
Involves using different sources of information in order to increase the validity of a study
These sources are likely to be stakeholders in a program - participants, other researchers, program staff, other community members, and so on.
Then we put all data in single framework & apply various statistical tools to find out the dynamic on the market.
During the analysis stage, feedback from the stakeholder groups would be compared to determine areas of agreement as well as areas of divergence
