

Key Insights
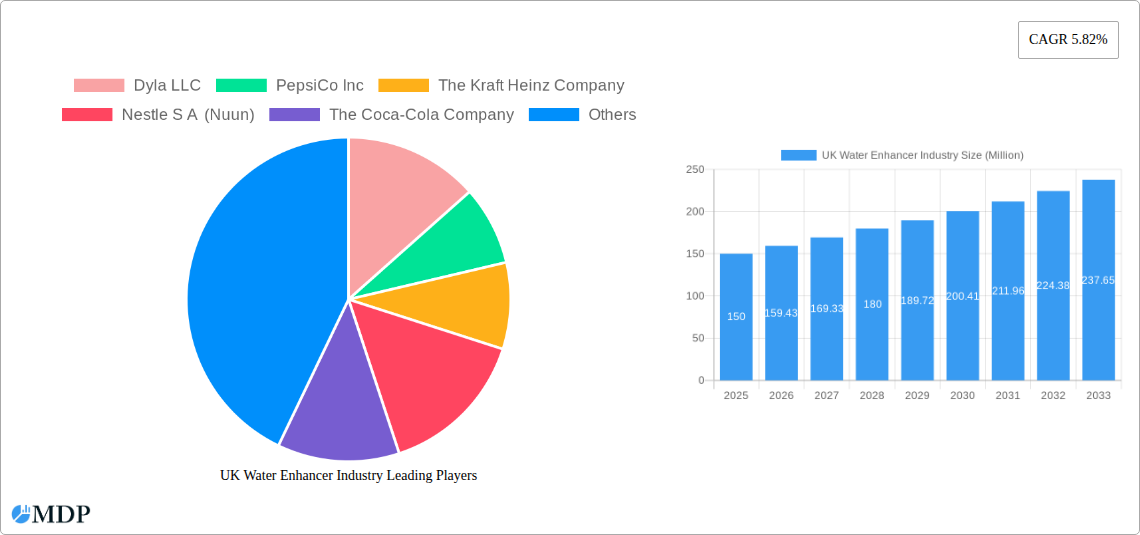
The UK water enhancer market, valued at approximately £150 million in 2025, is projected to experience robust growth, with a Compound Annual Growth Rate (CAGR) of 5.82% from 2025 to 2033. This expansion is driven by several key factors. The increasing consumer awareness of health and wellness, coupled with a growing preference for healthier beverage options, fuels demand for low-sugar, low-calorie alternatives to sugary drinks. The convenience and versatility of water enhancers, allowing for easy customization of taste and flavor profiles, also contributes significantly to their popularity. Furthermore, the rising prevalence of online retail channels provides consumers with increased access to a wider range of products, further boosting market growth. The market is segmented by distribution channels, including hypermarkets/supermarkets, convenience stores, online retail stores, and other channels, with online channels exhibiting particularly strong growth potential. Leading players such as PepsiCo, Nestle, and Coca-Cola are actively competing in this space, launching innovative products and expanding their distribution networks.
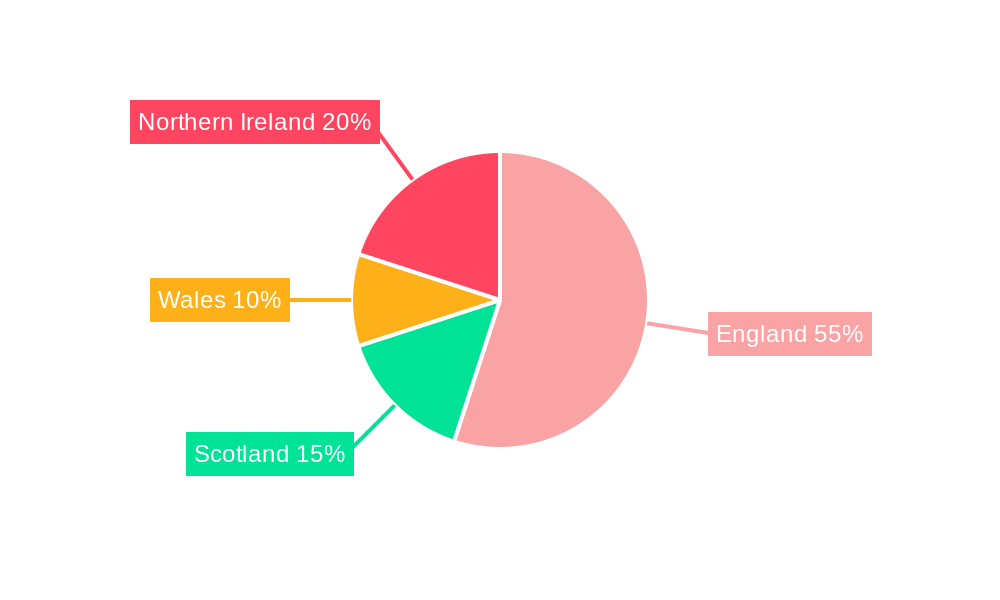
However, challenges remain. Price sensitivity among consumers and the potential for market saturation in certain segments could hinder growth. Furthermore, increasing competition from other healthy beverage options, such as sparkling water and naturally flavored waters, requires companies to continuously innovate and differentiate their offerings. Effective marketing strategies emphasizing health benefits and appealing flavors are crucial for success. The regional distribution within the UK (England, Wales, Scotland, and Northern Ireland) shows varied adoption rates, with urban areas demonstrating higher penetration than rural regions. This necessitates targeted marketing campaigns and regionally adapted distribution strategies. Sustained growth will rely on continued innovation, effective branding, and expansion into new distribution channels to reach a wider consumer base.
UK Water Enhancer Industry Market Report: 2019-2033
This comprehensive report provides an in-depth analysis of the UK water enhancer industry, offering valuable insights for stakeholders including manufacturers, distributors, and investors. With a study period spanning 2019-2033, a base year of 2025, and a forecast period of 2025-2033, this report unveils the market's dynamics, trends, and future potential. The report projects a market value of £xx Million by 2033, driven by factors such as growing health consciousness and the increasing demand for convenient hydration solutions. Key players like PepsiCo Inc, Britvic plc, and Nestle S.A. (Nuun) are shaping the market landscape.
UK Water Enhancer Industry Market Dynamics & Concentration
This section analyzes the competitive landscape, innovation, regulatory environment, and market trends within the UK water enhancer industry from 2019-2024. The market is characterized by a moderate level of concentration, with key players holding significant market shares but facing pressure from smaller, innovative entrants.
- Market Concentration: The top 5 players account for approximately xx% of the total market share in 2024. This is projected to slightly decrease to xx% by 2033 due to increased competition.
- Innovation Drivers: Consumer demand for natural, functional, and better-tasting water enhancers is a key innovation driver. This includes low-sugar, vitamin-enhanced, and unique flavor profiles.
- Regulatory Frameworks: EU and UK food safety regulations significantly impact product development and marketing claims. Compliance costs and labeling requirements are notable considerations for businesses.
- Product Substitutes: Ready-to-drink flavored waters, fruit juices, and sports drinks represent key substitute products, impacting market share and pricing strategies.
- End-User Trends: The growing health-conscious consumer base is driving demand for low-sugar, natural, and functional water enhancers. Convenience is another significant factor, with single-serve formats gaining popularity.
- M&A Activities: The industry has witnessed xx M&A deals during the historical period (2019-2024), indicating consolidation and expansion strategies among key players. This number is expected to remain relatively stable in the forecast period.
UK Water Enhancer Industry Industry Trends & Analysis
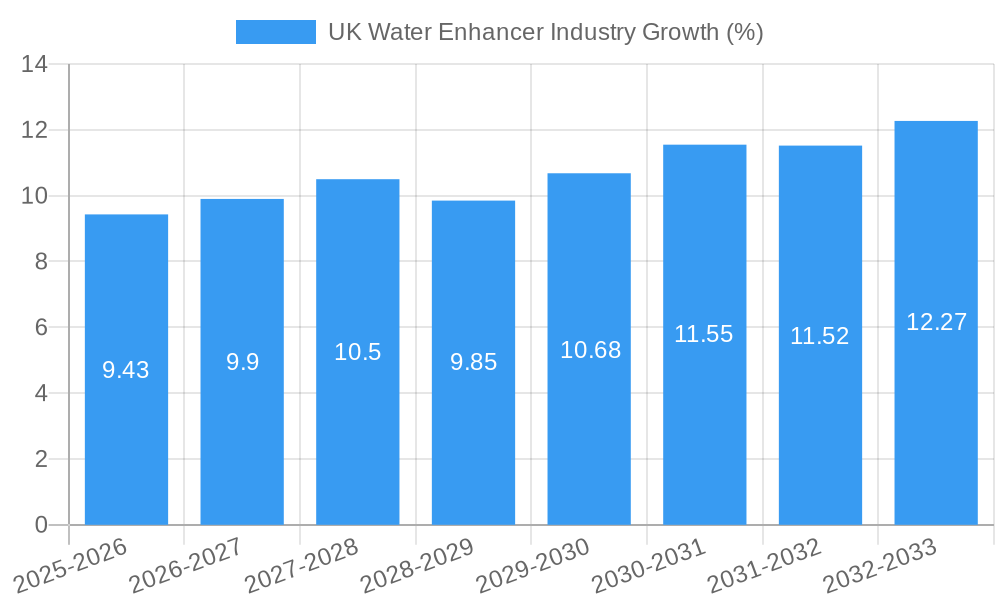
The UK water enhancer market experienced a CAGR of xx% during the historical period (2019-2024). This growth is projected to continue at a CAGR of xx% during the forecast period (2025-2033), reaching a market value of £xx Million.
Several factors are driving this growth:
- Health and Wellness: Growing consumer awareness of health and wellness is a primary driver, with consumers seeking healthier hydration alternatives to sugary drinks.
- Convenience: Single-serve packets and easy-to-use formats cater to busy lifestyles and on-the-go consumption.
- Flavor Innovation: The introduction of new and exciting flavors keeps consumers engaged and drives repeat purchases.
- Functional Benefits: Water enhancers infused with vitamins, minerals, or other beneficial ingredients are increasingly popular.
- Technological Disruptions: E-commerce platforms and direct-to-consumer models are opening up new market channels and increasing accessibility for both consumers and brands.
- Competitive Dynamics: Increased competition has led to innovation, value-added offerings, and more affordable pricing. Market penetration is expected to increase from xx% to xx% by 2033.
Leading Markets & Segments in UK Water Enhancer Industry
The hypermarket/supermarket segment dominates the UK water enhancer market, accounting for approximately xx% of total sales in 2024, followed by convenience stores at xx%. Online retail stores are witnessing significant growth, with a projected market share of xx% by 2033.
- Hypermarket/Supermarket:
- Key Drivers: Established distribution networks, high volume sales, and prominent shelf space.
- Convenience Stores:
- Key Drivers: High foot traffic in convenient locations, impulse purchases, and smaller packaging sizes suitable for on-the-go consumption.
- Online Retail Stores:
- Key Drivers: Growing online shopping trends, wider product selection, and direct-to-consumer marketing opportunities.
- Other Distribution Channels: This includes smaller retailers, food service establishments, and direct sales.
UK Water Enhancer Industry Product Developments
Recent product innovations focus on natural ingredients, functional benefits, and unique flavors. Sugar-free and vitamin-enhanced options are gaining traction, alongside convenient single-serve packaging. Technological advancements in flavor creation and packaging technology are also influencing product developments. This caters to the growing demand for healthier and more convenient hydration options.
Key Drivers of UK Water Enhancer Industry Growth
The UK water enhancer market growth is fueled by several factors:
- Health-conscious consumers: Increased focus on wellness drives demand for healthier alternatives to sugary drinks.
- Convenience: Single-serve packaging and easy-to-use formats cater to busy lifestyles.
- Product innovation: New flavors, functional benefits, and improved formulations enhance market appeal.
- Technological advancements: Improved flavor delivery systems and sustainable packaging contribute to growth.
Challenges in the UK Water Enhancer Industry Market
The UK water enhancer market faces several challenges:
- Intense competition: Existing players and new entrants create a highly competitive landscape impacting pricing and margins.
- Supply chain disruptions: Global events can disrupt ingredient sourcing and packaging supply, affecting production and delivery.
- Health and safety regulations: Compliance with strict regulations adds to operational costs and complexity.
Emerging Opportunities in UK Water Enhancer Industry
Several opportunities exist for growth:
- Premiumization: Consumers are increasingly willing to pay more for premium, high-quality, and functional water enhancers.
- Functional formulations: Formulations enriched with vitamins, electrolytes, and other beneficial ingredients are gaining popularity.
- Sustainability: Eco-friendly packaging and sustainable sourcing practices are key opportunities to appeal to environmentally conscious consumers.
Leading Players in the UK Water Enhancer Industry Sector
- Dyla LLC
- PepsiCo Inc
- The Kraft Heinz Company
- Nestle S.A. (Nuun)
- The Coca-Cola Company
- Jelsert (Starburst)
- Refresco
- Wisdom Natural Brands
- Exante Diet Ltd
- Britvic plc
Key Milestones in UK Water Enhancer Industry Industry
- July 2021: Crème de la Cream launched Chupa Chups-flavored Lolly Drops, expanding the flavor range and appealing to a wider consumer base.
- November 2021: Waterdrop introduced NERO, a natural energy water enhancer, adding to the functional beverage segment.
- April 2022: Robinsons (Britvic plc) launched Benefit Drops, a vitamin-enhanced water enhancer targeting health-conscious consumers seeking convenience.
Strategic Outlook for UK Water Enhancer Industry Market
The UK water enhancer market holds significant growth potential, driven by consumer demand for healthier and more convenient hydration options. Strategic opportunities include focusing on premiumization, functional formulations, sustainable packaging, and leveraging e-commerce channels for enhanced market reach. Further innovation in flavors and product formats will be crucial for maintaining competitive advantage and capturing market share in the coming years.
UK Water Enhancer Industry Segmentation
-
1. Distribution Channel
- 1.1. Hypermarket/Supermarket
- 1.2. Convenience Store
- 1.3. Online Retails Stores
- 1.4. Other Distribution Channels
UK Water Enhancer Industry Segmentation By Geography
-
1. North America
- 1.1. United States
- 1.2. Canada
- 1.3. Mexico
-
2. South America
- 2.1. Brazil
- 2.2. Argentina
- 2.3. Rest of South America
-
3. Europe
- 3.1. United Kingdom
- 3.2. Germany
- 3.3. France
- 3.4. Italy
- 3.5. Spain
- 3.6. Russia
- 3.7. Benelux
- 3.8. Nordics
- 3.9. Rest of Europe
-
4. Middle East & Africa
- 4.1. Turkey
- 4.2. Israel
- 4.3. GCC
- 4.4. North Africa
- 4.5. South Africa
- 4.6. Rest of Middle East & Africa
-
5. Asia Pacific
- 5.1. China
- 5.2. India
- 5.3. Japan
- 5.4. South Korea
- 5.5. ASEAN
- 5.6. Oceania
- 5.7. Rest of Asia Pacific
UK Water Enhancer Industry REPORT HIGHLIGHTS
| Aspects | Details |
|---|---|
| Study Period | 2019-2033 |
| Base Year | 2024 |
| Estimated Year | 2025 |
| Forecast Period | 2025-2033 |
| Historical Period | 2019-2024 |
| Growth Rate | CAGR of 5.82% from 2019-2033 |
| Segmentation |
|
Table of Contents
- 1. Introduction
- 1.1. Research Scope
- 1.2. Market Segmentation
- 1.3. Research Methodology
- 1.4. Definitions and Assumptions
- 2. Executive Summary
- 2.1. Introduction
- 3. Market Dynamics
- 3.1. Introduction
- 3.2. Market Drivers
- 3.2.1. Rise of e-commerce has made it easier for consumers to access a wide variety of water enhancers
- 3.3. Market Restrains
- 3.3.1. Economic downturns or fluctuations in disposable income can impact consumer spending on non-essential products
- 3.4. Market Trends
- 3.4.1. Growing trend towards personalized nutrition and functional beverages supports the market for water enhancers
- 4. Market Factor Analysis
- 4.1. Porters Five Forces
- 4.2. Supply/Value Chain
- 4.3. PESTEL analysis
- 4.4. Market Entropy
- 4.5. Patent/Trademark Analysis
- 5. Global UK Water Enhancer Industry Analysis, Insights and Forecast, 2019-2031
- 5.1. Market Analysis, Insights and Forecast - by Distribution Channel
- 5.1.1. Hypermarket/Supermarket
- 5.1.2. Convenience Store
- 5.1.3. Online Retails Stores
- 5.1.4. Other Distribution Channels
- 5.2. Market Analysis, Insights and Forecast - by Region
- 5.2.1. North America
- 5.2.2. South America
- 5.2.3. Europe
- 5.2.4. Middle East & Africa
- 5.2.5. Asia Pacific
- 5.1. Market Analysis, Insights and Forecast - by Distribution Channel
- 6. North America UK Water Enhancer Industry Analysis, Insights and Forecast, 2019-2031
- 6.1. Market Analysis, Insights and Forecast - by Distribution Channel
- 6.1.1. Hypermarket/Supermarket
- 6.1.2. Convenience Store
- 6.1.3. Online Retails Stores
- 6.1.4. Other Distribution Channels
- 6.1. Market Analysis, Insights and Forecast - by Distribution Channel
- 7. South America UK Water Enhancer Industry Analysis, Insights and Forecast, 2019-2031
- 7.1. Market Analysis, Insights and Forecast - by Distribution Channel
- 7.1.1. Hypermarket/Supermarket
- 7.1.2. Convenience Store
- 7.1.3. Online Retails Stores
- 7.1.4. Other Distribution Channels
- 7.1. Market Analysis, Insights and Forecast - by Distribution Channel
- 8. Europe UK Water Enhancer Industry Analysis, Insights and Forecast, 2019-2031
- 8.1. Market Analysis, Insights and Forecast - by Distribution Channel
- 8.1.1. Hypermarket/Supermarket
- 8.1.2. Convenience Store
- 8.1.3. Online Retails Stores
- 8.1.4. Other Distribution Channels
- 8.1. Market Analysis, Insights and Forecast - by Distribution Channel
- 9. Middle East & Africa UK Water Enhancer Industry Analysis, Insights and Forecast, 2019-2031
- 9.1. Market Analysis, Insights and Forecast - by Distribution Channel
- 9.1.1. Hypermarket/Supermarket
- 9.1.2. Convenience Store
- 9.1.3. Online Retails Stores
- 9.1.4. Other Distribution Channels
- 9.1. Market Analysis, Insights and Forecast - by Distribution Channel
- 10. Asia Pacific UK Water Enhancer Industry Analysis, Insights and Forecast, 2019-2031
- 10.1. Market Analysis, Insights and Forecast - by Distribution Channel
- 10.1.1. Hypermarket/Supermarket
- 10.1.2. Convenience Store
- 10.1.3. Online Retails Stores
- 10.1.4. Other Distribution Channels
- 10.1. Market Analysis, Insights and Forecast - by Distribution Channel
- 11. England UK Water Enhancer Industry Analysis, Insights and Forecast, 2019-2031
- 12. Wales UK Water Enhancer Industry Analysis, Insights and Forecast, 2019-2031
- 13. Scotland UK Water Enhancer Industry Analysis, Insights and Forecast, 2019-2031
- 14. Northern UK Water Enhancer Industry Analysis, Insights and Forecast, 2019-2031
- 15. Ireland UK Water Enhancer Industry Analysis, Insights and Forecast, 2019-2031
- 16. Competitive Analysis
- 16.1. Global Market Share Analysis 2024
- 16.2. Company Profiles
- 16.2.1 Dyla LLC
- 16.2.1.1. Overview
- 16.2.1.2. Products
- 16.2.1.3. SWOT Analysis
- 16.2.1.4. Recent Developments
- 16.2.1.5. Financials (Based on Availability)
- 16.2.2 PepsiCo Inc
- 16.2.2.1. Overview
- 16.2.2.2. Products
- 16.2.2.3. SWOT Analysis
- 16.2.2.4. Recent Developments
- 16.2.2.5. Financials (Based on Availability)
- 16.2.3 The Kraft Heinz Company
- 16.2.3.1. Overview
- 16.2.3.2. Products
- 16.2.3.3. SWOT Analysis
- 16.2.3.4. Recent Developments
- 16.2.3.5. Financials (Based on Availability)
- 16.2.4 Nestle S A (Nuun)
- 16.2.4.1. Overview
- 16.2.4.2. Products
- 16.2.4.3. SWOT Analysis
- 16.2.4.4. Recent Developments
- 16.2.4.5. Financials (Based on Availability)
- 16.2.5 The Coca-Cola Company
- 16.2.5.1. Overview
- 16.2.5.2. Products
- 16.2.5.3. SWOT Analysis
- 16.2.5.4. Recent Developments
- 16.2.5.5. Financials (Based on Availability)
- 16.2.6 Jelsert (Starburst)
- 16.2.6.1. Overview
- 16.2.6.2. Products
- 16.2.6.3. SWOT Analysis
- 16.2.6.4. Recent Developments
- 16.2.6.5. Financials (Based on Availability)
- 16.2.7 Refresco
- 16.2.7.1. Overview
- 16.2.7.2. Products
- 16.2.7.3. SWOT Analysis
- 16.2.7.4. Recent Developments
- 16.2.7.5. Financials (Based on Availability)
- 16.2.8 Wisdom Natural Brands
- 16.2.8.1. Overview
- 16.2.8.2. Products
- 16.2.8.3. SWOT Analysis
- 16.2.8.4. Recent Developments
- 16.2.8.5. Financials (Based on Availability)
- 16.2.9 Exante Diet Ltd
- 16.2.9.1. Overview
- 16.2.9.2. Products
- 16.2.9.3. SWOT Analysis
- 16.2.9.4. Recent Developments
- 16.2.9.5. Financials (Based on Availability)
- 16.2.10 Britvic plc
- 16.2.10.1. Overview
- 16.2.10.2. Products
- 16.2.10.3. SWOT Analysis
- 16.2.10.4. Recent Developments
- 16.2.10.5. Financials (Based on Availability)
- 16.2.1 Dyla LLC
List of Figures
- Figure 1: Global UK Water Enhancer Industry Revenue Breakdown (Million, %) by Region 2024 & 2032
- Figure 2: United kingdom Region UK Water Enhancer Industry Revenue (Million), by Country 2024 & 2032
- Figure 3: United kingdom Region UK Water Enhancer Industry Revenue Share (%), by Country 2024 & 2032
- Figure 4: North America UK Water Enhancer Industry Revenue (Million), by Distribution Channel 2024 & 2032
- Figure 5: North America UK Water Enhancer Industry Revenue Share (%), by Distribution Channel 2024 & 2032
- Figure 6: North America UK Water Enhancer Industry Revenue (Million), by Country 2024 & 2032
- Figure 7: North America UK Water Enhancer Industry Revenue Share (%), by Country 2024 & 2032
- Figure 8: South America UK Water Enhancer Industry Revenue (Million), by Distribution Channel 2024 & 2032
- Figure 9: South America UK Water Enhancer Industry Revenue Share (%), by Distribution Channel 2024 & 2032
- Figure 10: South America UK Water Enhancer Industry Revenue (Million), by Country 2024 & 2032
- Figure 11: South America UK Water Enhancer Industry Revenue Share (%), by Country 2024 & 2032
- Figure 12: Europe UK Water Enhancer Industry Revenue (Million), by Distribution Channel 2024 & 2032
- Figure 13: Europe UK Water Enhancer Industry Revenue Share (%), by Distribution Channel 2024 & 2032
- Figure 14: Europe UK Water Enhancer Industry Revenue (Million), by Country 2024 & 2032
- Figure 15: Europe UK Water Enhancer Industry Revenue Share (%), by Country 2024 & 2032
- Figure 16: Middle East & Africa UK Water Enhancer Industry Revenue (Million), by Distribution Channel 2024 & 2032
- Figure 17: Middle East & Africa UK Water Enhancer Industry Revenue Share (%), by Distribution Channel 2024 & 2032
- Figure 18: Middle East & Africa UK Water Enhancer Industry Revenue (Million), by Country 2024 & 2032
- Figure 19: Middle East & Africa UK Water Enhancer Industry Revenue Share (%), by Country 2024 & 2032
- Figure 20: Asia Pacific UK Water Enhancer Industry Revenue (Million), by Distribution Channel 2024 & 2032
- Figure 21: Asia Pacific UK Water Enhancer Industry Revenue Share (%), by Distribution Channel 2024 & 2032
- Figure 22: Asia Pacific UK Water Enhancer Industry Revenue (Million), by Country 2024 & 2032
- Figure 23: Asia Pacific UK Water Enhancer Industry Revenue Share (%), by Country 2024 & 2032
List of Tables
- Table 1: Global UK Water Enhancer Industry Revenue Million Forecast, by Region 2019 & 2032
- Table 2: Global UK Water Enhancer Industry Revenue Million Forecast, by Distribution Channel 2019 & 2032
- Table 3: Global UK Water Enhancer Industry Revenue Million Forecast, by Region 2019 & 2032
- Table 4: Global UK Water Enhancer Industry Revenue Million Forecast, by Country 2019 & 2032
- Table 5: England UK Water Enhancer Industry Revenue (Million) Forecast, by Application 2019 & 2032
- Table 6: Wales UK Water Enhancer Industry Revenue (Million) Forecast, by Application 2019 & 2032
- Table 7: Scotland UK Water Enhancer Industry Revenue (Million) Forecast, by Application 2019 & 2032
- Table 8: Northern UK Water Enhancer Industry Revenue (Million) Forecast, by Application 2019 & 2032
- Table 9: Ireland UK Water Enhancer Industry Revenue (Million) Forecast, by Application 2019 & 2032
- Table 10: Global UK Water Enhancer Industry Revenue Million Forecast, by Distribution Channel 2019 & 2032
- Table 11: Global UK Water Enhancer Industry Revenue Million Forecast, by Country 2019 & 2032
- Table 12: United States UK Water Enhancer Industry Revenue (Million) Forecast, by Application 2019 & 2032
- Table 13: Canada UK Water Enhancer Industry Revenue (Million) Forecast, by Application 2019 & 2032
- Table 14: Mexico UK Water Enhancer Industry Revenue (Million) Forecast, by Application 2019 & 2032
- Table 15: Global UK Water Enhancer Industry Revenue Million Forecast, by Distribution Channel 2019 & 2032
- Table 16: Global UK Water Enhancer Industry Revenue Million Forecast, by Country 2019 & 2032
- Table 17: Brazil UK Water Enhancer Industry Revenue (Million) Forecast, by Application 2019 & 2032
- Table 18: Argentina UK Water Enhancer Industry Revenue (Million) Forecast, by Application 2019 & 2032
- Table 19: Rest of South America UK Water Enhancer Industry Revenue (Million) Forecast, by Application 2019 & 2032
- Table 20: Global UK Water Enhancer Industry Revenue Million Forecast, by Distribution Channel 2019 & 2032
- Table 21: Global UK Water Enhancer Industry Revenue Million Forecast, by Country 2019 & 2032
- Table 22: United Kingdom UK Water Enhancer Industry Revenue (Million) Forecast, by Application 2019 & 2032
- Table 23: Germany UK Water Enhancer Industry Revenue (Million) Forecast, by Application 2019 & 2032
- Table 24: France UK Water Enhancer Industry Revenue (Million) Forecast, by Application 2019 & 2032
- Table 25: Italy UK Water Enhancer Industry Revenue (Million) Forecast, by Application 2019 & 2032
- Table 26: Spain UK Water Enhancer Industry Revenue (Million) Forecast, by Application 2019 & 2032
- Table 27: Russia UK Water Enhancer Industry Revenue (Million) Forecast, by Application 2019 & 2032
- Table 28: Benelux UK Water Enhancer Industry Revenue (Million) Forecast, by Application 2019 & 2032
- Table 29: Nordics UK Water Enhancer Industry Revenue (Million) Forecast, by Application 2019 & 2032
- Table 30: Rest of Europe UK Water Enhancer Industry Revenue (Million) Forecast, by Application 2019 & 2032
- Table 31: Global UK Water Enhancer Industry Revenue Million Forecast, by Distribution Channel 2019 & 2032
- Table 32: Global UK Water Enhancer Industry Revenue Million Forecast, by Country 2019 & 2032
- Table 33: Turkey UK Water Enhancer Industry Revenue (Million) Forecast, by Application 2019 & 2032
- Table 34: Israel UK Water Enhancer Industry Revenue (Million) Forecast, by Application 2019 & 2032
- Table 35: GCC UK Water Enhancer Industry Revenue (Million) Forecast, by Application 2019 & 2032
- Table 36: North Africa UK Water Enhancer Industry Revenue (Million) Forecast, by Application 2019 & 2032
- Table 37: South Africa UK Water Enhancer Industry Revenue (Million) Forecast, by Application 2019 & 2032
- Table 38: Rest of Middle East & Africa UK Water Enhancer Industry Revenue (Million) Forecast, by Application 2019 & 2032
- Table 39: Global UK Water Enhancer Industry Revenue Million Forecast, by Distribution Channel 2019 & 2032
- Table 40: Global UK Water Enhancer Industry Revenue Million Forecast, by Country 2019 & 2032
- Table 41: China UK Water Enhancer Industry Revenue (Million) Forecast, by Application 2019 & 2032
- Table 42: India UK Water Enhancer Industry Revenue (Million) Forecast, by Application 2019 & 2032
- Table 43: Japan UK Water Enhancer Industry Revenue (Million) Forecast, by Application 2019 & 2032
- Table 44: South Korea UK Water Enhancer Industry Revenue (Million) Forecast, by Application 2019 & 2032
- Table 45: ASEAN UK Water Enhancer Industry Revenue (Million) Forecast, by Application 2019 & 2032
- Table 46: Oceania UK Water Enhancer Industry Revenue (Million) Forecast, by Application 2019 & 2032
- Table 47: Rest of Asia Pacific UK Water Enhancer Industry Revenue (Million) Forecast, by Application 2019 & 2032
Frequently Asked Questions
1. What is the projected Compound Annual Growth Rate (CAGR) of the UK Water Enhancer Industry?
The projected CAGR is approximately 5.82%.
2. Which companies are prominent players in the UK Water Enhancer Industry?
Key companies in the market include Dyla LLC, PepsiCo Inc, The Kraft Heinz Company, Nestle S A (Nuun), The Coca-Cola Company, Jelsert (Starburst), Refresco, Wisdom Natural Brands, Exante Diet Ltd, Britvic plc.
3. What are the main segments of the UK Water Enhancer Industry?
The market segments include Distribution Channel.
4. Can you provide details about the market size?
The market size is estimated to be USD XX Million as of 2022.
5. What are some drivers contributing to market growth?
Rise of e-commerce has made it easier for consumers to access a wide variety of water enhancers.
6. What are the notable trends driving market growth?
Growing trend towards personalized nutrition and functional beverages supports the market for water enhancers.
7. Are there any restraints impacting market growth?
Economic downturns or fluctuations in disposable income can impact consumer spending on non-essential products.
8. Can you provide examples of recent developments in the market?
In April 2022, Robinsons, a brand of Britvic plc launched water enhancer new Benefit Drops with added vitamins in four different flavors. Benefit drops are the perfect portable format for consumers on the go as they deliver great taste and additional vitamins in their water consumption.
9. What pricing options are available for accessing the report?
Pricing options include single-user, multi-user, and enterprise licenses priced at USD 3800, USD 4500, and USD 5800 respectively.
10. Is the market size provided in terms of value or volume?
The market size is provided in terms of value, measured in Million.
11. Are there any specific market keywords associated with the report?
Yes, the market keyword associated with the report is "UK Water Enhancer Industry," which aids in identifying and referencing the specific market segment covered.
12. How do I determine which pricing option suits my needs best?
The pricing options vary based on user requirements and access needs. Individual users may opt for single-user licenses, while businesses requiring broader access may choose multi-user or enterprise licenses for cost-effective access to the report.
13. Are there any additional resources or data provided in the UK Water Enhancer Industry report?
While the report offers comprehensive insights, it's advisable to review the specific contents or supplementary materials provided to ascertain if additional resources or data are available.
14. How can I stay updated on further developments or reports in the UK Water Enhancer Industry?
To stay informed about further developments, trends, and reports in the UK Water Enhancer Industry, consider subscribing to industry newsletters, following relevant companies and organizations, or regularly checking reputable industry news sources and publications.
Methodology
Step 1 - Identification of Relevant Samples Size from Population Database


Step 2 - Approaches for Defining Global Market Size (Value, Volume* & Price*)

Note*: In applicable scenarios
Step 3 - Data Sources
Primary Research
- Web Analytics
- Survey Reports
- Research Institute
- Latest Research Reports
- Opinion Leaders
Secondary Research
- Annual Reports
- White Paper
- Latest Press Release
- Industry Association
- Paid Database
- Investor Presentations

Step 4 - Data Triangulation
Involves using different sources of information in order to increase the validity of a study
These sources are likely to be stakeholders in a program - participants, other researchers, program staff, other community members, and so on.
Then we put all data in single framework & apply various statistical tools to find out the dynamic on the market.
During the analysis stage, feedback from the stakeholder groups would be compared to determine areas of agreement as well as areas of divergence
