

Key Insights
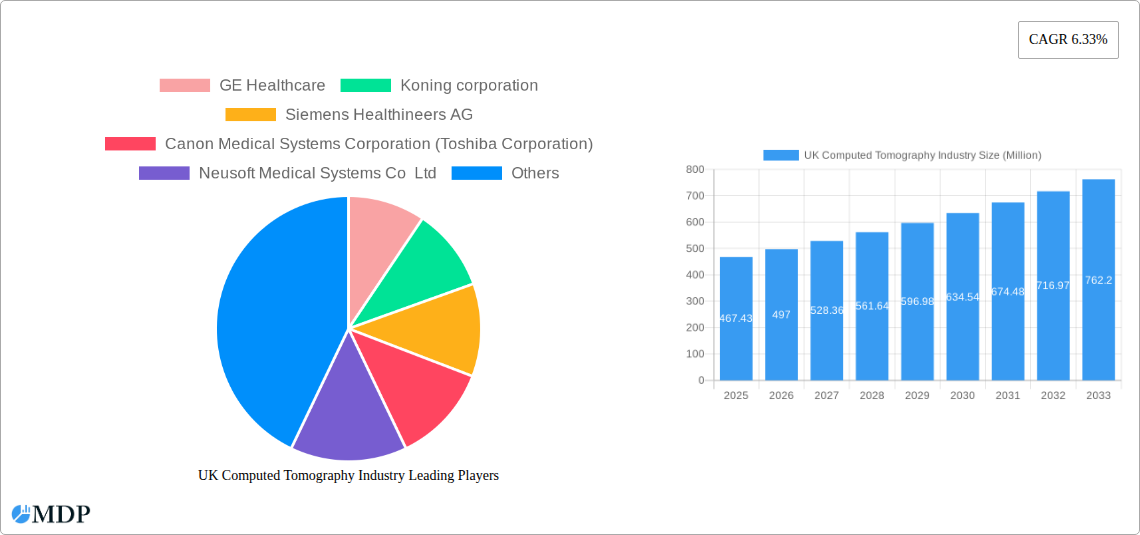
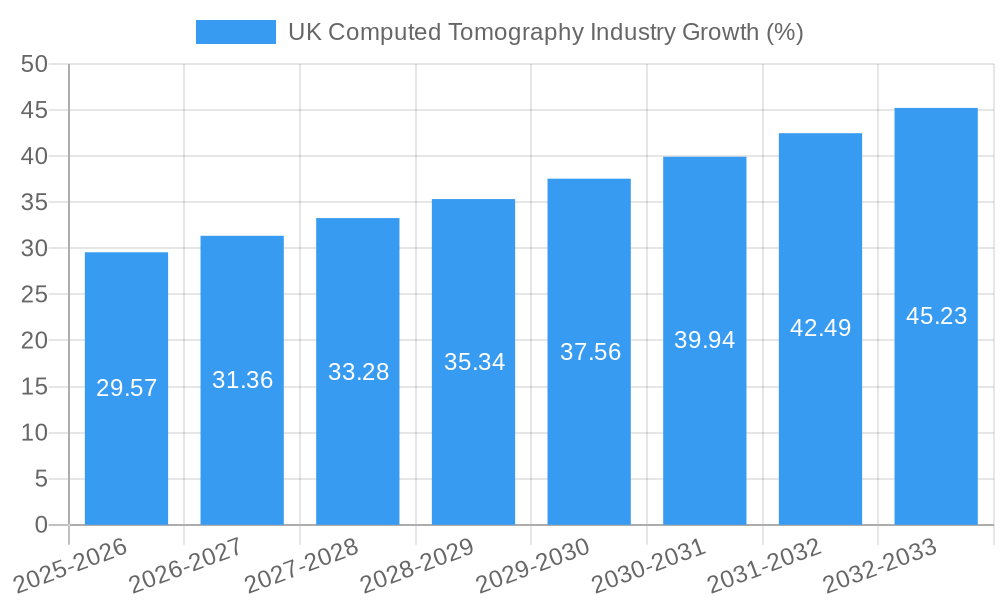
The UK computed tomography (CT) market, valued at approximately £467.43 million in 2025, is projected to experience robust growth, driven by a rising prevalence of chronic diseases requiring CT scans for diagnosis and treatment monitoring. The increasing geriatric population, coupled with advancements in CT technology, such as multi-slice CT scanners offering faster scan times and improved image quality, contribute significantly to market expansion. Technological innovations leading to enhanced image resolution, reduced radiation exposure, and the development of specialized CT applications for various medical fields like oncology, neurology, and cardiology, are further fueling market growth. The increasing adoption of CT scans in various healthcare settings, including hospitals and diagnostic centers, also boosts market demand. However, the market faces some challenges, including the high cost of equipment and maintenance, along with the need for skilled radiologists to interpret the complex images. The market is segmented by slice type (low, medium, high), application (oncology, neurology, cardiovascular, musculoskeletal, other), and end-user (hospitals, diagnostic centers, other). Major players like GE Healthcare, Siemens Healthineers, and Philips are key competitors, constantly striving for innovation and market share. Based on the 6.33% CAGR, the market is poised for continued expansion throughout the forecast period (2025-2033), with the high-slice segment and oncology application expected to witness the most significant growth.
The market's regional distribution within the UK shows significant concentration in urban areas with larger hospitals and diagnostic centers. Government initiatives to improve healthcare infrastructure and the increasing focus on early disease detection through advanced imaging technologies are positive contributors to market growth. While the high cost of CT scans can be a barrier for some patients, the improved diagnostic accuracy and potential for earlier interventions often outweigh this concern, ensuring the market’s long-term sustainability. The competitive landscape is expected to remain dynamic with ongoing product development, strategic partnerships, and potential mergers and acquisitions among key players vying for market dominance. Further analysis indicates that the market growth will be significantly influenced by technological advancements and the regulatory landscape surrounding medical imaging.
UK Computed Tomography (CT) Industry Report: 2019-2033
This comprehensive report provides an in-depth analysis of the UK Computed Tomography (CT) industry, offering invaluable insights for stakeholders including manufacturers, healthcare providers, and investors. Covering the period 2019-2033, with a focus on 2025, this report analyzes market dynamics, key players, technological advancements, and future growth prospects. Download now to gain a competitive edge!
Study Period: 2019–2033 Base Year: 2025 Estimated Year: 2025 Forecast Period: 2025–2033 Historical Period: 2019–2024
UK Computed Tomography Industry Market Dynamics & Concentration
The UK CT market exhibits a moderately concentrated structure, with major players like GE Healthcare, Siemens Healthineers AG, and Canon Medical Systems Corporation holding significant market share (estimated at xx% combined in 2025). Innovation is driven by advancements in image processing, detector technology (e.g., increased slice counts), and AI-powered image analysis. Regulatory frameworks, primarily governed by the Medicines and Healthcare products Regulatory Agency (MHRA), influence market access and product approvals. Product substitutes, such as MRI and ultrasound, exert competitive pressure, particularly in specific applications. End-user trends indicate a growing preference for faster, higher-resolution scanners with improved workflow efficiencies. M&A activity has been relatively modest in recent years, with an estimated xx deals completed between 2019 and 2024.
- Market Concentration: Moderately concentrated, with top 3 players holding xx% market share (2025 estimate).
- Innovation Drivers: Advanced detector technology, AI-powered image analysis, improved workflow efficiency.
- Regulatory Framework: Primarily governed by the MHRA.
- Product Substitutes: MRI, Ultrasound.
- M&A Activity: Estimated xx deals between 2019-2024.
UK Computed Tomography Industry Industry Trends & Analysis
The UK CT market is experiencing steady growth, driven by factors such as an aging population, rising prevalence of chronic diseases, increasing demand for advanced imaging techniques, and government initiatives promoting healthcare infrastructure development. The market witnessed a Compound Annual Growth Rate (CAGR) of xx% during the historical period (2019-2024) and is projected to maintain a CAGR of xx% during the forecast period (2025-2033). Technological disruptions, including the integration of AI and machine learning, are significantly enhancing diagnostic accuracy and workflow efficiency. Consumer preferences lean towards faster scan times, lower radiation doses, and improved image quality. Competitive dynamics are characterized by ongoing innovation, strategic partnerships, and a focus on providing comprehensive imaging solutions. Market penetration for advanced CT technologies is steadily increasing, reaching an estimated xx% in 2025.
Leading Markets & Segments in UK Computed Tomography Industry
The hospitals segment dominates the end-user landscape, accounting for xx% of the market in 2025, driven by high patient volumes and the availability of advanced imaging technologies. Within the application segments, oncology and cardiovascular applications hold significant shares due to their high prevalence and the critical need for accurate diagnostic imaging. High-slice CT scanners are the fastest-growing type segment, demonstrating an increasing adoption rate within specialized healthcare facilities.
- Key Drivers for Hospital Segment Dominance: High patient volumes, availability of advanced technologies.
- Key Drivers for Oncology & Cardiovascular Application Dominance: High prevalence of related diseases, critical need for accurate diagnosis.
- Key Drivers for High-Slice CT Scanner Growth: Increasing demand for higher resolution imaging and faster scan times.
UK Computed Tomography Industry Product Developments
Recent product innovations focus on improving image quality, reducing radiation dose, and streamlining workflow. Advances in detector technology, such as the use of dual-energy CT and spectral CT, provide more detailed anatomical information. The integration of AI and machine learning algorithms is enhancing image analysis and improving diagnostic accuracy. These advancements address the market's need for faster, more accurate, and efficient diagnostic imaging solutions.
Key Drivers of UK Computed Tomography Industry Growth
Several factors fuel the growth of the UK CT industry. Technological advancements, including AI-powered image analysis and improved detector technology, lead to better diagnostics. The aging population increases demand for healthcare services, including CT scans. Government initiatives investing in healthcare infrastructure, as exemplified by the EUR 350 Million DHSC funding for North Tyneside Hospital's new CT scanner, further boost market expansion.
Challenges in the UK Computed Tomography Industry Market
The UK CT market faces challenges like high equipment costs, stringent regulatory approvals, and competition from alternative imaging modalities. Supply chain disruptions can lead to equipment shortages and price volatility. The need for skilled technicians and radiologists also adds complexity. These challenges impact market growth, requiring strategic adaptations for continued expansion.
Emerging Opportunities in UK Computed Tomography Industry
The UK CT market presents opportunities. The integration of AI and machine learning in CT scans leads to faster analysis and more precise diagnostics. Strategic partnerships between manufacturers and healthcare providers increase access to advanced technologies. Expanding into remote healthcare settings through mobile CT units and telehealth solutions creates new revenue streams.
Leading Players in the UK Computed Tomography Industry Sector
- GE Healthcare
- Koning corporation
- Siemens Healthineers AG
- Canon Medical Systems Corporation (Toshiba Corporation)
- Neusoft Medical Systems Co Ltd
- Carestream Health
- Koninklijke Philips NV
- Stryker Corporation
- Planmeca Group (Planmed OY)
- Samsung Electronics Co Ltd
- Fujifilm Holdings Corporation
Key Milestones in UK Computed Tomography Industry Industry
- October 2021: Canon Medical Systems UK installed two new CT scanners at Surrey and Sussex Healthcare NHS Trust, increasing outpatient imaging capacity by 1000 scans monthly.
- April 2022: A new EUR 1.3 Million CT scanner was installed at North Tyneside Hospital, funded by EUR 350 Million from the DHSC.
Strategic Outlook for UK Computed Tomography Industry Market
The UK CT market holds significant future potential, driven by continuous technological innovation, increasing healthcare expenditure, and the growing prevalence of chronic diseases. Strategic partnerships, focusing on bundled service offerings and AI-driven solutions, will be crucial for success. Market expansion into underserved regions and the adoption of advanced imaging techniques will contribute to sustained growth in the coming years.
UK Computed Tomography Industry Segmentation
-
1. Type
- 1.1. Low Slice
- 1.2. Medium Slice
- 1.3. High Slice
-
2. Application
- 2.1. Oncology
- 2.2. Neurology
- 2.3. Cardiovascular
- 2.4. Musculoskeletal
- 2.5. Other Applications
-
3. End User
- 3.1. Hospitals
- 3.2. Diagnostic Centers
- 3.3. Other End Users
UK Computed Tomography Industry Segmentation By Geography
-
1. North America
- 1.1. United States
- 1.2. Canada
- 1.3. Mexico
-
2. South America
- 2.1. Brazil
- 2.2. Argentina
- 2.3. Rest of South America
-
3. Europe
- 3.1. United Kingdom
- 3.2. Germany
- 3.3. France
- 3.4. Italy
- 3.5. Spain
- 3.6. Russia
- 3.7. Benelux
- 3.8. Nordics
- 3.9. Rest of Europe
-
4. Middle East & Africa
- 4.1. Turkey
- 4.2. Israel
- 4.3. GCC
- 4.4. North Africa
- 4.5. South Africa
- 4.6. Rest of Middle East & Africa
-
5. Asia Pacific
- 5.1. China
- 5.2. India
- 5.3. Japan
- 5.4. South Korea
- 5.5. ASEAN
- 5.6. Oceania
- 5.7. Rest of Asia Pacific
UK Computed Tomography Industry REPORT HIGHLIGHTS
| Aspects | Details |
|---|---|
| Study Period | 2019-2033 |
| Base Year | 2024 |
| Estimated Year | 2025 |
| Forecast Period | 2025-2033 |
| Historical Period | 2019-2024 |
| Growth Rate | CAGR of 6.33% from 2019-2033 |
| Segmentation |
|
Table of Contents
- 1. Introduction
- 1.1. Research Scope
- 1.2. Market Segmentation
- 1.3. Research Methodology
- 1.4. Definitions and Assumptions
- 2. Executive Summary
- 2.1. Introduction
- 3. Market Dynamics
- 3.1. Introduction
- 3.2. Market Drivers
- 3.2.1. Increasing Prevalence of Chronic Diseases; Rising Geriatric Population; Increasing Technological Advancements
- 3.3. Market Restrains
- 3.3.1. Lack Of Proper Reimbursement And Stringent Regulatory Approval Procedures; High Cost of Equipment
- 3.4. Market Trends
- 3.4.1. Oncology Segment is Expected to Hold a Significant Market Share Over the Forecast Period
- 4. Market Factor Analysis
- 4.1. Porters Five Forces
- 4.2. Supply/Value Chain
- 4.3. PESTEL analysis
- 4.4. Market Entropy
- 4.5. Patent/Trademark Analysis
- 5. Global UK Computed Tomography Industry Analysis, Insights and Forecast, 2019-2031
- 5.1. Market Analysis, Insights and Forecast - by Type
- 5.1.1. Low Slice
- 5.1.2. Medium Slice
- 5.1.3. High Slice
- 5.2. Market Analysis, Insights and Forecast - by Application
- 5.2.1. Oncology
- 5.2.2. Neurology
- 5.2.3. Cardiovascular
- 5.2.4. Musculoskeletal
- 5.2.5. Other Applications
- 5.3. Market Analysis, Insights and Forecast - by End User
- 5.3.1. Hospitals
- 5.3.2. Diagnostic Centers
- 5.3.3. Other End Users
- 5.4. Market Analysis, Insights and Forecast - by Region
- 5.4.1. North America
- 5.4.2. South America
- 5.4.3. Europe
- 5.4.4. Middle East & Africa
- 5.4.5. Asia Pacific
- 5.1. Market Analysis, Insights and Forecast - by Type
- 6. North America UK Computed Tomography Industry Analysis, Insights and Forecast, 2019-2031
- 6.1. Market Analysis, Insights and Forecast - by Type
- 6.1.1. Low Slice
- 6.1.2. Medium Slice
- 6.1.3. High Slice
- 6.2. Market Analysis, Insights and Forecast - by Application
- 6.2.1. Oncology
- 6.2.2. Neurology
- 6.2.3. Cardiovascular
- 6.2.4. Musculoskeletal
- 6.2.5. Other Applications
- 6.3. Market Analysis, Insights and Forecast - by End User
- 6.3.1. Hospitals
- 6.3.2. Diagnostic Centers
- 6.3.3. Other End Users
- 6.1. Market Analysis, Insights and Forecast - by Type
- 7. South America UK Computed Tomography Industry Analysis, Insights and Forecast, 2019-2031
- 7.1. Market Analysis, Insights and Forecast - by Type
- 7.1.1. Low Slice
- 7.1.2. Medium Slice
- 7.1.3. High Slice
- 7.2. Market Analysis, Insights and Forecast - by Application
- 7.2.1. Oncology
- 7.2.2. Neurology
- 7.2.3. Cardiovascular
- 7.2.4. Musculoskeletal
- 7.2.5. Other Applications
- 7.3. Market Analysis, Insights and Forecast - by End User
- 7.3.1. Hospitals
- 7.3.2. Diagnostic Centers
- 7.3.3. Other End Users
- 7.1. Market Analysis, Insights and Forecast - by Type
- 8. Europe UK Computed Tomography Industry Analysis, Insights and Forecast, 2019-2031
- 8.1. Market Analysis, Insights and Forecast - by Type
- 8.1.1. Low Slice
- 8.1.2. Medium Slice
- 8.1.3. High Slice
- 8.2. Market Analysis, Insights and Forecast - by Application
- 8.2.1. Oncology
- 8.2.2. Neurology
- 8.2.3. Cardiovascular
- 8.2.4. Musculoskeletal
- 8.2.5. Other Applications
- 8.3. Market Analysis, Insights and Forecast - by End User
- 8.3.1. Hospitals
- 8.3.2. Diagnostic Centers
- 8.3.3. Other End Users
- 8.1. Market Analysis, Insights and Forecast - by Type
- 9. Middle East & Africa UK Computed Tomography Industry Analysis, Insights and Forecast, 2019-2031
- 9.1. Market Analysis, Insights and Forecast - by Type
- 9.1.1. Low Slice
- 9.1.2. Medium Slice
- 9.1.3. High Slice
- 9.2. Market Analysis, Insights and Forecast - by Application
- 9.2.1. Oncology
- 9.2.2. Neurology
- 9.2.3. Cardiovascular
- 9.2.4. Musculoskeletal
- 9.2.5. Other Applications
- 9.3. Market Analysis, Insights and Forecast - by End User
- 9.3.1. Hospitals
- 9.3.2. Diagnostic Centers
- 9.3.3. Other End Users
- 9.1. Market Analysis, Insights and Forecast - by Type
- 10. Asia Pacific UK Computed Tomography Industry Analysis, Insights and Forecast, 2019-2031
- 10.1. Market Analysis, Insights and Forecast - by Type
- 10.1.1. Low Slice
- 10.1.2. Medium Slice
- 10.1.3. High Slice
- 10.2. Market Analysis, Insights and Forecast - by Application
- 10.2.1. Oncology
- 10.2.2. Neurology
- 10.2.3. Cardiovascular
- 10.2.4. Musculoskeletal
- 10.2.5. Other Applications
- 10.3. Market Analysis, Insights and Forecast - by End User
- 10.3.1. Hospitals
- 10.3.2. Diagnostic Centers
- 10.3.3. Other End Users
- 10.1. Market Analysis, Insights and Forecast - by Type
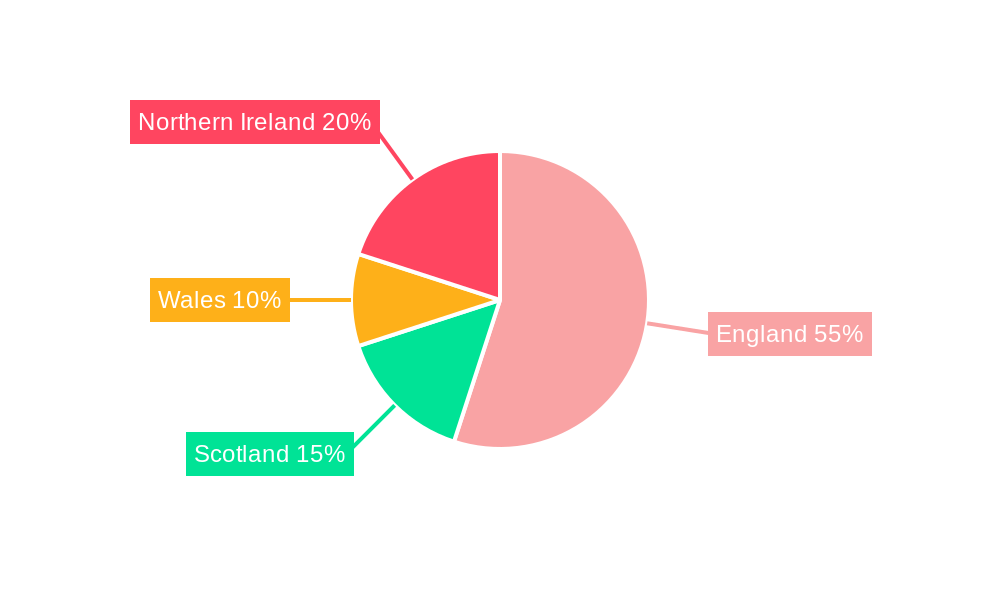
- 11. England UK Computed Tomography Industry Analysis, Insights and Forecast, 2019-2031
- 12. Wales UK Computed Tomography Industry Analysis, Insights and Forecast, 2019-2031
- 13. Scotland UK Computed Tomography Industry Analysis, Insights and Forecast, 2019-2031
- 14. Northern UK Computed Tomography Industry Analysis, Insights and Forecast, 2019-2031
- 15. Ireland UK Computed Tomography Industry Analysis, Insights and Forecast, 2019-2031
- 16. Competitive Analysis
- 16.1. Global Market Share Analysis 2024
- 16.2. Company Profiles
- 16.2.1 GE Healthcare
- 16.2.1.1. Overview
- 16.2.1.2. Products
- 16.2.1.3. SWOT Analysis
- 16.2.1.4. Recent Developments
- 16.2.1.5. Financials (Based on Availability)
- 16.2.2 Koning corporation
- 16.2.2.1. Overview
- 16.2.2.2. Products
- 16.2.2.3. SWOT Analysis
- 16.2.2.4. Recent Developments
- 16.2.2.5. Financials (Based on Availability)
- 16.2.3 Siemens Healthineers AG
- 16.2.3.1. Overview
- 16.2.3.2. Products
- 16.2.3.3. SWOT Analysis
- 16.2.3.4. Recent Developments
- 16.2.3.5. Financials (Based on Availability)
- 16.2.4 Canon Medical Systems Corporation (Toshiba Corporation)
- 16.2.4.1. Overview
- 16.2.4.2. Products
- 16.2.4.3. SWOT Analysis
- 16.2.4.4. Recent Developments
- 16.2.4.5. Financials (Based on Availability)
- 16.2.5 Neusoft Medical Systems Co Ltd
- 16.2.5.1. Overview
- 16.2.5.2. Products
- 16.2.5.3. SWOT Analysis
- 16.2.5.4. Recent Developments
- 16.2.5.5. Financials (Based on Availability)
- 16.2.6 Carestream Health
- 16.2.6.1. Overview
- 16.2.6.2. Products
- 16.2.6.3. SWOT Analysis
- 16.2.6.4. Recent Developments
- 16.2.6.5. Financials (Based on Availability)
- 16.2.7 Koninklijke Philips NV
- 16.2.7.1. Overview
- 16.2.7.2. Products
- 16.2.7.3. SWOT Analysis
- 16.2.7.4. Recent Developments
- 16.2.7.5. Financials (Based on Availability)
- 16.2.8 Stryker Corporation
- 16.2.8.1. Overview
- 16.2.8.2. Products
- 16.2.8.3. SWOT Analysis
- 16.2.8.4. Recent Developments
- 16.2.8.5. Financials (Based on Availability)
- 16.2.9 Planmeca Group (Planmed OY)
- 16.2.9.1. Overview
- 16.2.9.2. Products
- 16.2.9.3. SWOT Analysis
- 16.2.9.4. Recent Developments
- 16.2.9.5. Financials (Based on Availability)
- 16.2.10 Samsung Electronics Co Ltd
- 16.2.10.1. Overview
- 16.2.10.2. Products
- 16.2.10.3. SWOT Analysis
- 16.2.10.4. Recent Developments
- 16.2.10.5. Financials (Based on Availability)
- 16.2.11 Fujifilm Holdings Corporation
- 16.2.11.1. Overview
- 16.2.11.2. Products
- 16.2.11.3. SWOT Analysis
- 16.2.11.4. Recent Developments
- 16.2.11.5. Financials (Based on Availability)
- 16.2.1 GE Healthcare
List of Figures
- Figure 1: Global UK Computed Tomography Industry Revenue Breakdown (Million, %) by Region 2024 & 2032
- Figure 2: United kingdom Region UK Computed Tomography Industry Revenue (Million), by Country 2024 & 2032
- Figure 3: United kingdom Region UK Computed Tomography Industry Revenue Share (%), by Country 2024 & 2032
- Figure 4: North America UK Computed Tomography Industry Revenue (Million), by Type 2024 & 2032
- Figure 5: North America UK Computed Tomography Industry Revenue Share (%), by Type 2024 & 2032
- Figure 6: North America UK Computed Tomography Industry Revenue (Million), by Application 2024 & 2032
- Figure 7: North America UK Computed Tomography Industry Revenue Share (%), by Application 2024 & 2032
- Figure 8: North America UK Computed Tomography Industry Revenue (Million), by End User 2024 & 2032
- Figure 9: North America UK Computed Tomography Industry Revenue Share (%), by End User 2024 & 2032
- Figure 10: North America UK Computed Tomography Industry Revenue (Million), by Country 2024 & 2032
- Figure 11: North America UK Computed Tomography Industry Revenue Share (%), by Country 2024 & 2032
- Figure 12: South America UK Computed Tomography Industry Revenue (Million), by Type 2024 & 2032
- Figure 13: South America UK Computed Tomography Industry Revenue Share (%), by Type 2024 & 2032
- Figure 14: South America UK Computed Tomography Industry Revenue (Million), by Application 2024 & 2032
- Figure 15: South America UK Computed Tomography Industry Revenue Share (%), by Application 2024 & 2032
- Figure 16: South America UK Computed Tomography Industry Revenue (Million), by End User 2024 & 2032
- Figure 17: South America UK Computed Tomography Industry Revenue Share (%), by End User 2024 & 2032
- Figure 18: South America UK Computed Tomography Industry Revenue (Million), by Country 2024 & 2032
- Figure 19: South America UK Computed Tomography Industry Revenue Share (%), by Country 2024 & 2032
- Figure 20: Europe UK Computed Tomography Industry Revenue (Million), by Type 2024 & 2032
- Figure 21: Europe UK Computed Tomography Industry Revenue Share (%), by Type 2024 & 2032
- Figure 22: Europe UK Computed Tomography Industry Revenue (Million), by Application 2024 & 2032
- Figure 23: Europe UK Computed Tomography Industry Revenue Share (%), by Application 2024 & 2032
- Figure 24: Europe UK Computed Tomography Industry Revenue (Million), by End User 2024 & 2032
- Figure 25: Europe UK Computed Tomography Industry Revenue Share (%), by End User 2024 & 2032
- Figure 26: Europe UK Computed Tomography Industry Revenue (Million), by Country 2024 & 2032
- Figure 27: Europe UK Computed Tomography Industry Revenue Share (%), by Country 2024 & 2032
- Figure 28: Middle East & Africa UK Computed Tomography Industry Revenue (Million), by Type 2024 & 2032
- Figure 29: Middle East & Africa UK Computed Tomography Industry Revenue Share (%), by Type 2024 & 2032
- Figure 30: Middle East & Africa UK Computed Tomography Industry Revenue (Million), by Application 2024 & 2032
- Figure 31: Middle East & Africa UK Computed Tomography Industry Revenue Share (%), by Application 2024 & 2032
- Figure 32: Middle East & Africa UK Computed Tomography Industry Revenue (Million), by End User 2024 & 2032
- Figure 33: Middle East & Africa UK Computed Tomography Industry Revenue Share (%), by End User 2024 & 2032
- Figure 34: Middle East & Africa UK Computed Tomography Industry Revenue (Million), by Country 2024 & 2032
- Figure 35: Middle East & Africa UK Computed Tomography Industry Revenue Share (%), by Country 2024 & 2032
- Figure 36: Asia Pacific UK Computed Tomography Industry Revenue (Million), by Type 2024 & 2032
- Figure 37: Asia Pacific UK Computed Tomography Industry Revenue Share (%), by Type 2024 & 2032
- Figure 38: Asia Pacific UK Computed Tomography Industry Revenue (Million), by Application 2024 & 2032
- Figure 39: Asia Pacific UK Computed Tomography Industry Revenue Share (%), by Application 2024 & 2032
- Figure 40: Asia Pacific UK Computed Tomography Industry Revenue (Million), by End User 2024 & 2032
- Figure 41: Asia Pacific UK Computed Tomography Industry Revenue Share (%), by End User 2024 & 2032
- Figure 42: Asia Pacific UK Computed Tomography Industry Revenue (Million), by Country 2024 & 2032
- Figure 43: Asia Pacific UK Computed Tomography Industry Revenue Share (%), by Country 2024 & 2032
List of Tables
- Table 1: Global UK Computed Tomography Industry Revenue Million Forecast, by Region 2019 & 2032
- Table 2: Global UK Computed Tomography Industry Revenue Million Forecast, by Type 2019 & 2032
- Table 3: Global UK Computed Tomography Industry Revenue Million Forecast, by Application 2019 & 2032
- Table 4: Global UK Computed Tomography Industry Revenue Million Forecast, by End User 2019 & 2032
- Table 5: Global UK Computed Tomography Industry Revenue Million Forecast, by Region 2019 & 2032
- Table 6: Global UK Computed Tomography Industry Revenue Million Forecast, by Country 2019 & 2032
- Table 7: England UK Computed Tomography Industry Revenue (Million) Forecast, by Application 2019 & 2032
- Table 8: Wales UK Computed Tomography Industry Revenue (Million) Forecast, by Application 2019 & 2032
- Table 9: Scotland UK Computed Tomography Industry Revenue (Million) Forecast, by Application 2019 & 2032
- Table 10: Northern UK Computed Tomography Industry Revenue (Million) Forecast, by Application 2019 & 2032
- Table 11: Ireland UK Computed Tomography Industry Revenue (Million) Forecast, by Application 2019 & 2032
- Table 12: Global UK Computed Tomography Industry Revenue Million Forecast, by Type 2019 & 2032
- Table 13: Global UK Computed Tomography Industry Revenue Million Forecast, by Application 2019 & 2032
- Table 14: Global UK Computed Tomography Industry Revenue Million Forecast, by End User 2019 & 2032
- Table 15: Global UK Computed Tomography Industry Revenue Million Forecast, by Country 2019 & 2032
- Table 16: United States UK Computed Tomography Industry Revenue (Million) Forecast, by Application 2019 & 2032
- Table 17: Canada UK Computed Tomography Industry Revenue (Million) Forecast, by Application 2019 & 2032
- Table 18: Mexico UK Computed Tomography Industry Revenue (Million) Forecast, by Application 2019 & 2032
- Table 19: Global UK Computed Tomography Industry Revenue Million Forecast, by Type 2019 & 2032
- Table 20: Global UK Computed Tomography Industry Revenue Million Forecast, by Application 2019 & 2032
- Table 21: Global UK Computed Tomography Industry Revenue Million Forecast, by End User 2019 & 2032
- Table 22: Global UK Computed Tomography Industry Revenue Million Forecast, by Country 2019 & 2032
- Table 23: Brazil UK Computed Tomography Industry Revenue (Million) Forecast, by Application 2019 & 2032
- Table 24: Argentina UK Computed Tomography Industry Revenue (Million) Forecast, by Application 2019 & 2032
- Table 25: Rest of South America UK Computed Tomography Industry Revenue (Million) Forecast, by Application 2019 & 2032
- Table 26: Global UK Computed Tomography Industry Revenue Million Forecast, by Type 2019 & 2032
- Table 27: Global UK Computed Tomography Industry Revenue Million Forecast, by Application 2019 & 2032
- Table 28: Global UK Computed Tomography Industry Revenue Million Forecast, by End User 2019 & 2032
- Table 29: Global UK Computed Tomography Industry Revenue Million Forecast, by Country 2019 & 2032
- Table 30: United Kingdom UK Computed Tomography Industry Revenue (Million) Forecast, by Application 2019 & 2032
- Table 31: Germany UK Computed Tomography Industry Revenue (Million) Forecast, by Application 2019 & 2032
- Table 32: France UK Computed Tomography Industry Revenue (Million) Forecast, by Application 2019 & 2032
- Table 33: Italy UK Computed Tomography Industry Revenue (Million) Forecast, by Application 2019 & 2032
- Table 34: Spain UK Computed Tomography Industry Revenue (Million) Forecast, by Application 2019 & 2032
- Table 35: Russia UK Computed Tomography Industry Revenue (Million) Forecast, by Application 2019 & 2032
- Table 36: Benelux UK Computed Tomography Industry Revenue (Million) Forecast, by Application 2019 & 2032
- Table 37: Nordics UK Computed Tomography Industry Revenue (Million) Forecast, by Application 2019 & 2032
- Table 38: Rest of Europe UK Computed Tomography Industry Revenue (Million) Forecast, by Application 2019 & 2032
- Table 39: Global UK Computed Tomography Industry Revenue Million Forecast, by Type 2019 & 2032
- Table 40: Global UK Computed Tomography Industry Revenue Million Forecast, by Application 2019 & 2032
- Table 41: Global UK Computed Tomography Industry Revenue Million Forecast, by End User 2019 & 2032
- Table 42: Global UK Computed Tomography Industry Revenue Million Forecast, by Country 2019 & 2032
- Table 43: Turkey UK Computed Tomography Industry Revenue (Million) Forecast, by Application 2019 & 2032
- Table 44: Israel UK Computed Tomography Industry Revenue (Million) Forecast, by Application 2019 & 2032
- Table 45: GCC UK Computed Tomography Industry Revenue (Million) Forecast, by Application 2019 & 2032
- Table 46: North Africa UK Computed Tomography Industry Revenue (Million) Forecast, by Application 2019 & 2032
- Table 47: South Africa UK Computed Tomography Industry Revenue (Million) Forecast, by Application 2019 & 2032
- Table 48: Rest of Middle East & Africa UK Computed Tomography Industry Revenue (Million) Forecast, by Application 2019 & 2032
- Table 49: Global UK Computed Tomography Industry Revenue Million Forecast, by Type 2019 & 2032
- Table 50: Global UK Computed Tomography Industry Revenue Million Forecast, by Application 2019 & 2032
- Table 51: Global UK Computed Tomography Industry Revenue Million Forecast, by End User 2019 & 2032
- Table 52: Global UK Computed Tomography Industry Revenue Million Forecast, by Country 2019 & 2032
- Table 53: China UK Computed Tomography Industry Revenue (Million) Forecast, by Application 2019 & 2032
- Table 54: India UK Computed Tomography Industry Revenue (Million) Forecast, by Application 2019 & 2032
- Table 55: Japan UK Computed Tomography Industry Revenue (Million) Forecast, by Application 2019 & 2032
- Table 56: South Korea UK Computed Tomography Industry Revenue (Million) Forecast, by Application 2019 & 2032
- Table 57: ASEAN UK Computed Tomography Industry Revenue (Million) Forecast, by Application 2019 & 2032
- Table 58: Oceania UK Computed Tomography Industry Revenue (Million) Forecast, by Application 2019 & 2032
- Table 59: Rest of Asia Pacific UK Computed Tomography Industry Revenue (Million) Forecast, by Application 2019 & 2032
Frequently Asked Questions
1. What is the projected Compound Annual Growth Rate (CAGR) of the UK Computed Tomography Industry?
The projected CAGR is approximately 6.33%.
2. Which companies are prominent players in the UK Computed Tomography Industry?
Key companies in the market include GE Healthcare, Koning corporation, Siemens Healthineers AG, Canon Medical Systems Corporation (Toshiba Corporation), Neusoft Medical Systems Co Ltd, Carestream Health, Koninklijke Philips NV, Stryker Corporation, Planmeca Group (Planmed OY), Samsung Electronics Co Ltd, Fujifilm Holdings Corporation.
3. What are the main segments of the UK Computed Tomography Industry?
The market segments include Type, Application, End User.
4. Can you provide details about the market size?
The market size is estimated to be USD 467.43 Million as of 2022.
5. What are some drivers contributing to market growth?
Increasing Prevalence of Chronic Diseases; Rising Geriatric Population; Increasing Technological Advancements.
6. What are the notable trends driving market growth?
Oncology Segment is Expected to Hold a Significant Market Share Over the Forecast Period.
7. Are there any restraints impacting market growth?
Lack Of Proper Reimbursement And Stringent Regulatory Approval Procedures; High Cost of Equipment.
8. Can you provide examples of recent developments in the market?
In April 2022, a new EUR 1.3m CT scanner was installed at North Tyneside Hospital with the funding of EUR 350 million from the Department of Health and Social Care (DHSC).
9. What pricing options are available for accessing the report?
Pricing options include single-user, multi-user, and enterprise licenses priced at USD 3800, USD 4500, and USD 5800 respectively.
10. Is the market size provided in terms of value or volume?
The market size is provided in terms of value, measured in Million.
11. Are there any specific market keywords associated with the report?
Yes, the market keyword associated with the report is "UK Computed Tomography Industry," which aids in identifying and referencing the specific market segment covered.
12. How do I determine which pricing option suits my needs best?
The pricing options vary based on user requirements and access needs. Individual users may opt for single-user licenses, while businesses requiring broader access may choose multi-user or enterprise licenses for cost-effective access to the report.
13. Are there any additional resources or data provided in the UK Computed Tomography Industry report?
While the report offers comprehensive insights, it's advisable to review the specific contents or supplementary materials provided to ascertain if additional resources or data are available.
14. How can I stay updated on further developments or reports in the UK Computed Tomography Industry?
To stay informed about further developments, trends, and reports in the UK Computed Tomography Industry, consider subscribing to industry newsletters, following relevant companies and organizations, or regularly checking reputable industry news sources and publications.
Methodology
Step 1 - Identification of Relevant Samples Size from Population Database


Step 2 - Approaches for Defining Global Market Size (Value, Volume* & Price*)

Note*: In applicable scenarios
Step 3 - Data Sources
Primary Research
- Web Analytics
- Survey Reports
- Research Institute
- Latest Research Reports
- Opinion Leaders
Secondary Research
- Annual Reports
- White Paper
- Latest Press Release
- Industry Association
- Paid Database
- Investor Presentations

Step 4 - Data Triangulation
Involves using different sources of information in order to increase the validity of a study
These sources are likely to be stakeholders in a program - participants, other researchers, program staff, other community members, and so on.
Then we put all data in single framework & apply various statistical tools to find out the dynamic on the market.
During the analysis stage, feedback from the stakeholder groups would be compared to determine areas of agreement as well as areas of divergence
