

Key Insights
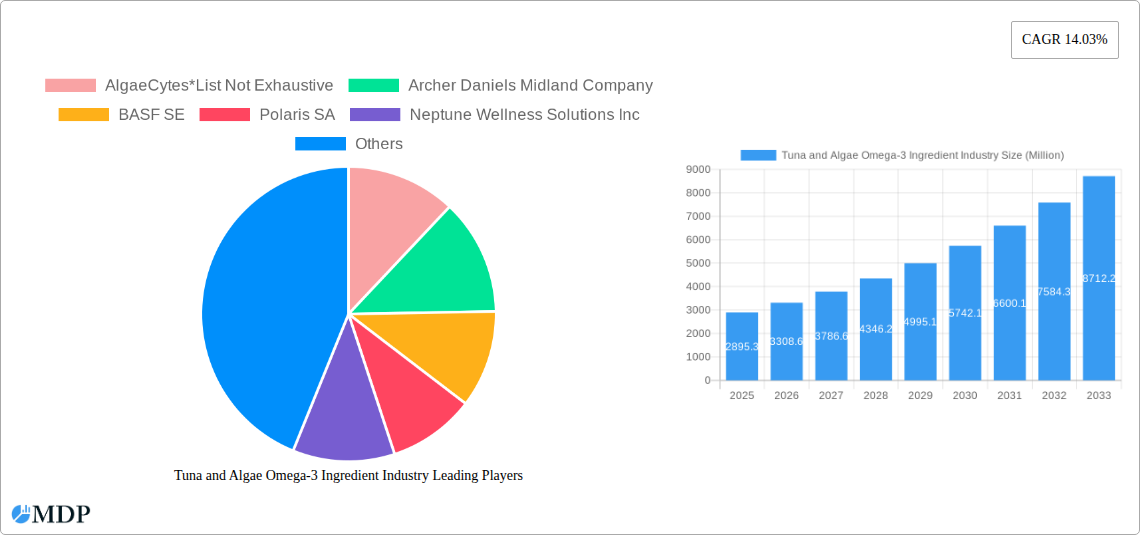
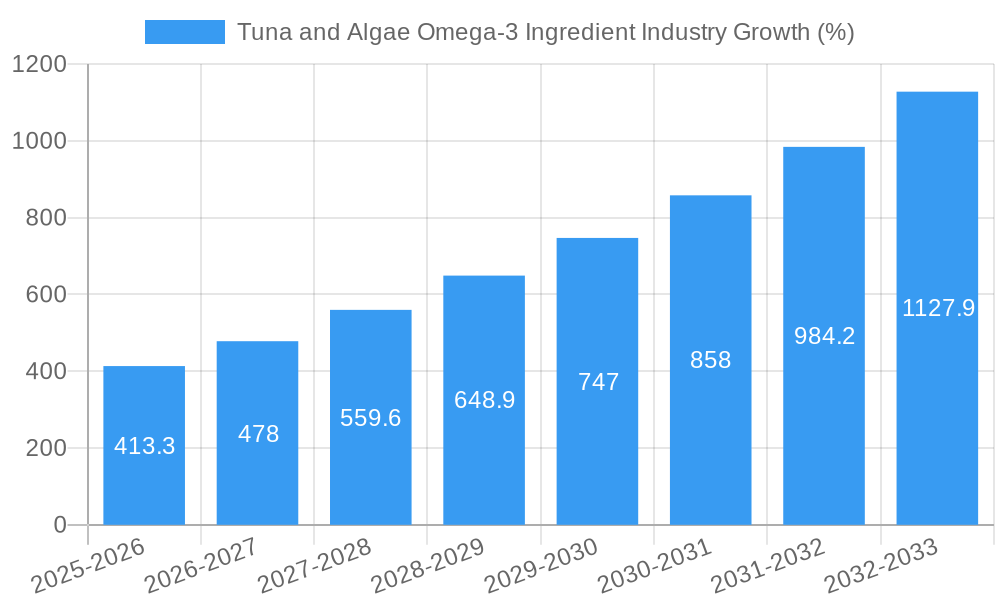
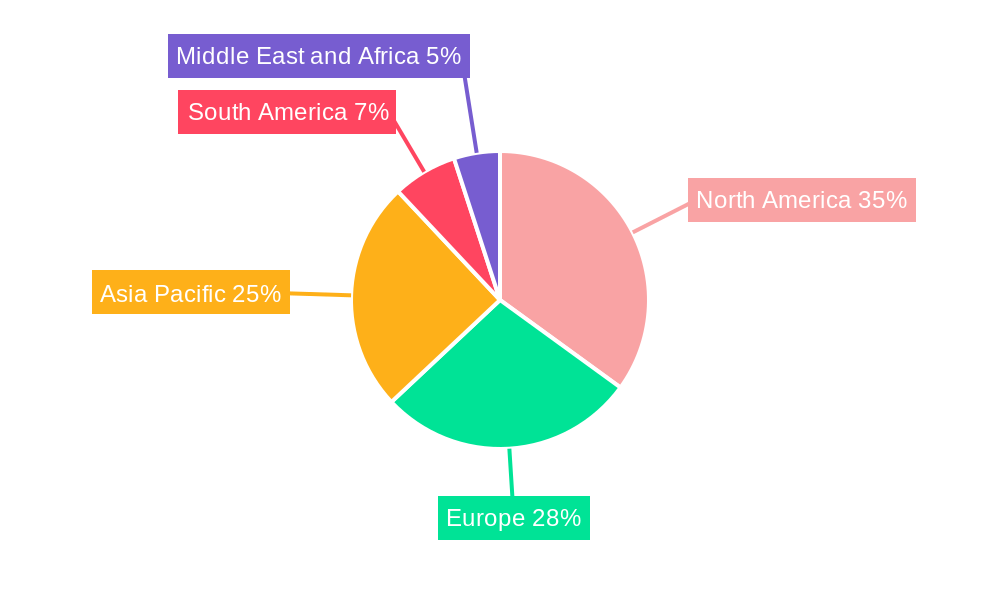
The global tuna and algae omega-3 ingredient market is experiencing robust growth, projected to reach $2,895.3 million in 2025 and exhibiting a Compound Annual Growth Rate (CAGR) of 14.03%. This expansion is driven by several key factors. Increasing consumer awareness of the health benefits associated with omega-3 fatty acids, particularly their role in cardiovascular health, brain function, and reducing inflammation, fuels demand for omega-3 supplements. The growing preference for sustainable and plant-based sources of omega-3s is further boosting the market for algae-based ingredients, offering a viable alternative to traditional fish oil derived from tuna. The market is segmented by algae type (e.g., microalgae, macroalgae), concentration levels (high, medium, low), tuna species used (if applicable), and application (food and beverage, dietary supplements, pharmaceuticals, animal nutrition, clinical nutrition). North America, Europe, and Asia-Pacific currently dominate the market, with these regions projected to continue their strong growth trajectory throughout the forecast period (2025-2033). However, increasing demand from emerging markets in South America and the Middle East & Africa presents significant opportunities for market expansion. Challenges include the relatively high cost of production for some algae-based omega-3s, the need for further research to establish long-term efficacy, and the development of robust supply chains to meet growing demand.
The strategic investments by major players like AlgaeCytes, Archer Daniels Midland Company, BASF SE, and others, are instrumental in driving innovation and expanding production capacity. Technological advancements in algae cultivation and extraction processes are also contributing to market growth by making these ingredients more cost-effective and accessible. Future growth will likely be shaped by the development of new product formulations and delivery systems, focusing on improved bioavailability and enhanced consumer appeal. Furthermore, a growing emphasis on sustainability and traceability within the supply chain is likely to drive demand for responsibly sourced algae-based omega-3s. Regulatory frameworks and industry standards related to omega-3 claims and labeling will also play a significant role in shaping market trends. Overall, the market presents a compelling investment opportunity for businesses seeking to capitalize on the burgeoning demand for healthy and sustainable nutrition solutions.
Tuna and Algae Omega-3 Ingredient Industry: A Comprehensive Market Report (2019-2033)
This in-depth report provides a comprehensive analysis of the Tuna and Algae Omega-3 Ingredient industry, covering market dynamics, trends, leading players, and future prospects. The study period spans from 2019 to 2033, with 2025 serving as both the base and estimated year. This report is crucial for industry stakeholders, investors, and researchers seeking actionable insights into this rapidly evolving market. Expect detailed breakdowns of market segments, competitive landscapes, and future growth drivers. Projected market values are in Millions.
Tuna and Algae Omega-3 Ingredient Industry Market Dynamics & Concentration
This section analyzes the competitive intensity, innovation drivers, regulatory landscape, product substitutes, end-user trends, and merger & acquisition (M&A) activity within the Tuna and Algae Omega-3 Ingredient market. The market is characterized by a moderate level of concentration, with key players holding significant market share. However, the entry of new players, particularly in the algae-based segment, is increasing competition. Innovation in sustainable cultivation techniques and enhanced extraction methods are driving market growth.
- Market Concentration: The top 5 players account for approximately xx% of the global market share (2025 estimate). The market is witnessing increased competition due to the entry of smaller, specialized companies focusing on niche segments.
- Innovation Drivers: Technological advancements in algae cultivation, particularly in bioreactor technology, are significantly impacting production costs and yield. Research into novel extraction methods is improving the quality and purity of Omega-3 ingredients.
- Regulatory Frameworks: Government regulations concerning food safety and labeling standards influence market growth. Stringent regulations in certain regions present challenges while also fostering trust and consumer confidence.
- Product Substitutes: Fish oil remains a primary competitor. However, the growing awareness of sustainability and ethical sourcing issues associated with fish oil is driving a shift towards algae-based alternatives.
- End-User Trends: The increasing demand for plant-based and sustainable products, coupled with the growing awareness of the health benefits of Omega-3s, is driving significant growth in the market.
- M&A Activities: The number of M&A deals in the industry has shown a steady increase over the past five years, indicating consolidation and strategic expansion by leading players. An estimated xx M&A deals were recorded between 2019 and 2024.
Tuna and Algae Omega-3 Ingredient Industry Industry Trends & Analysis
This section delves into the key trends shaping the Tuna and Algae Omega-3 Ingredient market. The market is experiencing robust growth driven by increasing consumer health consciousness and the rising demand for sustainable and plant-based alternatives to traditional Omega-3 sources. Technological advancements and product innovation are contributing significantly to market expansion.
The market is projected to witness a Compound Annual Growth Rate (CAGR) of xx% during the forecast period (2025-2033). This growth is attributed to several factors, including:
- Growing awareness of Omega-3 benefits: Consumers are increasingly aware of the crucial role of Omega-3s in maintaining overall health and preventing chronic diseases.
- Demand for sustainable alternatives: Concerns about overfishing and the environmental impact of fish oil production are fueling demand for sustainably sourced Omega-3s like those derived from algae.
- Technological advancements: Advancements in algae cultivation technologies, extraction methods, and downstream processing are making algae-based Omega-3s more cost-effective and scalable.
- Product innovation: The market is seeing the development of new products with enhanced bioavailability, stability, and functionality.
- Market Penetration: The market penetration of algae-based Omega-3 ingredients is growing rapidly, especially in the dietary supplement and food & beverage sectors.
Leading Markets & Segments in Tuna and Algae Omega-3 Ingredient Industry
This section identifies the dominant regions, countries, and market segments within the Tuna and Algae Omega-3 Ingredient industry. The North American and European markets currently hold a significant share of the global market. However, the Asia-Pacific region is poised for substantial growth due to rising disposable incomes and increasing health awareness.
Key Drivers:
- Economic Policies: Government initiatives supporting sustainable aquaculture and the production of functional foods are driving market growth in several regions.
- Infrastructure: The availability of advanced infrastructure, including research facilities and manufacturing capabilities, influences regional market dominance.
Dominance Analysis:
- Region: North America currently dominates the market, followed by Europe. The Asia-Pacific region is experiencing rapid growth and is projected to become a significant market in the coming years.
- Country: The United States and Germany are currently the leading markets.
- Type (Algae Type): Schizochytrium sp. and other microalgae species are the dominant types used for Omega-3 production.
- Concentration Type: High-concentration Omega-3 ingredients are gaining popularity due to their higher potency and reduced dosage requirements.
- Tuna Type: The demand for sustainably sourced tuna is increasing, driving the growth of the tuna-based Omega-3 segment. However, algae-based Omega-3s are increasingly preferred due to sustainability concerns.
- Application: The food and beverage industry, including fortified foods and beverages, accounts for the largest share of Omega-3 ingredient consumption. Dietary supplements represent a significant and rapidly growing segment, while pharmaceutical, animal nutrition, and clinical nutrition applications are expanding.
Tuna and Algae Omega-3 Ingredient Industry Product Developments
Recent advancements have focused on improving the efficacy, stability, and sustainability of Omega-3 ingredients. Companies are investing in technologies to enhance the bioavailability of Omega-3s and develop innovative delivery systems. The emphasis on natural and sustainable sourcing is driving innovation in algae cultivation and extraction methods. New product formulations are tailored to meet the diverse needs of different consumer segments, including vegan, vegetarian, and health-conscious individuals.
Key Drivers of Tuna and Algae Omega-3 Ingredient Industry Growth
The Tuna and Algae Omega-3 Ingredient market is propelled by several key factors. These include the rising global awareness of the health benefits of Omega-3 fatty acids, the growing preference for plant-based and sustainable food products, and technological advancements that improve the production efficiency and quality of algae-based Omega-3s. Government regulations promoting sustainable aquaculture and the inclusion of Omega-3s in functional foods also contribute significantly to market expansion. For instance, the increasing demand for fortified foods and functional beverages is a primary driver.
Challenges in the Tuna and Algae Omega-3 Ingredient Industry Market
The industry faces challenges related to the scalability and cost-effectiveness of algae cultivation, ensuring the consistent quality and purity of Omega-3 ingredients, and navigating fluctuating raw material prices. Regulatory hurdles and stringent quality control requirements in various regions add complexity. Maintaining a sustainable supply chain and competing against established players in the market are further challenges. The impact of these challenges is estimated to reduce the market growth by xx% annually in the next 5 years.
Emerging Opportunities in Tuna and Algae Omega-3 Ingredient Industry
Emerging opportunities lie in the development of novel algae strains with enhanced Omega-3 content, the exploration of innovative downstream processing technologies, and the expansion into new applications such as animal feed and nutraceuticals. Strategic partnerships with key players in the food and beverage industry and the development of new product formulations catering to specific consumer needs represent further growth catalysts. The potential for market expansion in developing countries with growing health awareness also presents significant opportunities.
Leading Players in the Tuna and Algae Omega-3 Ingredient Industry Sector
- AlgaeCytes
- Archer Daniels Midland Company (ADM)
- BASF SE (BASF)
- Polaris SA
- Neptune Wellness Solutions Inc (Neptune Wellness)
- Koninklijke DSM NV (DSM)
- Bioprocess Algae LLC
- Lonza (Lonza)
- Corbion NV (Corbion)
- Source-Omega LLC
Key Milestones in Tuna and Algae Omega-3 Ingredient Industry Industry
- June 2021: Polaris launched Omegavie DHA 800 algae oil, highlighting its high potency and sustainable production. This launch significantly impacted the market by introducing a high-quality, plant-based alternative.
- January 2022: AlgaeCytes secured EUR 16 million in funding, signifying substantial investment in expanding algae production capacity in Europe, influencing the future supply of algae-based Omega-3s.
- February 2022: Polaris partnered with Golden Omega USA, expanding its North American distribution network and increasing market reach.
Strategic Outlook for Tuna and Algae Omega-3 Ingredient Industry Market
The Tuna and Algae Omega-3 Ingredient market is poised for significant growth, driven by increasing consumer demand for healthy and sustainable products. Strategic partnerships, investments in research and development, and the expansion into new markets will be crucial for success. Companies that can effectively address the challenges related to scalability, cost, and sustainability will be best positioned to capitalize on the market's considerable potential. The focus on innovation, sustainability, and consumer preferences will continue to shape the market landscape in the years to come.
Tuna and Algae Omega-3 Ingredient Industry Segmentation
-
1. Type
-
1.1. Algae Type
-
1.1.1. Concentration type
- 1.1.1.1. High Concentration
- 1.1.1.2. Medium Concentration
- 1.1.1.3. Low Concentration
-
1.1.1. Concentration type
-
1.2. Tuna Type
- 1.2.1. Crude Tuna Oil
- 1.2.2. Refined Tuna Oil
-
1.1. Algae Type
-
2. Application
-
2.1. Food and Beverage
- 2.1.1. Infant Formula
- 2.1.2. Fortified Food and Beverages
- 2.2. Dietary Supplements
- 2.3. Pharmaceutical
- 2.4. Animal Nutrition
- 2.5. Clinical Nutrition
-
2.1. Food and Beverage
Tuna and Algae Omega-3 Ingredient Industry Segmentation By Geography
-
1. North America
- 1.1. United States
- 1.2. Canada
- 1.3. Mexico
- 1.4. Rest of North America
-
2. Europe
- 2.1. Spain
- 2.2. United Kingdom
- 2.3. Germany
- 2.4. France
- 2.5. Italy
- 2.6. Russia
- 2.7. Rest of Europe
-
3. Asia Pacific
- 3.1. China
- 3.2. Japan
- 3.3. India
- 3.4. Australia
- 3.5. Rest of Asia Pacific
-
4. South America
- 4.1. Brazil
- 4.2. Argentina
- 4.3. Rest of South America
-
5. Middle East and Africa
- 5.1. South Africa
- 5.2. United Arab Emirates
- 5.3. Rest of Middle East and Africa
Tuna and Algae Omega-3 Ingredient Industry REPORT HIGHLIGHTS
| Aspects | Details |
|---|---|
| Study Period | 2019-2033 |
| Base Year | 2024 |
| Estimated Year | 2025 |
| Forecast Period | 2025-2033 |
| Historical Period | 2019-2024 |
| Growth Rate | CAGR of 14.03% from 2019-2033 |
| Segmentation |
|
Table of Contents
- 1. Introduction
- 1.1. Research Scope
- 1.2. Market Segmentation
- 1.3. Research Methodology
- 1.4. Definitions and Assumptions
- 2. Executive Summary
- 2.1. Introduction
- 3. Market Dynamics
- 3.1. Introduction
- 3.2. Market Drivers
- 3.2.1. Increasing Demand For Convenience & Processed Food
- 3.3. Market Restrains
- 3.3.1. Increased Consumer Awareness On Side-Effects Of Chemical Additives
- 3.4. Market Trends
- 3.4.1. Increasing Consumer Expenditure on Omega-3 Supplements Products
- 4. Market Factor Analysis
- 4.1. Porters Five Forces
- 4.2. Supply/Value Chain
- 4.3. PESTEL analysis
- 4.4. Market Entropy
- 4.5. Patent/Trademark Analysis
- 5. Global Tuna and Algae Omega-3 Ingredient Industry Analysis, Insights and Forecast, 2019-2031
- 5.1. Market Analysis, Insights and Forecast - by Type
- 5.1.1. Algae Type
- 5.1.1.1. Concentration type
- 5.1.1.1.1. High Concentration
- 5.1.1.1.2. Medium Concentration
- 5.1.1.1.3. Low Concentration
- 5.1.1.1. Concentration type
- 5.1.2. Tuna Type
- 5.1.2.1. Crude Tuna Oil
- 5.1.2.2. Refined Tuna Oil
- 5.1.1. Algae Type
- 5.2. Market Analysis, Insights and Forecast - by Application
- 5.2.1. Food and Beverage
- 5.2.1.1. Infant Formula
- 5.2.1.2. Fortified Food and Beverages
- 5.2.2. Dietary Supplements
- 5.2.3. Pharmaceutical
- 5.2.4. Animal Nutrition
- 5.2.5. Clinical Nutrition
- 5.2.1. Food and Beverage
- 5.3. Market Analysis, Insights and Forecast - by Region
- 5.3.1. North America
- 5.3.2. Europe
- 5.3.3. Asia Pacific
- 5.3.4. South America
- 5.3.5. Middle East and Africa
- 5.1. Market Analysis, Insights and Forecast - by Type
- 6. North America Tuna and Algae Omega-3 Ingredient Industry Analysis, Insights and Forecast, 2019-2031
- 6.1. Market Analysis, Insights and Forecast - by Type
- 6.1.1. Algae Type
- 6.1.1.1. Concentration type
- 6.1.1.1.1. High Concentration
- 6.1.1.1.2. Medium Concentration
- 6.1.1.1.3. Low Concentration
- 6.1.1.1. Concentration type
- 6.1.2. Tuna Type
- 6.1.2.1. Crude Tuna Oil
- 6.1.2.2. Refined Tuna Oil
- 6.1.1. Algae Type
- 6.2. Market Analysis, Insights and Forecast - by Application
- 6.2.1. Food and Beverage
- 6.2.1.1. Infant Formula
- 6.2.1.2. Fortified Food and Beverages
- 6.2.2. Dietary Supplements
- 6.2.3. Pharmaceutical
- 6.2.4. Animal Nutrition
- 6.2.5. Clinical Nutrition
- 6.2.1. Food and Beverage
- 6.1. Market Analysis, Insights and Forecast - by Type
- 7. Europe Tuna and Algae Omega-3 Ingredient Industry Analysis, Insights and Forecast, 2019-2031
- 7.1. Market Analysis, Insights and Forecast - by Type
- 7.1.1. Algae Type
- 7.1.1.1. Concentration type
- 7.1.1.1.1. High Concentration
- 7.1.1.1.2. Medium Concentration
- 7.1.1.1.3. Low Concentration
- 7.1.1.1. Concentration type
- 7.1.2. Tuna Type
- 7.1.2.1. Crude Tuna Oil
- 7.1.2.2. Refined Tuna Oil
- 7.1.1. Algae Type
- 7.2. Market Analysis, Insights and Forecast - by Application
- 7.2.1. Food and Beverage
- 7.2.1.1. Infant Formula
- 7.2.1.2. Fortified Food and Beverages
- 7.2.2. Dietary Supplements
- 7.2.3. Pharmaceutical
- 7.2.4. Animal Nutrition
- 7.2.5. Clinical Nutrition
- 7.2.1. Food and Beverage
- 7.1. Market Analysis, Insights and Forecast - by Type
- 8. Asia Pacific Tuna and Algae Omega-3 Ingredient Industry Analysis, Insights and Forecast, 2019-2031
- 8.1. Market Analysis, Insights and Forecast - by Type
- 8.1.1. Algae Type
- 8.1.1.1. Concentration type
- 8.1.1.1.1. High Concentration
- 8.1.1.1.2. Medium Concentration
- 8.1.1.1.3. Low Concentration
- 8.1.1.1. Concentration type
- 8.1.2. Tuna Type
- 8.1.2.1. Crude Tuna Oil
- 8.1.2.2. Refined Tuna Oil
- 8.1.1. Algae Type
- 8.2. Market Analysis, Insights and Forecast - by Application
- 8.2.1. Food and Beverage
- 8.2.1.1. Infant Formula
- 8.2.1.2. Fortified Food and Beverages
- 8.2.2. Dietary Supplements
- 8.2.3. Pharmaceutical
- 8.2.4. Animal Nutrition
- 8.2.5. Clinical Nutrition
- 8.2.1. Food and Beverage
- 8.1. Market Analysis, Insights and Forecast - by Type
- 9. South America Tuna and Algae Omega-3 Ingredient Industry Analysis, Insights and Forecast, 2019-2031
- 9.1. Market Analysis, Insights and Forecast - by Type
- 9.1.1. Algae Type
- 9.1.1.1. Concentration type
- 9.1.1.1.1. High Concentration
- 9.1.1.1.2. Medium Concentration
- 9.1.1.1.3. Low Concentration
- 9.1.1.1. Concentration type
- 9.1.2. Tuna Type
- 9.1.2.1. Crude Tuna Oil
- 9.1.2.2. Refined Tuna Oil
- 9.1.1. Algae Type
- 9.2. Market Analysis, Insights and Forecast - by Application
- 9.2.1. Food and Beverage
- 9.2.1.1. Infant Formula
- 9.2.1.2. Fortified Food and Beverages
- 9.2.2. Dietary Supplements
- 9.2.3. Pharmaceutical
- 9.2.4. Animal Nutrition
- 9.2.5. Clinical Nutrition
- 9.2.1. Food and Beverage
- 9.1. Market Analysis, Insights and Forecast - by Type
- 10. Middle East and Africa Tuna and Algae Omega-3 Ingredient Industry Analysis, Insights and Forecast, 2019-2031
- 10.1. Market Analysis, Insights and Forecast - by Type
- 10.1.1. Algae Type
- 10.1.1.1. Concentration type
- 10.1.1.1.1. High Concentration
- 10.1.1.1.2. Medium Concentration
- 10.1.1.1.3. Low Concentration
- 10.1.1.1. Concentration type
- 10.1.2. Tuna Type
- 10.1.2.1. Crude Tuna Oil
- 10.1.2.2. Refined Tuna Oil
- 10.1.1. Algae Type
- 10.2. Market Analysis, Insights and Forecast - by Application
- 10.2.1. Food and Beverage
- 10.2.1.1. Infant Formula
- 10.2.1.2. Fortified Food and Beverages
- 10.2.2. Dietary Supplements
- 10.2.3. Pharmaceutical
- 10.2.4. Animal Nutrition
- 10.2.5. Clinical Nutrition
- 10.2.1. Food and Beverage
- 10.1. Market Analysis, Insights and Forecast - by Type
- 11. North America Tuna and Algae Omega-3 Ingredient Industry Analysis, Insights and Forecast, 2019-2031
- 11.1. Market Analysis, Insights and Forecast - By Country/Sub-region
- 11.1.1 United States
- 11.1.2 Canada
- 11.1.3 Mexico
- 11.1.4 Rest of North America
- 12. Europe Tuna and Algae Omega-3 Ingredient Industry Analysis, Insights and Forecast, 2019-2031
- 12.1. Market Analysis, Insights and Forecast - By Country/Sub-region
- 12.1.1 Spain
- 12.1.2 United Kingdom
- 12.1.3 Germany
- 12.1.4 France
- 12.1.5 Italy
- 12.1.6 Russia
- 12.1.7 Rest of Europe
- 13. Asia Pacific Tuna and Algae Omega-3 Ingredient Industry Analysis, Insights and Forecast, 2019-2031
- 13.1. Market Analysis, Insights and Forecast - By Country/Sub-region
- 13.1.1 China
- 13.1.2 Japan
- 13.1.3 India
- 13.1.4 Australia
- 13.1.5 Rest of Asia Pacific
- 14. South America Tuna and Algae Omega-3 Ingredient Industry Analysis, Insights and Forecast, 2019-2031
- 14.1. Market Analysis, Insights and Forecast - By Country/Sub-region
- 14.1.1 Brazil
- 14.1.2 Argentina
- 14.1.3 Rest of South America
- 15. Middle East and Africa Tuna and Algae Omega-3 Ingredient Industry Analysis, Insights and Forecast, 2019-2031
- 15.1. Market Analysis, Insights and Forecast - By Country/Sub-region
- 15.1.1 South Africa
- 15.1.2 United Arab Emirates
- 15.1.3 Rest of Middle East and Africa
- 16. Competitive Analysis
- 16.1. Global Market Share Analysis 2024
- 16.2. Company Profiles
- 16.2.1 AlgaeCytes*List Not Exhaustive
- 16.2.1.1. Overview
- 16.2.1.2. Products
- 16.2.1.3. SWOT Analysis
- 16.2.1.4. Recent Developments
- 16.2.1.5. Financials (Based on Availability)
- 16.2.2 Archer Daniels Midland Company
- 16.2.2.1. Overview
- 16.2.2.2. Products
- 16.2.2.3. SWOT Analysis
- 16.2.2.4. Recent Developments
- 16.2.2.5. Financials (Based on Availability)
- 16.2.3 BASF SE
- 16.2.3.1. Overview
- 16.2.3.2. Products
- 16.2.3.3. SWOT Analysis
- 16.2.3.4. Recent Developments
- 16.2.3.5. Financials (Based on Availability)
- 16.2.4 Polaris SA
- 16.2.4.1. Overview
- 16.2.4.2. Products
- 16.2.4.3. SWOT Analysis
- 16.2.4.4. Recent Developments
- 16.2.4.5. Financials (Based on Availability)
- 16.2.5 Neptune Wellness Solutions Inc
- 16.2.5.1. Overview
- 16.2.5.2. Products
- 16.2.5.3. SWOT Analysis
- 16.2.5.4. Recent Developments
- 16.2.5.5. Financials (Based on Availability)
- 16.2.6 Koninklijke DSM NV
- 16.2.6.1. Overview
- 16.2.6.2. Products
- 16.2.6.3. SWOT Analysis
- 16.2.6.4. Recent Developments
- 16.2.6.5. Financials (Based on Availability)
- 16.2.7 Bioprocess Algae LLC
- 16.2.7.1. Overview
- 16.2.7.2. Products
- 16.2.7.3. SWOT Analysis
- 16.2.7.4. Recent Developments
- 16.2.7.5. Financials (Based on Availability)
- 16.2.8 Lonza
- 16.2.8.1. Overview
- 16.2.8.2. Products
- 16.2.8.3. SWOT Analysis
- 16.2.8.4. Recent Developments
- 16.2.8.5. Financials (Based on Availability)
- 16.2.9 Corbion NV
- 16.2.9.1. Overview
- 16.2.9.2. Products
- 16.2.9.3. SWOT Analysis
- 16.2.9.4. Recent Developments
- 16.2.9.5. Financials (Based on Availability)
- 16.2.10 Source-Omega LLC
- 16.2.10.1. Overview
- 16.2.10.2. Products
- 16.2.10.3. SWOT Analysis
- 16.2.10.4. Recent Developments
- 16.2.10.5. Financials (Based on Availability)
- 16.2.1 AlgaeCytes*List Not Exhaustive
List of Figures
- Figure 1: Global Tuna and Algae Omega-3 Ingredient Industry Revenue Breakdown (Million, %) by Region 2024 & 2032
- Figure 2: Global Tuna and Algae Omega-3 Ingredient Industry Volume Breakdown (K Tons, %) by Region 2024 & 2032
- Figure 3: North America Tuna and Algae Omega-3 Ingredient Industry Revenue (Million), by Country 2024 & 2032
- Figure 4: North America Tuna and Algae Omega-3 Ingredient Industry Volume (K Tons), by Country 2024 & 2032
- Figure 5: North America Tuna and Algae Omega-3 Ingredient Industry Revenue Share (%), by Country 2024 & 2032
- Figure 6: North America Tuna and Algae Omega-3 Ingredient Industry Volume Share (%), by Country 2024 & 2032
- Figure 7: Europe Tuna and Algae Omega-3 Ingredient Industry Revenue (Million), by Country 2024 & 2032
- Figure 8: Europe Tuna and Algae Omega-3 Ingredient Industry Volume (K Tons), by Country 2024 & 2032
- Figure 9: Europe Tuna and Algae Omega-3 Ingredient Industry Revenue Share (%), by Country 2024 & 2032
- Figure 10: Europe Tuna and Algae Omega-3 Ingredient Industry Volume Share (%), by Country 2024 & 2032
- Figure 11: Asia Pacific Tuna and Algae Omega-3 Ingredient Industry Revenue (Million), by Country 2024 & 2032
- Figure 12: Asia Pacific Tuna and Algae Omega-3 Ingredient Industry Volume (K Tons), by Country 2024 & 2032
- Figure 13: Asia Pacific Tuna and Algae Omega-3 Ingredient Industry Revenue Share (%), by Country 2024 & 2032
- Figure 14: Asia Pacific Tuna and Algae Omega-3 Ingredient Industry Volume Share (%), by Country 2024 & 2032
- Figure 15: South America Tuna and Algae Omega-3 Ingredient Industry Revenue (Million), by Country 2024 & 2032
- Figure 16: South America Tuna and Algae Omega-3 Ingredient Industry Volume (K Tons), by Country 2024 & 2032
- Figure 17: South America Tuna and Algae Omega-3 Ingredient Industry Revenue Share (%), by Country 2024 & 2032
- Figure 18: South America Tuna and Algae Omega-3 Ingredient Industry Volume Share (%), by Country 2024 & 2032
- Figure 19: Middle East and Africa Tuna and Algae Omega-3 Ingredient Industry Revenue (Million), by Country 2024 & 2032
- Figure 20: Middle East and Africa Tuna and Algae Omega-3 Ingredient Industry Volume (K Tons), by Country 2024 & 2032
- Figure 21: Middle East and Africa Tuna and Algae Omega-3 Ingredient Industry Revenue Share (%), by Country 2024 & 2032
- Figure 22: Middle East and Africa Tuna and Algae Omega-3 Ingredient Industry Volume Share (%), by Country 2024 & 2032
- Figure 23: North America Tuna and Algae Omega-3 Ingredient Industry Revenue (Million), by Type 2024 & 2032
- Figure 24: North America Tuna and Algae Omega-3 Ingredient Industry Volume (K Tons), by Type 2024 & 2032
- Figure 25: North America Tuna and Algae Omega-3 Ingredient Industry Revenue Share (%), by Type 2024 & 2032
- Figure 26: North America Tuna and Algae Omega-3 Ingredient Industry Volume Share (%), by Type 2024 & 2032
- Figure 27: North America Tuna and Algae Omega-3 Ingredient Industry Revenue (Million), by Application 2024 & 2032
- Figure 28: North America Tuna and Algae Omega-3 Ingredient Industry Volume (K Tons), by Application 2024 & 2032
- Figure 29: North America Tuna and Algae Omega-3 Ingredient Industry Revenue Share (%), by Application 2024 & 2032
- Figure 30: North America Tuna and Algae Omega-3 Ingredient Industry Volume Share (%), by Application 2024 & 2032
- Figure 31: North America Tuna and Algae Omega-3 Ingredient Industry Revenue (Million), by Country 2024 & 2032
- Figure 32: North America Tuna and Algae Omega-3 Ingredient Industry Volume (K Tons), by Country 2024 & 2032
- Figure 33: North America Tuna and Algae Omega-3 Ingredient Industry Revenue Share (%), by Country 2024 & 2032
- Figure 34: North America Tuna and Algae Omega-3 Ingredient Industry Volume Share (%), by Country 2024 & 2032
- Figure 35: Europe Tuna and Algae Omega-3 Ingredient Industry Revenue (Million), by Type 2024 & 2032
- Figure 36: Europe Tuna and Algae Omega-3 Ingredient Industry Volume (K Tons), by Type 2024 & 2032
- Figure 37: Europe Tuna and Algae Omega-3 Ingredient Industry Revenue Share (%), by Type 2024 & 2032
- Figure 38: Europe Tuna and Algae Omega-3 Ingredient Industry Volume Share (%), by Type 2024 & 2032
- Figure 39: Europe Tuna and Algae Omega-3 Ingredient Industry Revenue (Million), by Application 2024 & 2032
- Figure 40: Europe Tuna and Algae Omega-3 Ingredient Industry Volume (K Tons), by Application 2024 & 2032
- Figure 41: Europe Tuna and Algae Omega-3 Ingredient Industry Revenue Share (%), by Application 2024 & 2032
- Figure 42: Europe Tuna and Algae Omega-3 Ingredient Industry Volume Share (%), by Application 2024 & 2032
- Figure 43: Europe Tuna and Algae Omega-3 Ingredient Industry Revenue (Million), by Country 2024 & 2032
- Figure 44: Europe Tuna and Algae Omega-3 Ingredient Industry Volume (K Tons), by Country 2024 & 2032
- Figure 45: Europe Tuna and Algae Omega-3 Ingredient Industry Revenue Share (%), by Country 2024 & 2032
- Figure 46: Europe Tuna and Algae Omega-3 Ingredient Industry Volume Share (%), by Country 2024 & 2032
- Figure 47: Asia Pacific Tuna and Algae Omega-3 Ingredient Industry Revenue (Million), by Type 2024 & 2032
- Figure 48: Asia Pacific Tuna and Algae Omega-3 Ingredient Industry Volume (K Tons), by Type 2024 & 2032
- Figure 49: Asia Pacific Tuna and Algae Omega-3 Ingredient Industry Revenue Share (%), by Type 2024 & 2032
- Figure 50: Asia Pacific Tuna and Algae Omega-3 Ingredient Industry Volume Share (%), by Type 2024 & 2032
- Figure 51: Asia Pacific Tuna and Algae Omega-3 Ingredient Industry Revenue (Million), by Application 2024 & 2032
- Figure 52: Asia Pacific Tuna and Algae Omega-3 Ingredient Industry Volume (K Tons), by Application 2024 & 2032
- Figure 53: Asia Pacific Tuna and Algae Omega-3 Ingredient Industry Revenue Share (%), by Application 2024 & 2032
- Figure 54: Asia Pacific Tuna and Algae Omega-3 Ingredient Industry Volume Share (%), by Application 2024 & 2032
- Figure 55: Asia Pacific Tuna and Algae Omega-3 Ingredient Industry Revenue (Million), by Country 2024 & 2032
- Figure 56: Asia Pacific Tuna and Algae Omega-3 Ingredient Industry Volume (K Tons), by Country 2024 & 2032
- Figure 57: Asia Pacific Tuna and Algae Omega-3 Ingredient Industry Revenue Share (%), by Country 2024 & 2032
- Figure 58: Asia Pacific Tuna and Algae Omega-3 Ingredient Industry Volume Share (%), by Country 2024 & 2032
- Figure 59: South America Tuna and Algae Omega-3 Ingredient Industry Revenue (Million), by Type 2024 & 2032
- Figure 60: South America Tuna and Algae Omega-3 Ingredient Industry Volume (K Tons), by Type 2024 & 2032
- Figure 61: South America Tuna and Algae Omega-3 Ingredient Industry Revenue Share (%), by Type 2024 & 2032
- Figure 62: South America Tuna and Algae Omega-3 Ingredient Industry Volume Share (%), by Type 2024 & 2032
- Figure 63: South America Tuna and Algae Omega-3 Ingredient Industry Revenue (Million), by Application 2024 & 2032
- Figure 64: South America Tuna and Algae Omega-3 Ingredient Industry Volume (K Tons), by Application 2024 & 2032
- Figure 65: South America Tuna and Algae Omega-3 Ingredient Industry Revenue Share (%), by Application 2024 & 2032
- Figure 66: South America Tuna and Algae Omega-3 Ingredient Industry Volume Share (%), by Application 2024 & 2032
- Figure 67: South America Tuna and Algae Omega-3 Ingredient Industry Revenue (Million), by Country 2024 & 2032
- Figure 68: South America Tuna and Algae Omega-3 Ingredient Industry Volume (K Tons), by Country 2024 & 2032
- Figure 69: South America Tuna and Algae Omega-3 Ingredient Industry Revenue Share (%), by Country 2024 & 2032
- Figure 70: South America Tuna and Algae Omega-3 Ingredient Industry Volume Share (%), by Country 2024 & 2032
- Figure 71: Middle East and Africa Tuna and Algae Omega-3 Ingredient Industry Revenue (Million), by Type 2024 & 2032
- Figure 72: Middle East and Africa Tuna and Algae Omega-3 Ingredient Industry Volume (K Tons), by Type 2024 & 2032
- Figure 73: Middle East and Africa Tuna and Algae Omega-3 Ingredient Industry Revenue Share (%), by Type 2024 & 2032
- Figure 74: Middle East and Africa Tuna and Algae Omega-3 Ingredient Industry Volume Share (%), by Type 2024 & 2032
- Figure 75: Middle East and Africa Tuna and Algae Omega-3 Ingredient Industry Revenue (Million), by Application 2024 & 2032
- Figure 76: Middle East and Africa Tuna and Algae Omega-3 Ingredient Industry Volume (K Tons), by Application 2024 & 2032
- Figure 77: Middle East and Africa Tuna and Algae Omega-3 Ingredient Industry Revenue Share (%), by Application 2024 & 2032
- Figure 78: Middle East and Africa Tuna and Algae Omega-3 Ingredient Industry Volume Share (%), by Application 2024 & 2032
- Figure 79: Middle East and Africa Tuna and Algae Omega-3 Ingredient Industry Revenue (Million), by Country 2024 & 2032
- Figure 80: Middle East and Africa Tuna and Algae Omega-3 Ingredient Industry Volume (K Tons), by Country 2024 & 2032
- Figure 81: Middle East and Africa Tuna and Algae Omega-3 Ingredient Industry Revenue Share (%), by Country 2024 & 2032
- Figure 82: Middle East and Africa Tuna and Algae Omega-3 Ingredient Industry Volume Share (%), by Country 2024 & 2032
List of Tables
- Table 1: Global Tuna and Algae Omega-3 Ingredient Industry Revenue Million Forecast, by Region 2019 & 2032
- Table 2: Global Tuna and Algae Omega-3 Ingredient Industry Volume K Tons Forecast, by Region 2019 & 2032
- Table 3: Global Tuna and Algae Omega-3 Ingredient Industry Revenue Million Forecast, by Type 2019 & 2032
- Table 4: Global Tuna and Algae Omega-3 Ingredient Industry Volume K Tons Forecast, by Type 2019 & 2032
- Table 5: Global Tuna and Algae Omega-3 Ingredient Industry Revenue Million Forecast, by Application 2019 & 2032
- Table 6: Global Tuna and Algae Omega-3 Ingredient Industry Volume K Tons Forecast, by Application 2019 & 2032
- Table 7: Global Tuna and Algae Omega-3 Ingredient Industry Revenue Million Forecast, by Region 2019 & 2032
- Table 8: Global Tuna and Algae Omega-3 Ingredient Industry Volume K Tons Forecast, by Region 2019 & 2032
- Table 9: Global Tuna and Algae Omega-3 Ingredient Industry Revenue Million Forecast, by Country 2019 & 2032
- Table 10: Global Tuna and Algae Omega-3 Ingredient Industry Volume K Tons Forecast, by Country 2019 & 2032
- Table 11: United States Tuna and Algae Omega-3 Ingredient Industry Revenue (Million) Forecast, by Application 2019 & 2032
- Table 12: United States Tuna and Algae Omega-3 Ingredient Industry Volume (K Tons) Forecast, by Application 2019 & 2032
- Table 13: Canada Tuna and Algae Omega-3 Ingredient Industry Revenue (Million) Forecast, by Application 2019 & 2032
- Table 14: Canada Tuna and Algae Omega-3 Ingredient Industry Volume (K Tons) Forecast, by Application 2019 & 2032
- Table 15: Mexico Tuna and Algae Omega-3 Ingredient Industry Revenue (Million) Forecast, by Application 2019 & 2032
- Table 16: Mexico Tuna and Algae Omega-3 Ingredient Industry Volume (K Tons) Forecast, by Application 2019 & 2032
- Table 17: Rest of North America Tuna and Algae Omega-3 Ingredient Industry Revenue (Million) Forecast, by Application 2019 & 2032
- Table 18: Rest of North America Tuna and Algae Omega-3 Ingredient Industry Volume (K Tons) Forecast, by Application 2019 & 2032
- Table 19: Global Tuna and Algae Omega-3 Ingredient Industry Revenue Million Forecast, by Country 2019 & 2032
- Table 20: Global Tuna and Algae Omega-3 Ingredient Industry Volume K Tons Forecast, by Country 2019 & 2032
- Table 21: Spain Tuna and Algae Omega-3 Ingredient Industry Revenue (Million) Forecast, by Application 2019 & 2032
- Table 22: Spain Tuna and Algae Omega-3 Ingredient Industry Volume (K Tons) Forecast, by Application 2019 & 2032
- Table 23: United Kingdom Tuna and Algae Omega-3 Ingredient Industry Revenue (Million) Forecast, by Application 2019 & 2032
- Table 24: United Kingdom Tuna and Algae Omega-3 Ingredient Industry Volume (K Tons) Forecast, by Application 2019 & 2032
- Table 25: Germany Tuna and Algae Omega-3 Ingredient Industry Revenue (Million) Forecast, by Application 2019 & 2032
- Table 26: Germany Tuna and Algae Omega-3 Ingredient Industry Volume (K Tons) Forecast, by Application 2019 & 2032
- Table 27: France Tuna and Algae Omega-3 Ingredient Industry Revenue (Million) Forecast, by Application 2019 & 2032
- Table 28: France Tuna and Algae Omega-3 Ingredient Industry Volume (K Tons) Forecast, by Application 2019 & 2032
- Table 29: Italy Tuna and Algae Omega-3 Ingredient Industry Revenue (Million) Forecast, by Application 2019 & 2032
- Table 30: Italy Tuna and Algae Omega-3 Ingredient Industry Volume (K Tons) Forecast, by Application 2019 & 2032
- Table 31: Russia Tuna and Algae Omega-3 Ingredient Industry Revenue (Million) Forecast, by Application 2019 & 2032
- Table 32: Russia Tuna and Algae Omega-3 Ingredient Industry Volume (K Tons) Forecast, by Application 2019 & 2032
- Table 33: Rest of Europe Tuna and Algae Omega-3 Ingredient Industry Revenue (Million) Forecast, by Application 2019 & 2032
- Table 34: Rest of Europe Tuna and Algae Omega-3 Ingredient Industry Volume (K Tons) Forecast, by Application 2019 & 2032
- Table 35: Global Tuna and Algae Omega-3 Ingredient Industry Revenue Million Forecast, by Country 2019 & 2032
- Table 36: Global Tuna and Algae Omega-3 Ingredient Industry Volume K Tons Forecast, by Country 2019 & 2032
- Table 37: China Tuna and Algae Omega-3 Ingredient Industry Revenue (Million) Forecast, by Application 2019 & 2032
- Table 38: China Tuna and Algae Omega-3 Ingredient Industry Volume (K Tons) Forecast, by Application 2019 & 2032
- Table 39: Japan Tuna and Algae Omega-3 Ingredient Industry Revenue (Million) Forecast, by Application 2019 & 2032
- Table 40: Japan Tuna and Algae Omega-3 Ingredient Industry Volume (K Tons) Forecast, by Application 2019 & 2032
- Table 41: India Tuna and Algae Omega-3 Ingredient Industry Revenue (Million) Forecast, by Application 2019 & 2032
- Table 42: India Tuna and Algae Omega-3 Ingredient Industry Volume (K Tons) Forecast, by Application 2019 & 2032
- Table 43: Australia Tuna and Algae Omega-3 Ingredient Industry Revenue (Million) Forecast, by Application 2019 & 2032
- Table 44: Australia Tuna and Algae Omega-3 Ingredient Industry Volume (K Tons) Forecast, by Application 2019 & 2032
- Table 45: Rest of Asia Pacific Tuna and Algae Omega-3 Ingredient Industry Revenue (Million) Forecast, by Application 2019 & 2032
- Table 46: Rest of Asia Pacific Tuna and Algae Omega-3 Ingredient Industry Volume (K Tons) Forecast, by Application 2019 & 2032
- Table 47: Global Tuna and Algae Omega-3 Ingredient Industry Revenue Million Forecast, by Country 2019 & 2032
- Table 48: Global Tuna and Algae Omega-3 Ingredient Industry Volume K Tons Forecast, by Country 2019 & 2032
- Table 49: Brazil Tuna and Algae Omega-3 Ingredient Industry Revenue (Million) Forecast, by Application 2019 & 2032
- Table 50: Brazil Tuna and Algae Omega-3 Ingredient Industry Volume (K Tons) Forecast, by Application 2019 & 2032
- Table 51: Argentina Tuna and Algae Omega-3 Ingredient Industry Revenue (Million) Forecast, by Application 2019 & 2032
- Table 52: Argentina Tuna and Algae Omega-3 Ingredient Industry Volume (K Tons) Forecast, by Application 2019 & 2032
- Table 53: Rest of South America Tuna and Algae Omega-3 Ingredient Industry Revenue (Million) Forecast, by Application 2019 & 2032
- Table 54: Rest of South America Tuna and Algae Omega-3 Ingredient Industry Volume (K Tons) Forecast, by Application 2019 & 2032
- Table 55: Global Tuna and Algae Omega-3 Ingredient Industry Revenue Million Forecast, by Country 2019 & 2032
- Table 56: Global Tuna and Algae Omega-3 Ingredient Industry Volume K Tons Forecast, by Country 2019 & 2032
- Table 57: South Africa Tuna and Algae Omega-3 Ingredient Industry Revenue (Million) Forecast, by Application 2019 & 2032
- Table 58: South Africa Tuna and Algae Omega-3 Ingredient Industry Volume (K Tons) Forecast, by Application 2019 & 2032
- Table 59: United Arab Emirates Tuna and Algae Omega-3 Ingredient Industry Revenue (Million) Forecast, by Application 2019 & 2032
- Table 60: United Arab Emirates Tuna and Algae Omega-3 Ingredient Industry Volume (K Tons) Forecast, by Application 2019 & 2032
- Table 61: Rest of Middle East and Africa Tuna and Algae Omega-3 Ingredient Industry Revenue (Million) Forecast, by Application 2019 & 2032
- Table 62: Rest of Middle East and Africa Tuna and Algae Omega-3 Ingredient Industry Volume (K Tons) Forecast, by Application 2019 & 2032
- Table 63: Global Tuna and Algae Omega-3 Ingredient Industry Revenue Million Forecast, by Type 2019 & 2032
- Table 64: Global Tuna and Algae Omega-3 Ingredient Industry Volume K Tons Forecast, by Type 2019 & 2032
- Table 65: Global Tuna and Algae Omega-3 Ingredient Industry Revenue Million Forecast, by Application 2019 & 2032
- Table 66: Global Tuna and Algae Omega-3 Ingredient Industry Volume K Tons Forecast, by Application 2019 & 2032
- Table 67: Global Tuna and Algae Omega-3 Ingredient Industry Revenue Million Forecast, by Country 2019 & 2032
- Table 68: Global Tuna and Algae Omega-3 Ingredient Industry Volume K Tons Forecast, by Country 2019 & 2032
- Table 69: United States Tuna and Algae Omega-3 Ingredient Industry Revenue (Million) Forecast, by Application 2019 & 2032
- Table 70: United States Tuna and Algae Omega-3 Ingredient Industry Volume (K Tons) Forecast, by Application 2019 & 2032
- Table 71: Canada Tuna and Algae Omega-3 Ingredient Industry Revenue (Million) Forecast, by Application 2019 & 2032
- Table 72: Canada Tuna and Algae Omega-3 Ingredient Industry Volume (K Tons) Forecast, by Application 2019 & 2032
- Table 73: Mexico Tuna and Algae Omega-3 Ingredient Industry Revenue (Million) Forecast, by Application 2019 & 2032
- Table 74: Mexico Tuna and Algae Omega-3 Ingredient Industry Volume (K Tons) Forecast, by Application 2019 & 2032
- Table 75: Rest of North America Tuna and Algae Omega-3 Ingredient Industry Revenue (Million) Forecast, by Application 2019 & 2032
- Table 76: Rest of North America Tuna and Algae Omega-3 Ingredient Industry Volume (K Tons) Forecast, by Application 2019 & 2032
- Table 77: Global Tuna and Algae Omega-3 Ingredient Industry Revenue Million Forecast, by Type 2019 & 2032
- Table 78: Global Tuna and Algae Omega-3 Ingredient Industry Volume K Tons Forecast, by Type 2019 & 2032
- Table 79: Global Tuna and Algae Omega-3 Ingredient Industry Revenue Million Forecast, by Application 2019 & 2032
- Table 80: Global Tuna and Algae Omega-3 Ingredient Industry Volume K Tons Forecast, by Application 2019 & 2032
- Table 81: Global Tuna and Algae Omega-3 Ingredient Industry Revenue Million Forecast, by Country 2019 & 2032
- Table 82: Global Tuna and Algae Omega-3 Ingredient Industry Volume K Tons Forecast, by Country 2019 & 2032
- Table 83: Spain Tuna and Algae Omega-3 Ingredient Industry Revenue (Million) Forecast, by Application 2019 & 2032
- Table 84: Spain Tuna and Algae Omega-3 Ingredient Industry Volume (K Tons) Forecast, by Application 2019 & 2032
- Table 85: United Kingdom Tuna and Algae Omega-3 Ingredient Industry Revenue (Million) Forecast, by Application 2019 & 2032
- Table 86: United Kingdom Tuna and Algae Omega-3 Ingredient Industry Volume (K Tons) Forecast, by Application 2019 & 2032
- Table 87: Germany Tuna and Algae Omega-3 Ingredient Industry Revenue (Million) Forecast, by Application 2019 & 2032
- Table 88: Germany Tuna and Algae Omega-3 Ingredient Industry Volume (K Tons) Forecast, by Application 2019 & 2032
- Table 89: France Tuna and Algae Omega-3 Ingredient Industry Revenue (Million) Forecast, by Application 2019 & 2032
- Table 90: France Tuna and Algae Omega-3 Ingredient Industry Volume (K Tons) Forecast, by Application 2019 & 2032
- Table 91: Italy Tuna and Algae Omega-3 Ingredient Industry Revenue (Million) Forecast, by Application 2019 & 2032
- Table 92: Italy Tuna and Algae Omega-3 Ingredient Industry Volume (K Tons) Forecast, by Application 2019 & 2032
- Table 93: Russia Tuna and Algae Omega-3 Ingredient Industry Revenue (Million) Forecast, by Application 2019 & 2032
- Table 94: Russia Tuna and Algae Omega-3 Ingredient Industry Volume (K Tons) Forecast, by Application 2019 & 2032
- Table 95: Rest of Europe Tuna and Algae Omega-3 Ingredient Industry Revenue (Million) Forecast, by Application 2019 & 2032
- Table 96: Rest of Europe Tuna and Algae Omega-3 Ingredient Industry Volume (K Tons) Forecast, by Application 2019 & 2032
- Table 97: Global Tuna and Algae Omega-3 Ingredient Industry Revenue Million Forecast, by Type 2019 & 2032
- Table 98: Global Tuna and Algae Omega-3 Ingredient Industry Volume K Tons Forecast, by Type 2019 & 2032
- Table 99: Global Tuna and Algae Omega-3 Ingredient Industry Revenue Million Forecast, by Application 2019 & 2032
- Table 100: Global Tuna and Algae Omega-3 Ingredient Industry Volume K Tons Forecast, by Application 2019 & 2032
- Table 101: Global Tuna and Algae Omega-3 Ingredient Industry Revenue Million Forecast, by Country 2019 & 2032
- Table 102: Global Tuna and Algae Omega-3 Ingredient Industry Volume K Tons Forecast, by Country 2019 & 2032
- Table 103: China Tuna and Algae Omega-3 Ingredient Industry Revenue (Million) Forecast, by Application 2019 & 2032
- Table 104: China Tuna and Algae Omega-3 Ingredient Industry Volume (K Tons) Forecast, by Application 2019 & 2032
- Table 105: Japan Tuna and Algae Omega-3 Ingredient Industry Revenue (Million) Forecast, by Application 2019 & 2032
- Table 106: Japan Tuna and Algae Omega-3 Ingredient Industry Volume (K Tons) Forecast, by Application 2019 & 2032
- Table 107: India Tuna and Algae Omega-3 Ingredient Industry Revenue (Million) Forecast, by Application 2019 & 2032
- Table 108: India Tuna and Algae Omega-3 Ingredient Industry Volume (K Tons) Forecast, by Application 2019 & 2032
- Table 109: Australia Tuna and Algae Omega-3 Ingredient Industry Revenue (Million) Forecast, by Application 2019 & 2032
- Table 110: Australia Tuna and Algae Omega-3 Ingredient Industry Volume (K Tons) Forecast, by Application 2019 & 2032
- Table 111: Rest of Asia Pacific Tuna and Algae Omega-3 Ingredient Industry Revenue (Million) Forecast, by Application 2019 & 2032
- Table 112: Rest of Asia Pacific Tuna and Algae Omega-3 Ingredient Industry Volume (K Tons) Forecast, by Application 2019 & 2032
- Table 113: Global Tuna and Algae Omega-3 Ingredient Industry Revenue Million Forecast, by Type 2019 & 2032
- Table 114: Global Tuna and Algae Omega-3 Ingredient Industry Volume K Tons Forecast, by Type 2019 & 2032
- Table 115: Global Tuna and Algae Omega-3 Ingredient Industry Revenue Million Forecast, by Application 2019 & 2032
- Table 116: Global Tuna and Algae Omega-3 Ingredient Industry Volume K Tons Forecast, by Application 2019 & 2032
- Table 117: Global Tuna and Algae Omega-3 Ingredient Industry Revenue Million Forecast, by Country 2019 & 2032
- Table 118: Global Tuna and Algae Omega-3 Ingredient Industry Volume K Tons Forecast, by Country 2019 & 2032
- Table 119: Brazil Tuna and Algae Omega-3 Ingredient Industry Revenue (Million) Forecast, by Application 2019 & 2032
- Table 120: Brazil Tuna and Algae Omega-3 Ingredient Industry Volume (K Tons) Forecast, by Application 2019 & 2032
- Table 121: Argentina Tuna and Algae Omega-3 Ingredient Industry Revenue (Million) Forecast, by Application 2019 & 2032
- Table 122: Argentina Tuna and Algae Omega-3 Ingredient Industry Volume (K Tons) Forecast, by Application 2019 & 2032
- Table 123: Rest of South America Tuna and Algae Omega-3 Ingredient Industry Revenue (Million) Forecast, by Application 2019 & 2032
- Table 124: Rest of South America Tuna and Algae Omega-3 Ingredient Industry Volume (K Tons) Forecast, by Application 2019 & 2032
- Table 125: Global Tuna and Algae Omega-3 Ingredient Industry Revenue Million Forecast, by Type 2019 & 2032
- Table 126: Global Tuna and Algae Omega-3 Ingredient Industry Volume K Tons Forecast, by Type 2019 & 2032
- Table 127: Global Tuna and Algae Omega-3 Ingredient Industry Revenue Million Forecast, by Application 2019 & 2032
- Table 128: Global Tuna and Algae Omega-3 Ingredient Industry Volume K Tons Forecast, by Application 2019 & 2032
- Table 129: Global Tuna and Algae Omega-3 Ingredient Industry Revenue Million Forecast, by Country 2019 & 2032
- Table 130: Global Tuna and Algae Omega-3 Ingredient Industry Volume K Tons Forecast, by Country 2019 & 2032
- Table 131: South Africa Tuna and Algae Omega-3 Ingredient Industry Revenue (Million) Forecast, by Application 2019 & 2032
- Table 132: South Africa Tuna and Algae Omega-3 Ingredient Industry Volume (K Tons) Forecast, by Application 2019 & 2032
- Table 133: United Arab Emirates Tuna and Algae Omega-3 Ingredient Industry Revenue (Million) Forecast, by Application 2019 & 2032
- Table 134: United Arab Emirates Tuna and Algae Omega-3 Ingredient Industry Volume (K Tons) Forecast, by Application 2019 & 2032
- Table 135: Rest of Middle East and Africa Tuna and Algae Omega-3 Ingredient Industry Revenue (Million) Forecast, by Application 2019 & 2032
- Table 136: Rest of Middle East and Africa Tuna and Algae Omega-3 Ingredient Industry Volume (K Tons) Forecast, by Application 2019 & 2032
Frequently Asked Questions
1. What is the projected Compound Annual Growth Rate (CAGR) of the Tuna and Algae Omega-3 Ingredient Industry?
The projected CAGR is approximately 14.03%.
2. Which companies are prominent players in the Tuna and Algae Omega-3 Ingredient Industry?
Key companies in the market include AlgaeCytes*List Not Exhaustive, Archer Daniels Midland Company, BASF SE, Polaris SA, Neptune Wellness Solutions Inc, Koninklijke DSM NV, Bioprocess Algae LLC, Lonza, Corbion NV, Source-Omega LLC.
3. What are the main segments of the Tuna and Algae Omega-3 Ingredient Industry?
The market segments include Type, Application.
4. Can you provide details about the market size?
The market size is estimated to be USD 2,895.3 Million as of 2022.
5. What are some drivers contributing to market growth?
Increasing Demand For Convenience & Processed Food.
6. What are the notable trends driving market growth?
Increasing Consumer Expenditure on Omega-3 Supplements Products.
7. Are there any restraints impacting market growth?
Increased Consumer Awareness On Side-Effects Of Chemical Additives.
8. Can you provide examples of recent developments in the market?
February 2022: Polaris partnered with Golden Omega USA to distribute its algae oils across North America.
9. What pricing options are available for accessing the report?
Pricing options include single-user, multi-user, and enterprise licenses priced at USD 4750, USD 5250, and USD 8750 respectively.
10. Is the market size provided in terms of value or volume?
The market size is provided in terms of value, measured in Million and volume, measured in K Tons.
11. Are there any specific market keywords associated with the report?
Yes, the market keyword associated with the report is "Tuna and Algae Omega-3 Ingredient Industry," which aids in identifying and referencing the specific market segment covered.
12. How do I determine which pricing option suits my needs best?
The pricing options vary based on user requirements and access needs. Individual users may opt for single-user licenses, while businesses requiring broader access may choose multi-user or enterprise licenses for cost-effective access to the report.
13. Are there any additional resources or data provided in the Tuna and Algae Omega-3 Ingredient Industry report?
While the report offers comprehensive insights, it's advisable to review the specific contents or supplementary materials provided to ascertain if additional resources or data are available.
14. How can I stay updated on further developments or reports in the Tuna and Algae Omega-3 Ingredient Industry?
To stay informed about further developments, trends, and reports in the Tuna and Algae Omega-3 Ingredient Industry, consider subscribing to industry newsletters, following relevant companies and organizations, or regularly checking reputable industry news sources and publications.
Methodology
Step 1 - Identification of Relevant Samples Size from Population Database


Step 2 - Approaches for Defining Global Market Size (Value, Volume* & Price*)

Note*: In applicable scenarios
Step 3 - Data Sources
Primary Research
- Web Analytics
- Survey Reports
- Research Institute
- Latest Research Reports
- Opinion Leaders
Secondary Research
- Annual Reports
- White Paper
- Latest Press Release
- Industry Association
- Paid Database
- Investor Presentations

Step 4 - Data Triangulation
Involves using different sources of information in order to increase the validity of a study
These sources are likely to be stakeholders in a program - participants, other researchers, program staff, other community members, and so on.
Then we put all data in single framework & apply various statistical tools to find out the dynamic on the market.
During the analysis stage, feedback from the stakeholder groups would be compared to determine areas of agreement as well as areas of divergence
