

Key Insights
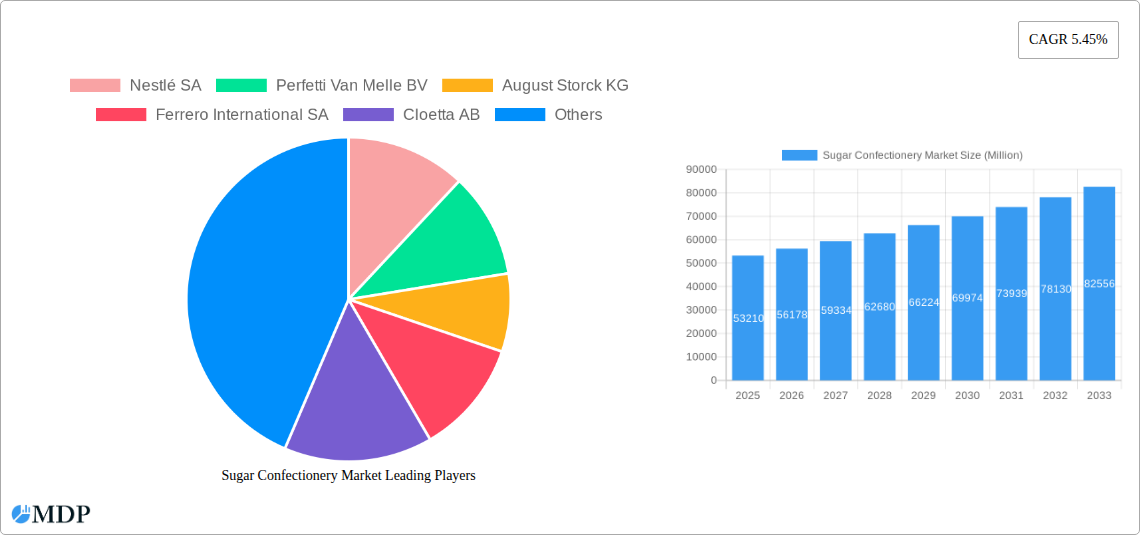
The global sugar confectionery market, valued at $53.21 billion in 2025, is projected to experience robust growth, driven by several key factors. Rising disposable incomes, particularly in emerging economies, are fueling increased consumer spending on discretionary items like confectionery. Changing lifestyles and increased urbanization contribute to higher demand for convenient, on-the-go snacks, benefiting the convenience store distribution channel. Furthermore, the market is witnessing innovation in product offerings, with a focus on healthier alternatives, including reduced sugar options and novel flavors, catering to evolving consumer preferences. The confectionery variant segment is diversified, with hard candies, lollipops, and gummies maintaining strong positions, while pastilles and other specialty items show promising growth potential. While health concerns regarding sugar consumption pose a restraint, manufacturers are proactively addressing this by introducing sugar-reduced and natural sweetener options, mitigating this challenge. Major players like Nestlé, Perfetti Van Melle, and Mars Incorporated are leveraging their brand recognition and extensive distribution networks to maintain market leadership, while smaller players focus on niche product offerings and regional expansion.
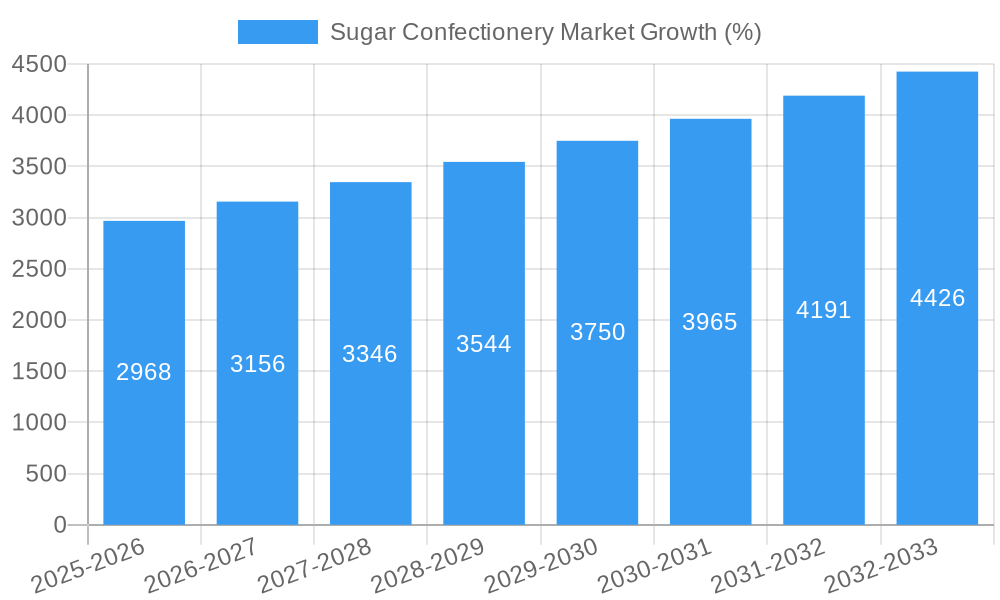
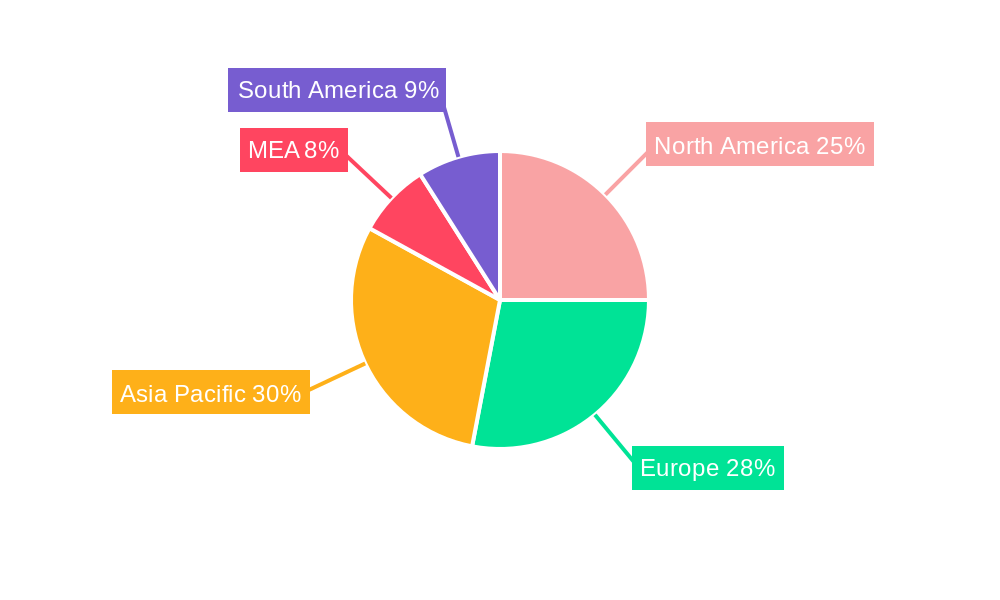
The regional landscape displays varied growth trajectories. North America and Europe, established markets, are likely to see moderate growth driven by product innovation and premiumization. However, significant opportunities lie in the Asia-Pacific region, particularly in rapidly developing economies like China and India, characterized by expanding middle classes and burgeoning confectionery consumption. The MEA and South America regions also represent potential growth areas, although infrastructure limitations and economic fluctuations might influence their growth rates. The forecast period (2025-2033) anticipates continued market expansion, with the CAGR of 5.45% suggesting a steady yet substantial increase in market value over the next decade. Competitive dynamics will continue to shape the market, with strategic partnerships, mergers and acquisitions, and product diversification driving growth and market share evolution.
Sugar Confectionery Market: A Comprehensive Report (2019-2033)
This comprehensive report provides an in-depth analysis of the global sugar confectionery market, offering invaluable insights for industry stakeholders, investors, and strategic decision-makers. The study period covers 2019-2033, with 2025 as the base year and a forecast period of 2025-2033. Expect detailed breakdowns of market dynamics, leading players, emerging trends, and future growth potential, all supported by robust data and market intelligence. Discover actionable strategies to navigate the evolving landscape of this dynamic industry. The market is projected to reach xx Million by 2033.
Sugar Confectionery Market Market Dynamics & Concentration
The sugar confectionery market is characterized by a concentrated landscape with key players like Nestlé SA, Perfetti Van Melle BV, and Mars Incorporated holding significant market share. Market concentration is influenced by factors such as economies of scale, brand recognition, and extensive distribution networks. However, smaller players and regional brands continue to innovate and carve out niches. Innovation is a major driver, fueled by consumer demand for novel flavors, textures, and healthier options. Regulatory frameworks concerning sugar content and labeling significantly impact product development and marketing strategies. Product substitutes, such as sugar-free alternatives and other snacks, exert competitive pressure. End-user trends, particularly shifting preferences towards healthier choices and convenience, shape product development and market segmentation. Mergers and acquisitions (M&A) play a significant role in consolidating market share and expanding product portfolios. The past five years have witnessed xx M&A deals, with an average deal value of xx Million. For example, the market share of the top 5 players is estimated at xx%, leaving considerable space for smaller niche players and innovative entrants.
Sugar Confectionery Market Industry Trends & Analysis
The sugar confectionery market exhibits a dynamic interplay of growth drivers and challenges. The market experienced a CAGR of xx% during the historical period (2019-2024) and is projected to grow at a CAGR of xx% during the forecast period (2025-2033). Key growth drivers include rising disposable incomes in emerging economies, changing consumer preferences towards indulgence and gifting occasions, and increasing innovation in product offerings. Technological disruptions such as automation in manufacturing and personalized marketing strategies are also reshaping the industry. Consumer preferences are shifting towards healthier options, including reduced sugar and natural ingredients, prompting manufacturers to adapt their product portfolios. The competitive landscape is characterized by intense competition among established players and the emergence of innovative startups. Market penetration of various confectionery variants differs significantly; for example, gummies and jellies exhibit higher growth compared to traditional hard candies in many regions.
Leading Markets & Segments in Sugar Confectionery Market
The supermarket/hypermarket distribution channel currently dominates the sugar confectionery market, accounting for xx% of total sales. However, online retail stores are experiencing rapid growth, driven by e-commerce expansion and consumer convenience. The gummies and jellies segment holds the largest market share among confectionery variants, fueled by their appealing textures and diverse flavors.
- Key Drivers for Supermarket/Hypermarket Dominance: Extensive reach, established supply chains, and bulk purchasing options.
- Key Drivers for Online Retail Store Growth: Convenience, wider product selection, and targeted marketing.
- Key Drivers for Gummies and Jellies Segment: Appealing texture, versatility in flavor profiles, and increasing popularity among younger consumers.
Regional dominance varies, with North America and Europe representing mature markets while Asia-Pacific showcases significant growth potential due to rising disposable incomes and evolving consumer preferences.
Sugar Confectionery Market Product Developments
Recent years have seen a surge in product innovation within the sugar confectionery market. Manufacturers are focusing on healthier options, such as reduced sugar formulations, natural ingredients, and functional confectionery with added vitamins or probiotics. Technological advancements in flavor creation and texture modification are enhancing product appeal and diversifying product offerings. Companies are also leveraging sustainable packaging materials to meet growing consumer demands for environmentally conscious products. This focus on health and sustainability creates a significant competitive advantage in the market.
Key Drivers of Sugar Confectionery Market Growth
Several key factors are driving the growth of the sugar confectionery market. Firstly, rising disposable incomes, particularly in emerging economies, are fueling increased consumer spending on discretionary items like confectionery. Secondly, the increasing popularity of gifting occasions and festivals is boosting demand. Finally, continuous product innovation and the introduction of new flavors and formats are enhancing consumer appeal and driving market expansion.
Challenges in the Sugar Confectionery Market Market
The sugar confectionery market faces several challenges, including stringent regulations regarding sugar content and labeling, which increase production costs and limit product innovation. Fluctuations in raw material prices and supply chain disruptions can impact profitability. Intense competition among established players and the emergence of new entrants further pressure margins. These factors collectively limit growth and market expansion. For example, increased sugar taxes in certain regions have reduced overall consumption by approximately xx%.
Emerging Opportunities in Sugar Confectionery Market
The sugar confectionery market presents several emerging opportunities. Technological breakthroughs in manufacturing and packaging are creating possibilities for greater efficiency and customization. Strategic partnerships between confectionery makers and health and wellness brands can open new market segments. Expansion into emerging markets with growing middle classes offers significant potential for increased market penetration and revenue generation.
Leading Players in the Sugar Confectionery Market Sector
- Nestlé SA (Nestlé SA)
- Perfetti Van Melle BV
- August Storck KG
- Ferrero International SA (Ferrero International SA)
- Cloetta AB
- Oy Karl Fazer Ab
- Mars Incorporated (Mars Incorporated)
- Arcor S A I C
- Mount Franklin Foods LLC
- HARIBO Holding GmbH & Co KG (HARIBO Holding GmbH & Co KG)
- The Hershey Company (The Hershey Company)
- Mondelēz International Inc. (Mondelēz International Inc.)
- Meiji Holdings Company Ltd
Key Milestones in Sugar Confectionery Market Industry
- July 2023: HARIBO® opened its first North American manufacturing facility, expanding its production capacity to meet growing US demand.
- June 2023: Tic Tac launched a new spearmint flavor variant in India, tapping into a growing demand for diverse flavor profiles.
- May 2023: Mondelēz International Inc. opened a new Global R&D Innovation Center, signifying a commitment to product innovation and future growth. These developments underscore the industry's focus on expansion, diversification, and innovation to meet evolving consumer preferences.
Strategic Outlook for Sugar Confectionery Market Market
The sugar confectionery market is poised for continued growth, driven by factors such as rising disposable incomes, increasing product diversification, and the emergence of innovative confectionery formats. Companies focusing on healthy options, sustainable practices, and strategic partnerships will be well-positioned to capitalize on this growth. The market's future hinges on adapting to consumer preferences for healthier choices while maintaining the appeal and indulgence associated with sugar confectionery.
Sugar Confectionery Market Segmentation
-
1. Confectionery Variant
- 1.1. Hard Candy
- 1.2. Lollipops
- 1.3. Mints
- 1.4. Pastilles, Gummies, and Jellies
- 1.5. Toffees and Nougats
- 1.6. Others
-
2. Distribution Channel
- 2.1. Convenience Store
- 2.2. Online Retail Store
- 2.3. Supermarket/Hypermarket
- 2.4. Others
Sugar Confectionery Market Segmentation By Geography
-
1. North America
- 1.1. United States
- 1.2. Canada
- 1.3. Mexico
-
2. South America
- 2.1. Brazil
- 2.2. Argentina
- 2.3. Rest of South America
-
3. Europe
- 3.1. United Kingdom
- 3.2. Germany
- 3.3. France
- 3.4. Italy
- 3.5. Spain
- 3.6. Russia
- 3.7. Benelux
- 3.8. Nordics
- 3.9. Rest of Europe
-
4. Middle East & Africa
- 4.1. Turkey
- 4.2. Israel
- 4.3. GCC
- 4.4. North Africa
- 4.5. South Africa
- 4.6. Rest of Middle East & Africa
-
5. Asia Pacific
- 5.1. China
- 5.2. India
- 5.3. Japan
- 5.4. South Korea
- 5.5. ASEAN
- 5.6. Oceania
- 5.7. Rest of Asia Pacific
Sugar Confectionery Market REPORT HIGHLIGHTS
| Aspects | Details |
|---|---|
| Study Period | 2019-2033 |
| Base Year | 2024 |
| Estimated Year | 2025 |
| Forecast Period | 2025-2033 |
| Historical Period | 2019-2024 |
| Growth Rate | CAGR of 5.45% from 2019-2033 |
| Segmentation |
|
Table of Contents
- 1. Introduction
- 1.1. Research Scope
- 1.2. Market Segmentation
- 1.3. Research Methodology
- 1.4. Definitions and Assumptions
- 2. Executive Summary
- 2.1. Introduction
- 3. Market Dynamics
- 3.1. Introduction
- 3.2. Market Drivers
- 3.2.1. Increasing demand for meat alternatives
- 3.3. Market Restrains
- 3.3.1. Presence of numerous alternatives in the plant proteins
- 3.4. Market Trends
- 3.4.1. OTHER KEY INDUSTRY TRENDS COVERED IN THE REPORT
- 4. Market Factor Analysis
- 4.1. Porters Five Forces
- 4.2. Supply/Value Chain
- 4.3. PESTEL analysis
- 4.4. Market Entropy
- 4.5. Patent/Trademark Analysis
- 5. Global Sugar Confectionery Market Analysis, Insights and Forecast, 2019-2031
- 5.1. Market Analysis, Insights and Forecast - by Confectionery Variant
- 5.1.1. Hard Candy
- 5.1.2. Lollipops
- 5.1.3. Mints
- 5.1.4. Pastilles, Gummies, and Jellies
- 5.1.5. Toffees and Nougats
- 5.1.6. Others
- 5.2. Market Analysis, Insights and Forecast - by Distribution Channel
- 5.2.1. Convenience Store
- 5.2.2. Online Retail Store
- 5.2.3. Supermarket/Hypermarket
- 5.2.4. Others
- 5.3. Market Analysis, Insights and Forecast - by Region
- 5.3.1. North America
- 5.3.2. South America
- 5.3.3. Europe
- 5.3.4. Middle East & Africa
- 5.3.5. Asia Pacific
- 5.1. Market Analysis, Insights and Forecast - by Confectionery Variant
- 6. North America Sugar Confectionery Market Analysis, Insights and Forecast, 2019-2031
- 6.1. Market Analysis, Insights and Forecast - by Confectionery Variant
- 6.1.1. Hard Candy
- 6.1.2. Lollipops
- 6.1.3. Mints
- 6.1.4. Pastilles, Gummies, and Jellies
- 6.1.5. Toffees and Nougats
- 6.1.6. Others
- 6.2. Market Analysis, Insights and Forecast - by Distribution Channel
- 6.2.1. Convenience Store
- 6.2.2. Online Retail Store
- 6.2.3. Supermarket/Hypermarket
- 6.2.4. Others
- 6.1. Market Analysis, Insights and Forecast - by Confectionery Variant
- 7. South America Sugar Confectionery Market Analysis, Insights and Forecast, 2019-2031
- 7.1. Market Analysis, Insights and Forecast - by Confectionery Variant
- 7.1.1. Hard Candy
- 7.1.2. Lollipops
- 7.1.3. Mints
- 7.1.4. Pastilles, Gummies, and Jellies
- 7.1.5. Toffees and Nougats
- 7.1.6. Others
- 7.2. Market Analysis, Insights and Forecast - by Distribution Channel
- 7.2.1. Convenience Store
- 7.2.2. Online Retail Store
- 7.2.3. Supermarket/Hypermarket
- 7.2.4. Others
- 7.1. Market Analysis, Insights and Forecast - by Confectionery Variant
- 8. Europe Sugar Confectionery Market Analysis, Insights and Forecast, 2019-2031
- 8.1. Market Analysis, Insights and Forecast - by Confectionery Variant
- 8.1.1. Hard Candy
- 8.1.2. Lollipops
- 8.1.3. Mints
- 8.1.4. Pastilles, Gummies, and Jellies
- 8.1.5. Toffees and Nougats
- 8.1.6. Others
- 8.2. Market Analysis, Insights and Forecast - by Distribution Channel
- 8.2.1. Convenience Store
- 8.2.2. Online Retail Store
- 8.2.3. Supermarket/Hypermarket
- 8.2.4. Others
- 8.1. Market Analysis, Insights and Forecast - by Confectionery Variant
- 9. Middle East & Africa Sugar Confectionery Market Analysis, Insights and Forecast, 2019-2031
- 9.1. Market Analysis, Insights and Forecast - by Confectionery Variant
- 9.1.1. Hard Candy
- 9.1.2. Lollipops
- 9.1.3. Mints
- 9.1.4. Pastilles, Gummies, and Jellies
- 9.1.5. Toffees and Nougats
- 9.1.6. Others
- 9.2. Market Analysis, Insights and Forecast - by Distribution Channel
- 9.2.1. Convenience Store
- 9.2.2. Online Retail Store
- 9.2.3. Supermarket/Hypermarket
- 9.2.4. Others
- 9.1. Market Analysis, Insights and Forecast - by Confectionery Variant
- 10. Asia Pacific Sugar Confectionery Market Analysis, Insights and Forecast, 2019-2031
- 10.1. Market Analysis, Insights and Forecast - by Confectionery Variant
- 10.1.1. Hard Candy
- 10.1.2. Lollipops
- 10.1.3. Mints
- 10.1.4. Pastilles, Gummies, and Jellies
- 10.1.5. Toffees and Nougats
- 10.1.6. Others
- 10.2. Market Analysis, Insights and Forecast - by Distribution Channel
- 10.2.1. Convenience Store
- 10.2.2. Online Retail Store
- 10.2.3. Supermarket/Hypermarket
- 10.2.4. Others
- 10.1. Market Analysis, Insights and Forecast - by Confectionery Variant
- 11. MEA Sugar Confectionery Market Analysis, Insights and Forecast, 2019-2031
- 11.1. Market Analysis, Insights and Forecast - By Country/Sub-region
- 11.1.1 Middle East
- 11.1.2 Africa
- 12. South America Sugar Confectionery Market Analysis, Insights and Forecast, 2019-2031
- 12.1. Market Analysis, Insights and Forecast - By Country/Sub-region
- 12.1.1 Brazil
- 12.1.2 Argentina
- 12.1.3 Rest of South America
- 13. Europe Sugar Confectionery Market Analysis, Insights and Forecast, 2019-2031
- 13.1. Market Analysis, Insights and Forecast - By Country/Sub-region
- 13.1.1. Germany
- 14. Asia Pacific Sugar Confectionery Market Analysis, Insights and Forecast, 2019-2031
- 14.1. Market Analysis, Insights and Forecast - By Country/Sub-region
- 14.1.1 China
- 14.1.2 Japan
- 14.1.3 India
- 14.1.4 South Korea
- 14.1.5 Taiwan
- 14.1.6 Australia
- 14.1.7 Rest of Asia-Pacific
- 15. North America Sugar Confectionery Market Analysis, Insights and Forecast, 2019-2031
- 15.1. Market Analysis, Insights and Forecast - By Country/Sub-region
- 15.1.1. United States Canada Mexico
- 16. Competitive Analysis
- 16.1. Global Market Share Analysis 2024
- 16.2. Company Profiles
- 16.2.1 Nestlé SA
- 16.2.1.1. Overview
- 16.2.1.2. Products
- 16.2.1.3. SWOT Analysis
- 16.2.1.4. Recent Developments
- 16.2.1.5. Financials (Based on Availability)
- 16.2.2 Perfetti Van Melle BV
- 16.2.2.1. Overview
- 16.2.2.2. Products
- 16.2.2.3. SWOT Analysis
- 16.2.2.4. Recent Developments
- 16.2.2.5. Financials (Based on Availability)
- 16.2.3 August Storck KG
- 16.2.3.1. Overview
- 16.2.3.2. Products
- 16.2.3.3. SWOT Analysis
- 16.2.3.4. Recent Developments
- 16.2.3.5. Financials (Based on Availability)
- 16.2.4 Ferrero International SA
- 16.2.4.1. Overview
- 16.2.4.2. Products
- 16.2.4.3. SWOT Analysis
- 16.2.4.4. Recent Developments
- 16.2.4.5. Financials (Based on Availability)
- 16.2.5 Cloetta AB
- 16.2.5.1. Overview
- 16.2.5.2. Products
- 16.2.5.3. SWOT Analysis
- 16.2.5.4. Recent Developments
- 16.2.5.5. Financials (Based on Availability)
- 16.2.6 Oy Karl Fazer Ab
- 16.2.6.1. Overview
- 16.2.6.2. Products
- 16.2.6.3. SWOT Analysis
- 16.2.6.4. Recent Developments
- 16.2.6.5. Financials (Based on Availability)
- 16.2.7 Mars Incorporated
- 16.2.7.1. Overview
- 16.2.7.2. Products
- 16.2.7.3. SWOT Analysis
- 16.2.7.4. Recent Developments
- 16.2.7.5. Financials (Based on Availability)
- 16.2.8 Arcor S A I C
- 16.2.8.1. Overview
- 16.2.8.2. Products
- 16.2.8.3. SWOT Analysis
- 16.2.8.4. Recent Developments
- 16.2.8.5. Financials (Based on Availability)
- 16.2.9 Mount Franklin Foods LLC
- 16.2.9.1. Overview
- 16.2.9.2. Products
- 16.2.9.3. SWOT Analysis
- 16.2.9.4. Recent Developments
- 16.2.9.5. Financials (Based on Availability)
- 16.2.10 HARIBO Holding GmbH & Co KG
- 16.2.10.1. Overview
- 16.2.10.2. Products
- 16.2.10.3. SWOT Analysis
- 16.2.10.4. Recent Developments
- 16.2.10.5. Financials (Based on Availability)
- 16.2.11 The Hershey Compan
- 16.2.11.1. Overview
- 16.2.11.2. Products
- 16.2.11.3. SWOT Analysis
- 16.2.11.4. Recent Developments
- 16.2.11.5. Financials (Based on Availability)
- 16.2.12 Mondelēz International Inc
- 16.2.12.1. Overview
- 16.2.12.2. Products
- 16.2.12.3. SWOT Analysis
- 16.2.12.4. Recent Developments
- 16.2.12.5. Financials (Based on Availability)
- 16.2.13 Meiji Holdings Company Ltd
- 16.2.13.1. Overview
- 16.2.13.2. Products
- 16.2.13.3. SWOT Analysis
- 16.2.13.4. Recent Developments
- 16.2.13.5. Financials (Based on Availability)
- 16.2.1 Nestlé SA
List of Figures
- Figure 1: Global Sugar Confectionery Market Revenue Breakdown (Million, %) by Region 2024 & 2032
- Figure 2: Global Sugar Confectionery Market Volume Breakdown (K Tons, %) by Region 2024 & 2032
- Figure 3: MEA Sugar Confectionery Market Revenue (Million), by Country 2024 & 2032
- Figure 4: MEA Sugar Confectionery Market Volume (K Tons), by Country 2024 & 2032
- Figure 5: MEA Sugar Confectionery Market Revenue Share (%), by Country 2024 & 2032
- Figure 6: MEA Sugar Confectionery Market Volume Share (%), by Country 2024 & 2032
- Figure 7: South America Sugar Confectionery Market Revenue (Million), by Country 2024 & 2032
- Figure 8: South America Sugar Confectionery Market Volume (K Tons), by Country 2024 & 2032
- Figure 9: South America Sugar Confectionery Market Revenue Share (%), by Country 2024 & 2032
- Figure 10: South America Sugar Confectionery Market Volume Share (%), by Country 2024 & 2032
- Figure 11: Europe Sugar Confectionery Market Revenue (Million), by Country 2024 & 2032
- Figure 12: Europe Sugar Confectionery Market Volume (K Tons), by Country 2024 & 2032
- Figure 13: Europe Sugar Confectionery Market Revenue Share (%), by Country 2024 & 2032
- Figure 14: Europe Sugar Confectionery Market Volume Share (%), by Country 2024 & 2032
- Figure 15: Asia Pacific Sugar Confectionery Market Revenue (Million), by Country 2024 & 2032
- Figure 16: Asia Pacific Sugar Confectionery Market Volume (K Tons), by Country 2024 & 2032
- Figure 17: Asia Pacific Sugar Confectionery Market Revenue Share (%), by Country 2024 & 2032
- Figure 18: Asia Pacific Sugar Confectionery Market Volume Share (%), by Country 2024 & 2032
- Figure 19: North America Sugar Confectionery Market Revenue (Million), by Country 2024 & 2032
- Figure 20: North America Sugar Confectionery Market Volume (K Tons), by Country 2024 & 2032
- Figure 21: North America Sugar Confectionery Market Revenue Share (%), by Country 2024 & 2032
- Figure 22: North America Sugar Confectionery Market Volume Share (%), by Country 2024 & 2032
- Figure 23: North America Sugar Confectionery Market Revenue (Million), by Confectionery Variant 2024 & 2032
- Figure 24: North America Sugar Confectionery Market Volume (K Tons), by Confectionery Variant 2024 & 2032
- Figure 25: North America Sugar Confectionery Market Revenue Share (%), by Confectionery Variant 2024 & 2032
- Figure 26: North America Sugar Confectionery Market Volume Share (%), by Confectionery Variant 2024 & 2032
- Figure 27: North America Sugar Confectionery Market Revenue (Million), by Distribution Channel 2024 & 2032
- Figure 28: North America Sugar Confectionery Market Volume (K Tons), by Distribution Channel 2024 & 2032
- Figure 29: North America Sugar Confectionery Market Revenue Share (%), by Distribution Channel 2024 & 2032
- Figure 30: North America Sugar Confectionery Market Volume Share (%), by Distribution Channel 2024 & 2032
- Figure 31: North America Sugar Confectionery Market Revenue (Million), by Country 2024 & 2032
- Figure 32: North America Sugar Confectionery Market Volume (K Tons), by Country 2024 & 2032
- Figure 33: North America Sugar Confectionery Market Revenue Share (%), by Country 2024 & 2032
- Figure 34: North America Sugar Confectionery Market Volume Share (%), by Country 2024 & 2032
- Figure 35: South America Sugar Confectionery Market Revenue (Million), by Confectionery Variant 2024 & 2032
- Figure 36: South America Sugar Confectionery Market Volume (K Tons), by Confectionery Variant 2024 & 2032
- Figure 37: South America Sugar Confectionery Market Revenue Share (%), by Confectionery Variant 2024 & 2032
- Figure 38: South America Sugar Confectionery Market Volume Share (%), by Confectionery Variant 2024 & 2032
- Figure 39: South America Sugar Confectionery Market Revenue (Million), by Distribution Channel 2024 & 2032
- Figure 40: South America Sugar Confectionery Market Volume (K Tons), by Distribution Channel 2024 & 2032
- Figure 41: South America Sugar Confectionery Market Revenue Share (%), by Distribution Channel 2024 & 2032
- Figure 42: South America Sugar Confectionery Market Volume Share (%), by Distribution Channel 2024 & 2032
- Figure 43: South America Sugar Confectionery Market Revenue (Million), by Country 2024 & 2032
- Figure 44: South America Sugar Confectionery Market Volume (K Tons), by Country 2024 & 2032
- Figure 45: South America Sugar Confectionery Market Revenue Share (%), by Country 2024 & 2032
- Figure 46: South America Sugar Confectionery Market Volume Share (%), by Country 2024 & 2032
- Figure 47: Europe Sugar Confectionery Market Revenue (Million), by Confectionery Variant 2024 & 2032
- Figure 48: Europe Sugar Confectionery Market Volume (K Tons), by Confectionery Variant 2024 & 2032
- Figure 49: Europe Sugar Confectionery Market Revenue Share (%), by Confectionery Variant 2024 & 2032
- Figure 50: Europe Sugar Confectionery Market Volume Share (%), by Confectionery Variant 2024 & 2032
- Figure 51: Europe Sugar Confectionery Market Revenue (Million), by Distribution Channel 2024 & 2032
- Figure 52: Europe Sugar Confectionery Market Volume (K Tons), by Distribution Channel 2024 & 2032
- Figure 53: Europe Sugar Confectionery Market Revenue Share (%), by Distribution Channel 2024 & 2032
- Figure 54: Europe Sugar Confectionery Market Volume Share (%), by Distribution Channel 2024 & 2032
- Figure 55: Europe Sugar Confectionery Market Revenue (Million), by Country 2024 & 2032
- Figure 56: Europe Sugar Confectionery Market Volume (K Tons), by Country 2024 & 2032
- Figure 57: Europe Sugar Confectionery Market Revenue Share (%), by Country 2024 & 2032
- Figure 58: Europe Sugar Confectionery Market Volume Share (%), by Country 2024 & 2032
- Figure 59: Middle East & Africa Sugar Confectionery Market Revenue (Million), by Confectionery Variant 2024 & 2032
- Figure 60: Middle East & Africa Sugar Confectionery Market Volume (K Tons), by Confectionery Variant 2024 & 2032
- Figure 61: Middle East & Africa Sugar Confectionery Market Revenue Share (%), by Confectionery Variant 2024 & 2032
- Figure 62: Middle East & Africa Sugar Confectionery Market Volume Share (%), by Confectionery Variant 2024 & 2032
- Figure 63: Middle East & Africa Sugar Confectionery Market Revenue (Million), by Distribution Channel 2024 & 2032
- Figure 64: Middle East & Africa Sugar Confectionery Market Volume (K Tons), by Distribution Channel 2024 & 2032
- Figure 65: Middle East & Africa Sugar Confectionery Market Revenue Share (%), by Distribution Channel 2024 & 2032
- Figure 66: Middle East & Africa Sugar Confectionery Market Volume Share (%), by Distribution Channel 2024 & 2032
- Figure 67: Middle East & Africa Sugar Confectionery Market Revenue (Million), by Country 2024 & 2032
- Figure 68: Middle East & Africa Sugar Confectionery Market Volume (K Tons), by Country 2024 & 2032
- Figure 69: Middle East & Africa Sugar Confectionery Market Revenue Share (%), by Country 2024 & 2032
- Figure 70: Middle East & Africa Sugar Confectionery Market Volume Share (%), by Country 2024 & 2032
- Figure 71: Asia Pacific Sugar Confectionery Market Revenue (Million), by Confectionery Variant 2024 & 2032
- Figure 72: Asia Pacific Sugar Confectionery Market Volume (K Tons), by Confectionery Variant 2024 & 2032
- Figure 73: Asia Pacific Sugar Confectionery Market Revenue Share (%), by Confectionery Variant 2024 & 2032
- Figure 74: Asia Pacific Sugar Confectionery Market Volume Share (%), by Confectionery Variant 2024 & 2032
- Figure 75: Asia Pacific Sugar Confectionery Market Revenue (Million), by Distribution Channel 2024 & 2032
- Figure 76: Asia Pacific Sugar Confectionery Market Volume (K Tons), by Distribution Channel 2024 & 2032
- Figure 77: Asia Pacific Sugar Confectionery Market Revenue Share (%), by Distribution Channel 2024 & 2032
- Figure 78: Asia Pacific Sugar Confectionery Market Volume Share (%), by Distribution Channel 2024 & 2032
- Figure 79: Asia Pacific Sugar Confectionery Market Revenue (Million), by Country 2024 & 2032
- Figure 80: Asia Pacific Sugar Confectionery Market Volume (K Tons), by Country 2024 & 2032
- Figure 81: Asia Pacific Sugar Confectionery Market Revenue Share (%), by Country 2024 & 2032
- Figure 82: Asia Pacific Sugar Confectionery Market Volume Share (%), by Country 2024 & 2032
List of Tables
- Table 1: Global Sugar Confectionery Market Revenue Million Forecast, by Region 2019 & 2032
- Table 2: Global Sugar Confectionery Market Volume K Tons Forecast, by Region 2019 & 2032
- Table 3: Global Sugar Confectionery Market Revenue Million Forecast, by Confectionery Variant 2019 & 2032
- Table 4: Global Sugar Confectionery Market Volume K Tons Forecast, by Confectionery Variant 2019 & 2032
- Table 5: Global Sugar Confectionery Market Revenue Million Forecast, by Distribution Channel 2019 & 2032
- Table 6: Global Sugar Confectionery Market Volume K Tons Forecast, by Distribution Channel 2019 & 2032
- Table 7: Global Sugar Confectionery Market Revenue Million Forecast, by Region 2019 & 2032
- Table 8: Global Sugar Confectionery Market Volume K Tons Forecast, by Region 2019 & 2032
- Table 9: Global Sugar Confectionery Market Revenue Million Forecast, by Country 2019 & 2032
- Table 10: Global Sugar Confectionery Market Volume K Tons Forecast, by Country 2019 & 2032
- Table 11: Middle East Sugar Confectionery Market Revenue (Million) Forecast, by Application 2019 & 2032
- Table 12: Middle East Sugar Confectionery Market Volume (K Tons) Forecast, by Application 2019 & 2032
- Table 13: Africa Sugar Confectionery Market Revenue (Million) Forecast, by Application 2019 & 2032
- Table 14: Africa Sugar Confectionery Market Volume (K Tons) Forecast, by Application 2019 & 2032
- Table 15: Global Sugar Confectionery Market Revenue Million Forecast, by Country 2019 & 2032
- Table 16: Global Sugar Confectionery Market Volume K Tons Forecast, by Country 2019 & 2032
- Table 17: Brazil Sugar Confectionery Market Revenue (Million) Forecast, by Application 2019 & 2032
- Table 18: Brazil Sugar Confectionery Market Volume (K Tons) Forecast, by Application 2019 & 2032
- Table 19: Argentina Sugar Confectionery Market Revenue (Million) Forecast, by Application 2019 & 2032
- Table 20: Argentina Sugar Confectionery Market Volume (K Tons) Forecast, by Application 2019 & 2032
- Table 21: Rest of South America Sugar Confectionery Market Revenue (Million) Forecast, by Application 2019 & 2032
- Table 22: Rest of South America Sugar Confectionery Market Volume (K Tons) Forecast, by Application 2019 & 2032
- Table 23: Global Sugar Confectionery Market Revenue Million Forecast, by Country 2019 & 2032
- Table 24: Global Sugar Confectionery Market Volume K Tons Forecast, by Country 2019 & 2032
- Table 25: Germany Sugar Confectionery Market Revenue (Million) Forecast, by Application 2019 & 2032
- Table 26: Germany Sugar Confectionery Market Volume (K Tons) Forecast, by Application 2019 & 2032
- Table 27: Global Sugar Confectionery Market Revenue Million Forecast, by Country 2019 & 2032
- Table 28: Global Sugar Confectionery Market Volume K Tons Forecast, by Country 2019 & 2032
- Table 29: China Sugar Confectionery Market Revenue (Million) Forecast, by Application 2019 & 2032
- Table 30: China Sugar Confectionery Market Volume (K Tons) Forecast, by Application 2019 & 2032
- Table 31: Japan Sugar Confectionery Market Revenue (Million) Forecast, by Application 2019 & 2032
- Table 32: Japan Sugar Confectionery Market Volume (K Tons) Forecast, by Application 2019 & 2032
- Table 33: India Sugar Confectionery Market Revenue (Million) Forecast, by Application 2019 & 2032
- Table 34: India Sugar Confectionery Market Volume (K Tons) Forecast, by Application 2019 & 2032
- Table 35: South Korea Sugar Confectionery Market Revenue (Million) Forecast, by Application 2019 & 2032
- Table 36: South Korea Sugar Confectionery Market Volume (K Tons) Forecast, by Application 2019 & 2032
- Table 37: Taiwan Sugar Confectionery Market Revenue (Million) Forecast, by Application 2019 & 2032
- Table 38: Taiwan Sugar Confectionery Market Volume (K Tons) Forecast, by Application 2019 & 2032
- Table 39: Australia Sugar Confectionery Market Revenue (Million) Forecast, by Application 2019 & 2032
- Table 40: Australia Sugar Confectionery Market Volume (K Tons) Forecast, by Application 2019 & 2032
- Table 41: Rest of Asia-Pacific Sugar Confectionery Market Revenue (Million) Forecast, by Application 2019 & 2032
- Table 42: Rest of Asia-Pacific Sugar Confectionery Market Volume (K Tons) Forecast, by Application 2019 & 2032
- Table 43: Global Sugar Confectionery Market Revenue Million Forecast, by Country 2019 & 2032
- Table 44: Global Sugar Confectionery Market Volume K Tons Forecast, by Country 2019 & 2032
- Table 45: United States Canada Mexico Sugar Confectionery Market Revenue (Million) Forecast, by Application 2019 & 2032
- Table 46: United States Canada Mexico Sugar Confectionery Market Volume (K Tons) Forecast, by Application 2019 & 2032
- Table 47: Global Sugar Confectionery Market Revenue Million Forecast, by Confectionery Variant 2019 & 2032
- Table 48: Global Sugar Confectionery Market Volume K Tons Forecast, by Confectionery Variant 2019 & 2032
- Table 49: Global Sugar Confectionery Market Revenue Million Forecast, by Distribution Channel 2019 & 2032
- Table 50: Global Sugar Confectionery Market Volume K Tons Forecast, by Distribution Channel 2019 & 2032
- Table 51: Global Sugar Confectionery Market Revenue Million Forecast, by Country 2019 & 2032
- Table 52: Global Sugar Confectionery Market Volume K Tons Forecast, by Country 2019 & 2032
- Table 53: United States Sugar Confectionery Market Revenue (Million) Forecast, by Application 2019 & 2032
- Table 54: United States Sugar Confectionery Market Volume (K Tons) Forecast, by Application 2019 & 2032
- Table 55: Canada Sugar Confectionery Market Revenue (Million) Forecast, by Application 2019 & 2032
- Table 56: Canada Sugar Confectionery Market Volume (K Tons) Forecast, by Application 2019 & 2032
- Table 57: Mexico Sugar Confectionery Market Revenue (Million) Forecast, by Application 2019 & 2032
- Table 58: Mexico Sugar Confectionery Market Volume (K Tons) Forecast, by Application 2019 & 2032
- Table 59: Global Sugar Confectionery Market Revenue Million Forecast, by Confectionery Variant 2019 & 2032
- Table 60: Global Sugar Confectionery Market Volume K Tons Forecast, by Confectionery Variant 2019 & 2032
- Table 61: Global Sugar Confectionery Market Revenue Million Forecast, by Distribution Channel 2019 & 2032
- Table 62: Global Sugar Confectionery Market Volume K Tons Forecast, by Distribution Channel 2019 & 2032
- Table 63: Global Sugar Confectionery Market Revenue Million Forecast, by Country 2019 & 2032
- Table 64: Global Sugar Confectionery Market Volume K Tons Forecast, by Country 2019 & 2032
- Table 65: Brazil Sugar Confectionery Market Revenue (Million) Forecast, by Application 2019 & 2032
- Table 66: Brazil Sugar Confectionery Market Volume (K Tons) Forecast, by Application 2019 & 2032
- Table 67: Argentina Sugar Confectionery Market Revenue (Million) Forecast, by Application 2019 & 2032
- Table 68: Argentina Sugar Confectionery Market Volume (K Tons) Forecast, by Application 2019 & 2032
- Table 69: Rest of South America Sugar Confectionery Market Revenue (Million) Forecast, by Application 2019 & 2032
- Table 70: Rest of South America Sugar Confectionery Market Volume (K Tons) Forecast, by Application 2019 & 2032
- Table 71: Global Sugar Confectionery Market Revenue Million Forecast, by Confectionery Variant 2019 & 2032
- Table 72: Global Sugar Confectionery Market Volume K Tons Forecast, by Confectionery Variant 2019 & 2032
- Table 73: Global Sugar Confectionery Market Revenue Million Forecast, by Distribution Channel 2019 & 2032
- Table 74: Global Sugar Confectionery Market Volume K Tons Forecast, by Distribution Channel 2019 & 2032
- Table 75: Global Sugar Confectionery Market Revenue Million Forecast, by Country 2019 & 2032
- Table 76: Global Sugar Confectionery Market Volume K Tons Forecast, by Country 2019 & 2032
- Table 77: United Kingdom Sugar Confectionery Market Revenue (Million) Forecast, by Application 2019 & 2032
- Table 78: United Kingdom Sugar Confectionery Market Volume (K Tons) Forecast, by Application 2019 & 2032
- Table 79: Germany Sugar Confectionery Market Revenue (Million) Forecast, by Application 2019 & 2032
- Table 80: Germany Sugar Confectionery Market Volume (K Tons) Forecast, by Application 2019 & 2032
- Table 81: France Sugar Confectionery Market Revenue (Million) Forecast, by Application 2019 & 2032
- Table 82: France Sugar Confectionery Market Volume (K Tons) Forecast, by Application 2019 & 2032
- Table 83: Italy Sugar Confectionery Market Revenue (Million) Forecast, by Application 2019 & 2032
- Table 84: Italy Sugar Confectionery Market Volume (K Tons) Forecast, by Application 2019 & 2032
- Table 85: Spain Sugar Confectionery Market Revenue (Million) Forecast, by Application 2019 & 2032
- Table 86: Spain Sugar Confectionery Market Volume (K Tons) Forecast, by Application 2019 & 2032
- Table 87: Russia Sugar Confectionery Market Revenue (Million) Forecast, by Application 2019 & 2032
- Table 88: Russia Sugar Confectionery Market Volume (K Tons) Forecast, by Application 2019 & 2032
- Table 89: Benelux Sugar Confectionery Market Revenue (Million) Forecast, by Application 2019 & 2032
- Table 90: Benelux Sugar Confectionery Market Volume (K Tons) Forecast, by Application 2019 & 2032
- Table 91: Nordics Sugar Confectionery Market Revenue (Million) Forecast, by Application 2019 & 2032
- Table 92: Nordics Sugar Confectionery Market Volume (K Tons) Forecast, by Application 2019 & 2032
- Table 93: Rest of Europe Sugar Confectionery Market Revenue (Million) Forecast, by Application 2019 & 2032
- Table 94: Rest of Europe Sugar Confectionery Market Volume (K Tons) Forecast, by Application 2019 & 2032
- Table 95: Global Sugar Confectionery Market Revenue Million Forecast, by Confectionery Variant 2019 & 2032
- Table 96: Global Sugar Confectionery Market Volume K Tons Forecast, by Confectionery Variant 2019 & 2032
- Table 97: Global Sugar Confectionery Market Revenue Million Forecast, by Distribution Channel 2019 & 2032
- Table 98: Global Sugar Confectionery Market Volume K Tons Forecast, by Distribution Channel 2019 & 2032
- Table 99: Global Sugar Confectionery Market Revenue Million Forecast, by Country 2019 & 2032
- Table 100: Global Sugar Confectionery Market Volume K Tons Forecast, by Country 2019 & 2032
- Table 101: Turkey Sugar Confectionery Market Revenue (Million) Forecast, by Application 2019 & 2032
- Table 102: Turkey Sugar Confectionery Market Volume (K Tons) Forecast, by Application 2019 & 2032
- Table 103: Israel Sugar Confectionery Market Revenue (Million) Forecast, by Application 2019 & 2032
- Table 104: Israel Sugar Confectionery Market Volume (K Tons) Forecast, by Application 2019 & 2032
- Table 105: GCC Sugar Confectionery Market Revenue (Million) Forecast, by Application 2019 & 2032
- Table 106: GCC Sugar Confectionery Market Volume (K Tons) Forecast, by Application 2019 & 2032
- Table 107: North Africa Sugar Confectionery Market Revenue (Million) Forecast, by Application 2019 & 2032
- Table 108: North Africa Sugar Confectionery Market Volume (K Tons) Forecast, by Application 2019 & 2032
- Table 109: South Africa Sugar Confectionery Market Revenue (Million) Forecast, by Application 2019 & 2032
- Table 110: South Africa Sugar Confectionery Market Volume (K Tons) Forecast, by Application 2019 & 2032
- Table 111: Rest of Middle East & Africa Sugar Confectionery Market Revenue (Million) Forecast, by Application 2019 & 2032
- Table 112: Rest of Middle East & Africa Sugar Confectionery Market Volume (K Tons) Forecast, by Application 2019 & 2032
- Table 113: Global Sugar Confectionery Market Revenue Million Forecast, by Confectionery Variant 2019 & 2032
- Table 114: Global Sugar Confectionery Market Volume K Tons Forecast, by Confectionery Variant 2019 & 2032
- Table 115: Global Sugar Confectionery Market Revenue Million Forecast, by Distribution Channel 2019 & 2032
- Table 116: Global Sugar Confectionery Market Volume K Tons Forecast, by Distribution Channel 2019 & 2032
- Table 117: Global Sugar Confectionery Market Revenue Million Forecast, by Country 2019 & 2032
- Table 118: Global Sugar Confectionery Market Volume K Tons Forecast, by Country 2019 & 2032
- Table 119: China Sugar Confectionery Market Revenue (Million) Forecast, by Application 2019 & 2032
- Table 120: China Sugar Confectionery Market Volume (K Tons) Forecast, by Application 2019 & 2032
- Table 121: India Sugar Confectionery Market Revenue (Million) Forecast, by Application 2019 & 2032
- Table 122: India Sugar Confectionery Market Volume (K Tons) Forecast, by Application 2019 & 2032
- Table 123: Japan Sugar Confectionery Market Revenue (Million) Forecast, by Application 2019 & 2032
- Table 124: Japan Sugar Confectionery Market Volume (K Tons) Forecast, by Application 2019 & 2032
- Table 125: South Korea Sugar Confectionery Market Revenue (Million) Forecast, by Application 2019 & 2032
- Table 126: South Korea Sugar Confectionery Market Volume (K Tons) Forecast, by Application 2019 & 2032
- Table 127: ASEAN Sugar Confectionery Market Revenue (Million) Forecast, by Application 2019 & 2032
- Table 128: ASEAN Sugar Confectionery Market Volume (K Tons) Forecast, by Application 2019 & 2032
- Table 129: Oceania Sugar Confectionery Market Revenue (Million) Forecast, by Application 2019 & 2032
- Table 130: Oceania Sugar Confectionery Market Volume (K Tons) Forecast, by Application 2019 & 2032
- Table 131: Rest of Asia Pacific Sugar Confectionery Market Revenue (Million) Forecast, by Application 2019 & 2032
- Table 132: Rest of Asia Pacific Sugar Confectionery Market Volume (K Tons) Forecast, by Application 2019 & 2032
Frequently Asked Questions
1. What is the projected Compound Annual Growth Rate (CAGR) of the Sugar Confectionery Market?
The projected CAGR is approximately 5.45%.
2. Which companies are prominent players in the Sugar Confectionery Market?
Key companies in the market include Nestlé SA, Perfetti Van Melle BV, August Storck KG, Ferrero International SA, Cloetta AB, Oy Karl Fazer Ab, Mars Incorporated, Arcor S A I C, Mount Franklin Foods LLC, HARIBO Holding GmbH & Co KG, The Hershey Compan, Mondelēz International Inc, Meiji Holdings Company Ltd.
3. What are the main segments of the Sugar Confectionery Market?
The market segments include Confectionery Variant, Distribution Channel.
4. Can you provide details about the market size?
The market size is estimated to be USD 53210 Million as of 2022.
5. What are some drivers contributing to market growth?
Increasing demand for meat alternatives.
6. What are the notable trends driving market growth?
OTHER KEY INDUSTRY TRENDS COVERED IN THE REPORT.
7. Are there any restraints impacting market growth?
Presence of numerous alternatives in the plant proteins.
8. Can you provide examples of recent developments in the market?
July 2023: HARIBO® officially began gummi production at its first-ever North American manufacturing facility, located in Pleasant Prairie, Wis. The brand-new, state-of-the-art factory was created to meet the growing demand by US consumers of the beloved gummi brand, which produces over 25 varieties of gummi treats in the US and more than 1,200 types globally.June 2023: Tic Tac launched a new spearmint flavor variant in India. The introduction of this refreshing and strong mint variant is aimed at meeting the longstanding demand for a flavor that can be enjoyed in diverse moments throughout the day, such as after meals, workouts, and before important meetings.May 2023: Mondelēz International Inc. opened its new Global Research & Development (R&D) Innovation Center in Whippany, New Jersey. The state-of-the-art facility, which is supported by an investment of nearly USD 50 million, includes pilot and scale-up capability for cookies, crackers, and candy.
9. What pricing options are available for accessing the report?
Pricing options include single-user, multi-user, and enterprise licenses priced at USD 3800, USD 4500, and USD 5800 respectively.
10. Is the market size provided in terms of value or volume?
The market size is provided in terms of value, measured in Million and volume, measured in K Tons.
11. Are there any specific market keywords associated with the report?
Yes, the market keyword associated with the report is "Sugar Confectionery Market," which aids in identifying and referencing the specific market segment covered.
12. How do I determine which pricing option suits my needs best?
The pricing options vary based on user requirements and access needs. Individual users may opt for single-user licenses, while businesses requiring broader access may choose multi-user or enterprise licenses for cost-effective access to the report.
13. Are there any additional resources or data provided in the Sugar Confectionery Market report?
While the report offers comprehensive insights, it's advisable to review the specific contents or supplementary materials provided to ascertain if additional resources or data are available.
14. How can I stay updated on further developments or reports in the Sugar Confectionery Market?
To stay informed about further developments, trends, and reports in the Sugar Confectionery Market, consider subscribing to industry newsletters, following relevant companies and organizations, or regularly checking reputable industry news sources and publications.
Methodology
Step 1 - Identification of Relevant Samples Size from Population Database


Step 2 - Approaches for Defining Global Market Size (Value, Volume* & Price*)

Note*: In applicable scenarios
Step 3 - Data Sources
Primary Research
- Web Analytics
- Survey Reports
- Research Institute
- Latest Research Reports
- Opinion Leaders
Secondary Research
- Annual Reports
- White Paper
- Latest Press Release
- Industry Association
- Paid Database
- Investor Presentations

Step 4 - Data Triangulation
Involves using different sources of information in order to increase the validity of a study
These sources are likely to be stakeholders in a program - participants, other researchers, program staff, other community members, and so on.
Then we put all data in single framework & apply various statistical tools to find out the dynamic on the market.
During the analysis stage, feedback from the stakeholder groups would be compared to determine areas of agreement as well as areas of divergence
