

Key Insights
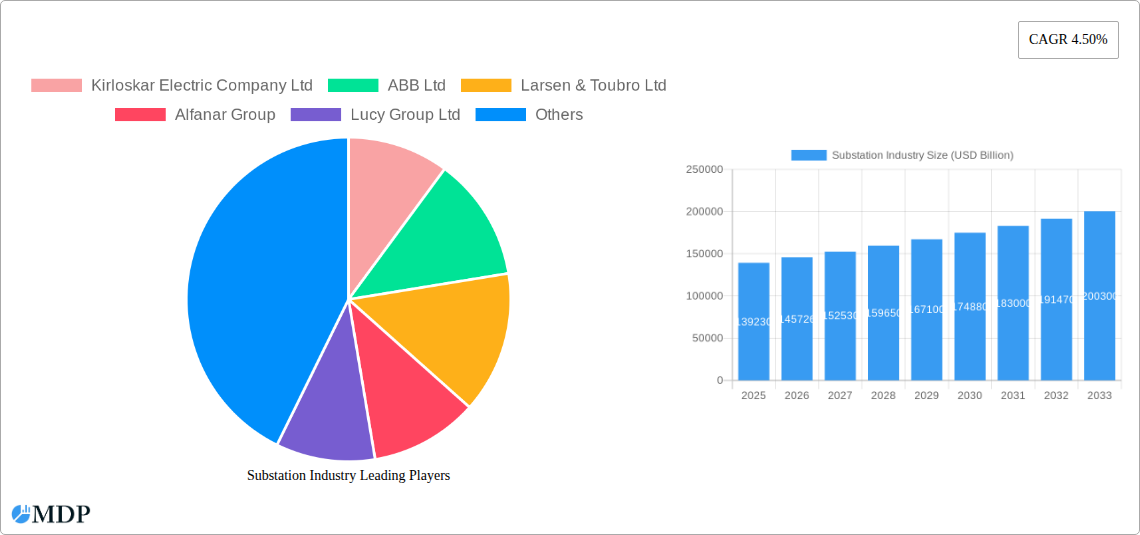
The global substation industry, valued at $139.23 billion in 2025, is projected to experience robust growth, driven by the increasing demand for reliable and efficient power transmission and distribution infrastructure. The expansion of renewable energy sources, particularly solar and wind power, necessitates the construction of new substations and the upgrading of existing ones to accommodate intermittent energy flows and integrate distributed generation. Furthermore, the growing urbanization and industrialization in developing economies, coupled with the need for grid modernization and smart grid initiatives, are fueling substantial investment in substation infrastructure. Technological advancements, such as the adoption of digital substations incorporating advanced sensors, communication networks, and automation systems, are further enhancing efficiency and reliability, contributing to market expansion. The segment breakdown shows significant contributions from High and Medium voltage substations within the Power Utilities and Commercial & Industrial sectors. Competition within the industry is intense, with major players like ABB, Siemens, and Schneider Electric dominating the market share through technological innovation and strategic partnerships. However, regulatory hurdles and the high initial investment costs associated with substation projects can act as restraints on market growth, albeit these are expected to be offset by the long-term benefits of improved grid stability and increased energy efficiency.
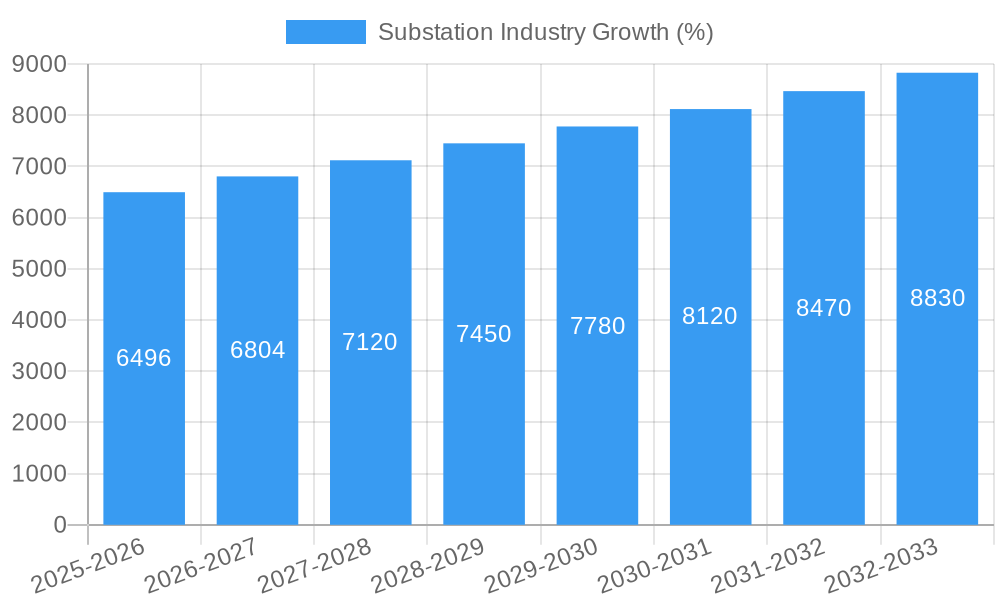
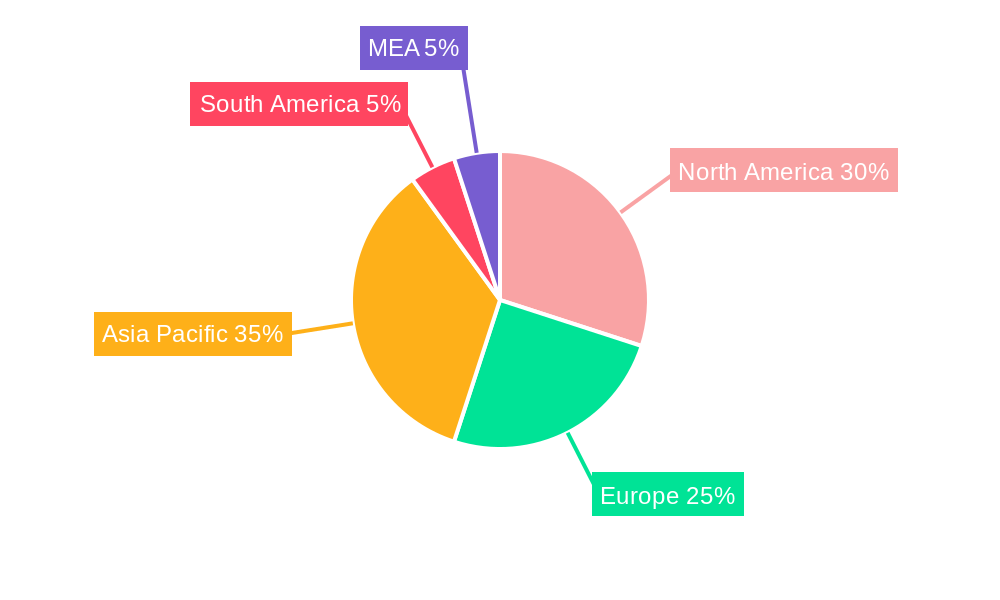
The industry's growth trajectory is expected to continue at a Compound Annual Growth Rate (CAGR) of 4.50% from 2025 to 2033. This steady growth is anticipated across all geographical regions, with North America and Asia Pacific expected to remain dominant markets due to ongoing infrastructure development and technological advancements. However, the growth will not be uniform across all segments. For example, while high voltage substations may see higher growth due to large-scale projects, growth in the medium and low-voltage segments will be largely driven by increased demand from commercial and industrial sectors. Successful players will be those who adapt to changing technological demands and offer comprehensive solutions, combining hardware with sophisticated software and services to meet the evolving needs of customers. The focus will shift towards more sustainable and environmentally friendly substation designs and operations, integrating renewable energy integration and enhanced grid resilience.
Substation Industry Market Report: 2019-2033 Forecast
Unlocking Growth in the Global Substation Market: A Comprehensive Analysis
This comprehensive report provides a detailed analysis of the global substation industry, offering invaluable insights for stakeholders seeking to navigate this dynamic market. With a study period spanning 2019-2033, a base year of 2025, and a forecast period of 2025-2033, this report delivers a clear picture of past performance, current trends, and future projections. The market is expected to reach USD xx Billion by 2033, exhibiting a robust CAGR of xx% during the forecast period. This in-depth analysis encompasses market segmentation by voltage (High, Medium, Low) and application (Power Utilities, Commercial & Industrial, Other Applications), alongside a competitive landscape analysis featuring key players like ABB Ltd, Siemens AG, General Electric Company, and more.
Substation Industry Market Dynamics & Concentration
The global substation market is characterized by moderate concentration, with a few major players holding significant market share. The market share of the top 5 players in 2024 was estimated at xx%, indicating room for both expansion and consolidation. Innovation, driven by the need for grid modernization and increased renewable energy integration, is a key market driver. Regulatory frameworks, particularly those promoting sustainability and grid resilience, heavily influence market dynamics. Product substitutes, while limited, include alternative power distribution methods, continuously impacting market share. End-user trends, including the growing demand for reliable and efficient power distribution across various sectors, are pushing market expansion. M&A activity has been significant in recent years, with xx major deals recorded between 2019 and 2024, primarily driven by strategic acquisitions aimed at expanding product portfolios and geographic reach. This trend is projected to continue during the forecast period.
- Market Concentration: Top 5 players hold xx% market share (2024).
- M&A Activity: xx major deals recorded between 2019 and 2024.
- Innovation Drivers: Grid modernization, renewable energy integration.
- Regulatory Influence: Sustainability and grid resilience standards.
Substation Industry Industry Trends & Analysis
The substation industry is experiencing significant transformation driven by technological advancements, shifting consumer preferences, and intensifying competition. The market's growth is fueled by increasing urbanization, industrialization, and the expanding adoption of renewable energy sources. Technological disruptions, such as the integration of smart grid technologies, digitalization, and the adoption of advanced analytics, are fundamentally altering the industry landscape. Consumers increasingly demand reliable, efficient, and sustainable power distribution solutions, driving the adoption of advanced substation technologies. Competitive dynamics are marked by intense rivalry among established players and the emergence of new entrants, fostering innovation and price competition. The market is projected to experience a compound annual growth rate (CAGR) of xx% from 2025 to 2033, with the market penetration of advanced technologies like AI-powered predictive maintenance increasing significantly.
Leading Markets & Segments in Substation Industry
The High Voltage segment dominates the substation market, driven by the increasing demand for long-distance power transmission and the expansion of large-scale renewable energy projects. Asia-Pacific is currently the leading market, fueled by rapid economic growth and significant investments in infrastructure development. Within applications, the Power Utilities sector accounts for the largest share, reflecting the crucial role substations play in maintaining a stable and reliable power grid.
- Dominant Region: Asia-Pacific
- Dominant Segment (Voltage): High Voltage
- Dominant Segment (Application): Power Utilities
- Key Drivers (Asia-Pacific): Rapid economic growth, infrastructure investment, government initiatives.
- Key Drivers (High Voltage): Long-distance power transmission, renewable energy expansion.
Substation Industry Product Developments
Recent product innovations focus on enhancing efficiency, reliability, and sustainability. This includes the integration of smart sensors, advanced automation systems, and digital twins for predictive maintenance. These advancements provide significant competitive advantages by optimizing operational efficiency, minimizing downtime, and reducing lifecycle costs. The market is witnessing a growing adoption of eco-friendly materials and designs to meet sustainability goals.
Key Drivers of Substation Industry Growth
Several factors propel the growth of the substation industry. These include rising energy demands, expansion of renewable energy sources, and increasing government investments in grid modernization initiatives. Technological advancements, like AI-powered predictive maintenance and digital twins, enhance efficiency and reliability. Furthermore, stringent environmental regulations are driving the adoption of sustainable technologies.
Challenges in the Substation Industry Market
The substation industry faces challenges such as regulatory hurdles in securing project approvals and navigating complex permitting processes. Supply chain disruptions, especially those impacting critical components, pose significant risks. Intense competition among established players and the emergence of new entrants can impact profitability. These factors can collectively lead to project delays and cost overruns, impacting the overall market growth.
Emerging Opportunities in Substation Industry
The long-term growth of the substation industry is driven by the increasing adoption of smart grid technologies, fostering grid resilience and efficiency. Strategic partnerships between technology providers and utilities are unlocking new avenues for innovation. Market expansion into developing economies with burgeoning energy demands presents significant opportunities for growth and investment.
Leading Players in the Substation Industry Sector
- ABB Ltd
- Larsen & Toubro Ltd
- General Electric Company
- Schneider Electric SE
- Eaton Corporation PLC
- Siemens AG
- Kirloskar Electric Company Ltd
- Alfanar Group
- Lucy Group Ltd
- C&S Electric Limited
Key Milestones in Substation Industry Industry
- 2020: Increased investment in R&D for advanced substation technologies by leading players.
- 2021: Several government initiatives launched to promote grid modernization and sustainability.
- 2022: Significant M&A activity and industry consolidation.
- 2023: Increased focus on digitalization and automation across the industry.
- 2024: Several strategic partnerships formed between utilities and technology providers.
Strategic Outlook for Substation Industry Market
The substation industry is poised for continued growth, driven by the increasing need for reliable and efficient power distribution, especially with the rise of renewable energy. Strategic opportunities lie in leveraging technological advancements to enhance grid modernization and sustainability efforts. Focusing on innovative solutions, strategic partnerships, and expansion into emerging markets will be crucial for success in this competitive landscape.
Substation Industry Segmentation
-
1. Voltage
- 1.1. High
- 1.2. Medium
- 1.3. Low
-
2. Application
- 2.1. Power Utilities
- 2.2. Commercial & Industrial
- 2.3. Other Applications
Substation Industry Segmentation By Geography
- 1. North America
- 2. Europe
- 3. Asia Pacific
- 4. South America
- 5. Middle East and Africa
Substation Industry REPORT HIGHLIGHTS
| Aspects | Details |
|---|---|
| Study Period | 2019-2033 |
| Base Year | 2024 |
| Estimated Year | 2025 |
| Forecast Period | 2025-2033 |
| Historical Period | 2019-2024 |
| Growth Rate | CAGR of 4.50% from 2019-2033 |
| Segmentation |
|
Table of Contents
- 1. Introduction
- 1.1. Research Scope
- 1.2. Market Segmentation
- 1.3. Research Methodology
- 1.4. Definitions and Assumptions
- 2. Executive Summary
- 2.1. Introduction
- 3. Market Dynamics
- 3.1. Introduction
- 3.2. Market Drivers
- 3.2.1. 4.; Growing Energy Demand4.; Renewable Energy Transition
- 3.3. Market Restrains
- 3.3.1. 4.; Phasing out of Conventional Sources of Electricity
- 3.4. Market Trends
- 3.4.1. Power Utilities Segment to Witness Significant Growth
- 4. Market Factor Analysis
- 4.1. Porters Five Forces
- 4.2. Supply/Value Chain
- 4.3. PESTEL analysis
- 4.4. Market Entropy
- 4.5. Patent/Trademark Analysis
- 5. Global Substation Industry Analysis, Insights and Forecast, 2019-2031
- 5.1. Market Analysis, Insights and Forecast - by Voltage
- 5.1.1. High
- 5.1.2. Medium
- 5.1.3. Low
- 5.2. Market Analysis, Insights and Forecast - by Application
- 5.2.1. Power Utilities
- 5.2.2. Commercial & Industrial
- 5.2.3. Other Applications
- 5.3. Market Analysis, Insights and Forecast - by Region
- 5.3.1. North America
- 5.3.2. Europe
- 5.3.3. Asia Pacific
- 5.3.4. South America
- 5.3.5. Middle East and Africa
- 5.1. Market Analysis, Insights and Forecast - by Voltage
- 6. North America Substation Industry Analysis, Insights and Forecast, 2019-2031
- 6.1. Market Analysis, Insights and Forecast - by Voltage
- 6.1.1. High
- 6.1.2. Medium
- 6.1.3. Low
- 6.2. Market Analysis, Insights and Forecast - by Application
- 6.2.1. Power Utilities
- 6.2.2. Commercial & Industrial
- 6.2.3. Other Applications
- 6.1. Market Analysis, Insights and Forecast - by Voltage
- 7. Europe Substation Industry Analysis, Insights and Forecast, 2019-2031
- 7.1. Market Analysis, Insights and Forecast - by Voltage
- 7.1.1. High
- 7.1.2. Medium
- 7.1.3. Low
- 7.2. Market Analysis, Insights and Forecast - by Application
- 7.2.1. Power Utilities
- 7.2.2. Commercial & Industrial
- 7.2.3. Other Applications
- 7.1. Market Analysis, Insights and Forecast - by Voltage
- 8. Asia Pacific Substation Industry Analysis, Insights and Forecast, 2019-2031
- 8.1. Market Analysis, Insights and Forecast - by Voltage
- 8.1.1. High
- 8.1.2. Medium
- 8.1.3. Low
- 8.2. Market Analysis, Insights and Forecast - by Application
- 8.2.1. Power Utilities
- 8.2.2. Commercial & Industrial
- 8.2.3. Other Applications
- 8.1. Market Analysis, Insights and Forecast - by Voltage
- 9. South America Substation Industry Analysis, Insights and Forecast, 2019-2031
- 9.1. Market Analysis, Insights and Forecast - by Voltage
- 9.1.1. High
- 9.1.2. Medium
- 9.1.3. Low
- 9.2. Market Analysis, Insights and Forecast - by Application
- 9.2.1. Power Utilities
- 9.2.2. Commercial & Industrial
- 9.2.3. Other Applications
- 9.1. Market Analysis, Insights and Forecast - by Voltage
- 10. Middle East and Africa Substation Industry Analysis, Insights and Forecast, 2019-2031
- 10.1. Market Analysis, Insights and Forecast - by Voltage
- 10.1.1. High
- 10.1.2. Medium
- 10.1.3. Low
- 10.2. Market Analysis, Insights and Forecast - by Application
- 10.2.1. Power Utilities
- 10.2.2. Commercial & Industrial
- 10.2.3. Other Applications
- 10.1. Market Analysis, Insights and Forecast - by Voltage
- 11. North America Substation Industry Analysis, Insights and Forecast, 2019-2031
- 11.1. Market Analysis, Insights and Forecast - By Country/Sub-region
- 11.1.1 United States
- 11.1.2 Canada
- 11.1.3 Mexico
- 12. Europe Substation Industry Analysis, Insights and Forecast, 2019-2031
- 12.1. Market Analysis, Insights and Forecast - By Country/Sub-region
- 12.1.1 Germany
- 12.1.2 United Kingdom
- 12.1.3 France
- 12.1.4 Spain
- 12.1.5 Italy
- 12.1.6 Spain
- 12.1.7 Belgium
- 12.1.8 Netherland
- 12.1.9 Nordics
- 12.1.10 Rest of Europe
- 13. Asia Pacific Substation Industry Analysis, Insights and Forecast, 2019-2031
- 13.1. Market Analysis, Insights and Forecast - By Country/Sub-region
- 13.1.1 China
- 13.1.2 Japan
- 13.1.3 India
- 13.1.4 South Korea
- 13.1.5 Southeast Asia
- 13.1.6 Australia
- 13.1.7 Indonesia
- 13.1.8 Phillipes
- 13.1.9 Singapore
- 13.1.10 Thailandc
- 13.1.11 Rest of Asia Pacific
- 14. South America Substation Industry Analysis, Insights and Forecast, 2019-2031
- 14.1. Market Analysis, Insights and Forecast - By Country/Sub-region
- 14.1.1 Brazil
- 14.1.2 Argentina
- 14.1.3 Peru
- 14.1.4 Chile
- 14.1.5 Colombia
- 14.1.6 Ecuador
- 14.1.7 Venezuela
- 14.1.8 Rest of South America
- 15. MEA Substation Industry Analysis, Insights and Forecast, 2019-2031
- 15.1. Market Analysis, Insights and Forecast - By Country/Sub-region
- 15.1.1 United Arab Emirates
- 15.1.2 Saudi Arabia
- 15.1.3 South Africa
- 15.1.4 Rest of Middle East and Africa
- 16. Competitive Analysis
- 16.1. Global Market Share Analysis 2024
- 16.2. Company Profiles
- 16.2.1 Kirloskar Electric Company Ltd
- 16.2.1.1. Overview
- 16.2.1.2. Products
- 16.2.1.3. SWOT Analysis
- 16.2.1.4. Recent Developments
- 16.2.1.5. Financials (Based on Availability)
- 16.2.2 ABB Ltd
- 16.2.2.1. Overview
- 16.2.2.2. Products
- 16.2.2.3. SWOT Analysis
- 16.2.2.4. Recent Developments
- 16.2.2.5. Financials (Based on Availability)
- 16.2.3 Larsen & Toubro Ltd
- 16.2.3.1. Overview
- 16.2.3.2. Products
- 16.2.3.3. SWOT Analysis
- 16.2.3.4. Recent Developments
- 16.2.3.5. Financials (Based on Availability)
- 16.2.4 Alfanar Group
- 16.2.4.1. Overview
- 16.2.4.2. Products
- 16.2.4.3. SWOT Analysis
- 16.2.4.4. Recent Developments
- 16.2.4.5. Financials (Based on Availability)
- 16.2.5 Lucy Group Ltd
- 16.2.5.1. Overview
- 16.2.5.2. Products
- 16.2.5.3. SWOT Analysis
- 16.2.5.4. Recent Developments
- 16.2.5.5. Financials (Based on Availability)
- 16.2.6 Schneider Electric SE
- 16.2.6.1. Overview
- 16.2.6.2. Products
- 16.2.6.3. SWOT Analysis
- 16.2.6.4. Recent Developments
- 16.2.6.5. Financials (Based on Availability)
- 16.2.7 Eaton Corporation PLC
- 16.2.7.1. Overview
- 16.2.7.2. Products
- 16.2.7.3. SWOT Analysis
- 16.2.7.4. Recent Developments
- 16.2.7.5. Financials (Based on Availability)
- 16.2.8 General Electric Company
- 16.2.8.1. Overview
- 16.2.8.2. Products
- 16.2.8.3. SWOT Analysis
- 16.2.8.4. Recent Developments
- 16.2.8.5. Financials (Based on Availability)
- 16.2.9 C&S Electric Limited*List Not Exhaustive
- 16.2.9.1. Overview
- 16.2.9.2. Products
- 16.2.9.3. SWOT Analysis
- 16.2.9.4. Recent Developments
- 16.2.9.5. Financials (Based on Availability)
- 16.2.10 Siemens AG
- 16.2.10.1. Overview
- 16.2.10.2. Products
- 16.2.10.3. SWOT Analysis
- 16.2.10.4. Recent Developments
- 16.2.10.5. Financials (Based on Availability)
- 16.2.1 Kirloskar Electric Company Ltd
List of Figures
- Figure 1: Global Substation Industry Revenue Breakdown (USD Billion, %) by Region 2024 & 2032
- Figure 2: North America Substation Industry Revenue (USD Billion), by Country 2024 & 2032
- Figure 3: North America Substation Industry Revenue Share (%), by Country 2024 & 2032
- Figure 4: Europe Substation Industry Revenue (USD Billion), by Country 2024 & 2032
- Figure 5: Europe Substation Industry Revenue Share (%), by Country 2024 & 2032
- Figure 6: Asia Pacific Substation Industry Revenue (USD Billion), by Country 2024 & 2032
- Figure 7: Asia Pacific Substation Industry Revenue Share (%), by Country 2024 & 2032
- Figure 8: South America Substation Industry Revenue (USD Billion), by Country 2024 & 2032
- Figure 9: South America Substation Industry Revenue Share (%), by Country 2024 & 2032
- Figure 10: MEA Substation Industry Revenue (USD Billion), by Country 2024 & 2032
- Figure 11: MEA Substation Industry Revenue Share (%), by Country 2024 & 2032
- Figure 12: North America Substation Industry Revenue (USD Billion), by Voltage 2024 & 2032
- Figure 13: North America Substation Industry Revenue Share (%), by Voltage 2024 & 2032
- Figure 14: North America Substation Industry Revenue (USD Billion), by Application 2024 & 2032
- Figure 15: North America Substation Industry Revenue Share (%), by Application 2024 & 2032
- Figure 16: North America Substation Industry Revenue (USD Billion), by Country 2024 & 2032
- Figure 17: North America Substation Industry Revenue Share (%), by Country 2024 & 2032
- Figure 18: Europe Substation Industry Revenue (USD Billion), by Voltage 2024 & 2032
- Figure 19: Europe Substation Industry Revenue Share (%), by Voltage 2024 & 2032
- Figure 20: Europe Substation Industry Revenue (USD Billion), by Application 2024 & 2032
- Figure 21: Europe Substation Industry Revenue Share (%), by Application 2024 & 2032
- Figure 22: Europe Substation Industry Revenue (USD Billion), by Country 2024 & 2032
- Figure 23: Europe Substation Industry Revenue Share (%), by Country 2024 & 2032
- Figure 24: Asia Pacific Substation Industry Revenue (USD Billion), by Voltage 2024 & 2032
- Figure 25: Asia Pacific Substation Industry Revenue Share (%), by Voltage 2024 & 2032
- Figure 26: Asia Pacific Substation Industry Revenue (USD Billion), by Application 2024 & 2032
- Figure 27: Asia Pacific Substation Industry Revenue Share (%), by Application 2024 & 2032
- Figure 28: Asia Pacific Substation Industry Revenue (USD Billion), by Country 2024 & 2032
- Figure 29: Asia Pacific Substation Industry Revenue Share (%), by Country 2024 & 2032
- Figure 30: South America Substation Industry Revenue (USD Billion), by Voltage 2024 & 2032
- Figure 31: South America Substation Industry Revenue Share (%), by Voltage 2024 & 2032
- Figure 32: South America Substation Industry Revenue (USD Billion), by Application 2024 & 2032
- Figure 33: South America Substation Industry Revenue Share (%), by Application 2024 & 2032
- Figure 34: South America Substation Industry Revenue (USD Billion), by Country 2024 & 2032
- Figure 35: South America Substation Industry Revenue Share (%), by Country 2024 & 2032
- Figure 36: Middle East and Africa Substation Industry Revenue (USD Billion), by Voltage 2024 & 2032
- Figure 37: Middle East and Africa Substation Industry Revenue Share (%), by Voltage 2024 & 2032
- Figure 38: Middle East and Africa Substation Industry Revenue (USD Billion), by Application 2024 & 2032
- Figure 39: Middle East and Africa Substation Industry Revenue Share (%), by Application 2024 & 2032
- Figure 40: Middle East and Africa Substation Industry Revenue (USD Billion), by Country 2024 & 2032
- Figure 41: Middle East and Africa Substation Industry Revenue Share (%), by Country 2024 & 2032
List of Tables
- Table 1: Global Substation Industry Revenue USD Billion Forecast, by Region 2019 & 2032
- Table 2: Global Substation Industry Revenue USD Billion Forecast, by Voltage 2019 & 2032
- Table 3: Global Substation Industry Revenue USD Billion Forecast, by Application 2019 & 2032
- Table 4: Global Substation Industry Revenue USD Billion Forecast, by Region 2019 & 2032
- Table 5: Global Substation Industry Revenue USD Billion Forecast, by Country 2019 & 2032
- Table 6: United States Substation Industry Revenue (USD Billion) Forecast, by Application 2019 & 2032
- Table 7: Canada Substation Industry Revenue (USD Billion) Forecast, by Application 2019 & 2032
- Table 8: Mexico Substation Industry Revenue (USD Billion) Forecast, by Application 2019 & 2032
- Table 9: Global Substation Industry Revenue USD Billion Forecast, by Country 2019 & 2032
- Table 10: Germany Substation Industry Revenue (USD Billion) Forecast, by Application 2019 & 2032
- Table 11: United Kingdom Substation Industry Revenue (USD Billion) Forecast, by Application 2019 & 2032
- Table 12: France Substation Industry Revenue (USD Billion) Forecast, by Application 2019 & 2032
- Table 13: Spain Substation Industry Revenue (USD Billion) Forecast, by Application 2019 & 2032
- Table 14: Italy Substation Industry Revenue (USD Billion) Forecast, by Application 2019 & 2032
- Table 15: Spain Substation Industry Revenue (USD Billion) Forecast, by Application 2019 & 2032
- Table 16: Belgium Substation Industry Revenue (USD Billion) Forecast, by Application 2019 & 2032
- Table 17: Netherland Substation Industry Revenue (USD Billion) Forecast, by Application 2019 & 2032
- Table 18: Nordics Substation Industry Revenue (USD Billion) Forecast, by Application 2019 & 2032
- Table 19: Rest of Europe Substation Industry Revenue (USD Billion) Forecast, by Application 2019 & 2032
- Table 20: Global Substation Industry Revenue USD Billion Forecast, by Country 2019 & 2032
- Table 21: China Substation Industry Revenue (USD Billion) Forecast, by Application 2019 & 2032
- Table 22: Japan Substation Industry Revenue (USD Billion) Forecast, by Application 2019 & 2032
- Table 23: India Substation Industry Revenue (USD Billion) Forecast, by Application 2019 & 2032
- Table 24: South Korea Substation Industry Revenue (USD Billion) Forecast, by Application 2019 & 2032
- Table 25: Southeast Asia Substation Industry Revenue (USD Billion) Forecast, by Application 2019 & 2032
- Table 26: Australia Substation Industry Revenue (USD Billion) Forecast, by Application 2019 & 2032
- Table 27: Indonesia Substation Industry Revenue (USD Billion) Forecast, by Application 2019 & 2032
- Table 28: Phillipes Substation Industry Revenue (USD Billion) Forecast, by Application 2019 & 2032
- Table 29: Singapore Substation Industry Revenue (USD Billion) Forecast, by Application 2019 & 2032
- Table 30: Thailandc Substation Industry Revenue (USD Billion) Forecast, by Application 2019 & 2032
- Table 31: Rest of Asia Pacific Substation Industry Revenue (USD Billion) Forecast, by Application 2019 & 2032
- Table 32: Global Substation Industry Revenue USD Billion Forecast, by Country 2019 & 2032
- Table 33: Brazil Substation Industry Revenue (USD Billion) Forecast, by Application 2019 & 2032
- Table 34: Argentina Substation Industry Revenue (USD Billion) Forecast, by Application 2019 & 2032
- Table 35: Peru Substation Industry Revenue (USD Billion) Forecast, by Application 2019 & 2032
- Table 36: Chile Substation Industry Revenue (USD Billion) Forecast, by Application 2019 & 2032
- Table 37: Colombia Substation Industry Revenue (USD Billion) Forecast, by Application 2019 & 2032
- Table 38: Ecuador Substation Industry Revenue (USD Billion) Forecast, by Application 2019 & 2032
- Table 39: Venezuela Substation Industry Revenue (USD Billion) Forecast, by Application 2019 & 2032
- Table 40: Rest of South America Substation Industry Revenue (USD Billion) Forecast, by Application 2019 & 2032
- Table 41: Global Substation Industry Revenue USD Billion Forecast, by Country 2019 & 2032
- Table 42: United Arab Emirates Substation Industry Revenue (USD Billion) Forecast, by Application 2019 & 2032
- Table 43: Saudi Arabia Substation Industry Revenue (USD Billion) Forecast, by Application 2019 & 2032
- Table 44: South Africa Substation Industry Revenue (USD Billion) Forecast, by Application 2019 & 2032
- Table 45: Rest of Middle East and Africa Substation Industry Revenue (USD Billion) Forecast, by Application 2019 & 2032
- Table 46: Global Substation Industry Revenue USD Billion Forecast, by Voltage 2019 & 2032
- Table 47: Global Substation Industry Revenue USD Billion Forecast, by Application 2019 & 2032
- Table 48: Global Substation Industry Revenue USD Billion Forecast, by Country 2019 & 2032
- Table 49: Global Substation Industry Revenue USD Billion Forecast, by Voltage 2019 & 2032
- Table 50: Global Substation Industry Revenue USD Billion Forecast, by Application 2019 & 2032
- Table 51: Global Substation Industry Revenue USD Billion Forecast, by Country 2019 & 2032
- Table 52: Global Substation Industry Revenue USD Billion Forecast, by Voltage 2019 & 2032
- Table 53: Global Substation Industry Revenue USD Billion Forecast, by Application 2019 & 2032
- Table 54: Global Substation Industry Revenue USD Billion Forecast, by Country 2019 & 2032
- Table 55: Global Substation Industry Revenue USD Billion Forecast, by Voltage 2019 & 2032
- Table 56: Global Substation Industry Revenue USD Billion Forecast, by Application 2019 & 2032
- Table 57: Global Substation Industry Revenue USD Billion Forecast, by Country 2019 & 2032
- Table 58: Global Substation Industry Revenue USD Billion Forecast, by Voltage 2019 & 2032
- Table 59: Global Substation Industry Revenue USD Billion Forecast, by Application 2019 & 2032
- Table 60: Global Substation Industry Revenue USD Billion Forecast, by Country 2019 & 2032
Frequently Asked Questions
1. What is the projected Compound Annual Growth Rate (CAGR) of the Substation Industry?
The projected CAGR is approximately 4.50%.
2. Which companies are prominent players in the Substation Industry?
Key companies in the market include Kirloskar Electric Company Ltd, ABB Ltd, Larsen & Toubro Ltd, Alfanar Group, Lucy Group Ltd, Schneider Electric SE, Eaton Corporation PLC, General Electric Company, C&S Electric Limited*List Not Exhaustive, Siemens AG.
3. What are the main segments of the Substation Industry?
The market segments include Voltage, Application.
4. Can you provide details about the market size?
The market size is estimated to be USD 139.23 USD Billion as of 2022.
5. What are some drivers contributing to market growth?
4.; Growing Energy Demand4.; Renewable Energy Transition.
6. What are the notable trends driving market growth?
Power Utilities Segment to Witness Significant Growth.
7. Are there any restraints impacting market growth?
4.; Phasing out of Conventional Sources of Electricity.
8. Can you provide examples of recent developments in the market?
Strategic partnerships between utilities and technology providers
9. What pricing options are available for accessing the report?
Pricing options include single-user, multi-user, and enterprise licenses priced at USD 4750, USD 5250, and USD 8750 respectively.
10. Is the market size provided in terms of value or volume?
The market size is provided in terms of value, measured in USD Billion.
11. Are there any specific market keywords associated with the report?
Yes, the market keyword associated with the report is "Substation Industry," which aids in identifying and referencing the specific market segment covered.
12. How do I determine which pricing option suits my needs best?
The pricing options vary based on user requirements and access needs. Individual users may opt for single-user licenses, while businesses requiring broader access may choose multi-user or enterprise licenses for cost-effective access to the report.
13. Are there any additional resources or data provided in the Substation Industry report?
While the report offers comprehensive insights, it's advisable to review the specific contents or supplementary materials provided to ascertain if additional resources or data are available.
14. How can I stay updated on further developments or reports in the Substation Industry?
To stay informed about further developments, trends, and reports in the Substation Industry, consider subscribing to industry newsletters, following relevant companies and organizations, or regularly checking reputable industry news sources and publications.
Methodology
Step 1 - Identification of Relevant Samples Size from Population Database


Step 2 - Approaches for Defining Global Market Size (Value, Volume* & Price*)

Note*: In applicable scenarios
Step 3 - Data Sources
Primary Research
- Web Analytics
- Survey Reports
- Research Institute
- Latest Research Reports
- Opinion Leaders
Secondary Research
- Annual Reports
- White Paper
- Latest Press Release
- Industry Association
- Paid Database
- Investor Presentations

Step 4 - Data Triangulation
Involves using different sources of information in order to increase the validity of a study
These sources are likely to be stakeholders in a program - participants, other researchers, program staff, other community members, and so on.
Then we put all data in single framework & apply various statistical tools to find out the dynamic on the market.
During the analysis stage, feedback from the stakeholder groups would be compared to determine areas of agreement as well as areas of divergence
