

Key Insights
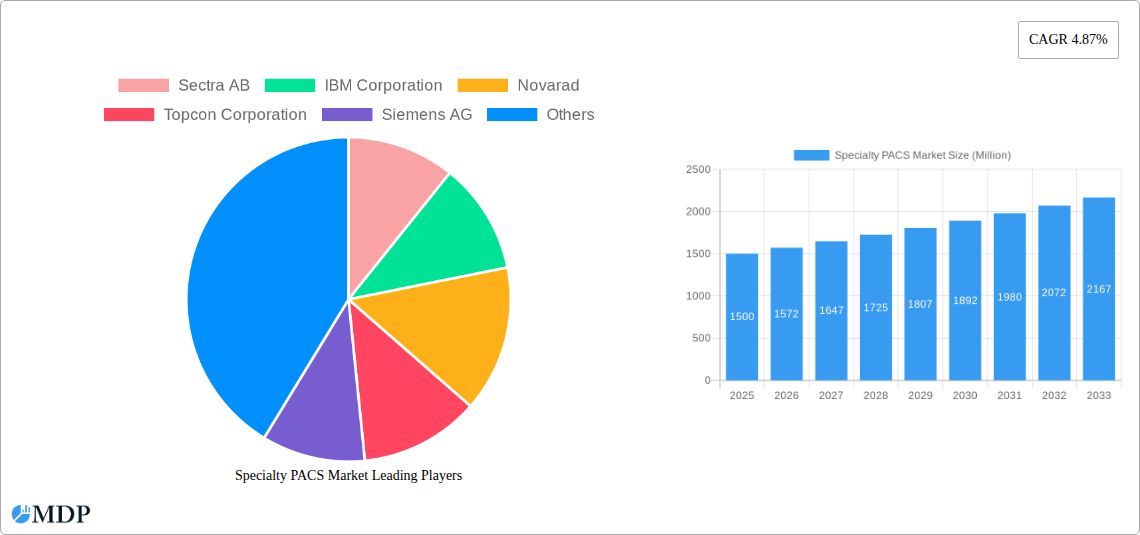
The Specialty PACS market, encompassing cardiovascular, orthopedic, and oncology PACS systems, among others, is experiencing robust growth, projected at a 4.87% CAGR from 2019 to 2033. This expansion is fueled by several key factors. The increasing prevalence of chronic diseases like cardiovascular conditions and cancer necessitates advanced imaging and diagnostic capabilities, driving demand for specialized PACS solutions that offer efficient image management and analysis. Furthermore, the rising adoption of telehealth and remote diagnostics is boosting the market, as these systems facilitate seamless image sharing and collaboration between healthcare professionals across geographical locations. Technological advancements, such as cloud-based PACS and AI-powered image analysis tools, are also enhancing efficiency and diagnostic accuracy, further propelling market growth. The market is segmented by type (cardiovascular, orthopedic, oncology, etc.), component (software, services, hardware), development (on-premise, cloud-based), and end-user (hospitals, diagnostic centers). While the on-premise model remains prevalent, cloud-based solutions are gaining traction due to their scalability, cost-effectiveness, and accessibility. North America currently holds a significant market share, driven by high healthcare expenditure and technological adoption. However, the Asia-Pacific region is poised for substantial growth due to increasing healthcare infrastructure development and rising disposable incomes. Competition is intense, with major players like Sectra AB, IBM Corporation, and Siemens AG vying for market dominance through innovation and strategic partnerships.
The restraints to market growth primarily involve high initial investment costs for implementing Specialty PACS systems, particularly for smaller healthcare facilities. Data security and privacy concerns also pose a challenge, requiring robust cybersecurity measures. However, the long-term benefits of improved diagnostic accuracy, enhanced workflow efficiency, and reduced storage costs outweigh these challenges. The integration of Artificial Intelligence (AI) and machine learning into PACS systems is expected to significantly improve diagnostic accuracy and efficiency, further driving market growth in the coming years. The ongoing trend of consolidation within the healthcare sector is also influencing the market, leading to larger healthcare providers adopting comprehensive PACS solutions. The market's future trajectory hinges on sustained technological innovation, regulatory support for telehealth, and increasing investments in healthcare infrastructure globally. The shift towards value-based care will also drive demand for better diagnostic tools that contribute to improved patient outcomes.
Specialty PACS Market: A Comprehensive Report (2019-2033)
This in-depth report provides a comprehensive analysis of the Specialty PACS Market, offering invaluable insights for stakeholders across the healthcare IT landscape. With a focus on market dynamics, industry trends, leading segments, and key players, this report projects a robust growth trajectory for the Specialty PACS market, reaching xx Million by 2033. The study period covers 2019-2033, with 2025 as the base and estimated year. The forecast period spans 2025-2033, and the historical period encompasses 2019-2024.
Specialty PACS Market Market Dynamics & Concentration
The Specialty PACS market, valued at xx Million in 2024, is experiencing significant growth driven by the increasing adoption of digital imaging technologies and the need for efficient image management in specialized healthcare settings. Market concentration is moderately high, with key players like Sectra AB, IBM Corporation, and Siemens AG holding significant market share. However, the market also features several smaller, specialized vendors catering to niche segments.
- Innovation Drivers: Advancements in AI-powered image analysis, cloud-based solutions, and integration with other healthcare IT systems are key innovation drivers.
- Regulatory Frameworks: Compliance with HIPAA and other data privacy regulations is crucial and impacts market dynamics.
- Product Substitutes: While limited, alternative image management solutions exist, but they often lack the specialized functionalities of a dedicated Specialty PACS.
- End-User Trends: Hospitals and diagnostic centers are the primary end-users, showing a strong preference for scalable, interoperable solutions.
- M&A Activities: The market has witnessed xx M&A deals in the last five years, indicating consolidation and expansion strategies among key players. Market share is currently distributed as follows: Sectra AB (xx%), IBM Corporation (xx%), Siemens AG (xx%), and others (xx%).
Specialty PACS Market Industry Trends & Analysis
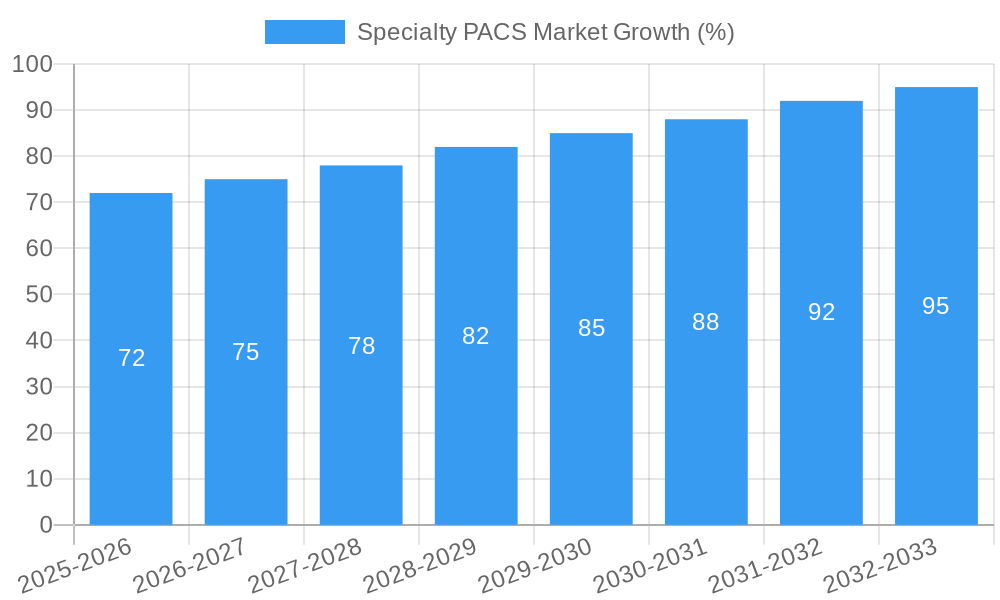
The Specialty PACS market is projected to exhibit a CAGR of xx% during the forecast period (2025-2033). This robust growth is propelled by several factors. The increasing prevalence of chronic diseases necessitates advanced imaging technologies and efficient management systems. Furthermore, the rising adoption of telehealth and remote diagnostics is driving demand for cloud-based Specialty PACS solutions. Technological disruptions, such as AI-powered image analysis and improved workflow automation, are enhancing efficiency and diagnostic accuracy. Consumer preferences are shifting towards user-friendly interfaces and seamless integration with existing hospital systems. Intense competition among established players and emerging vendors is fueling innovation and price optimization, further boosting market penetration. Market penetration in developed regions is high, while emerging markets show significant growth potential.
Leading Markets & Segments in Specialty PACS Market
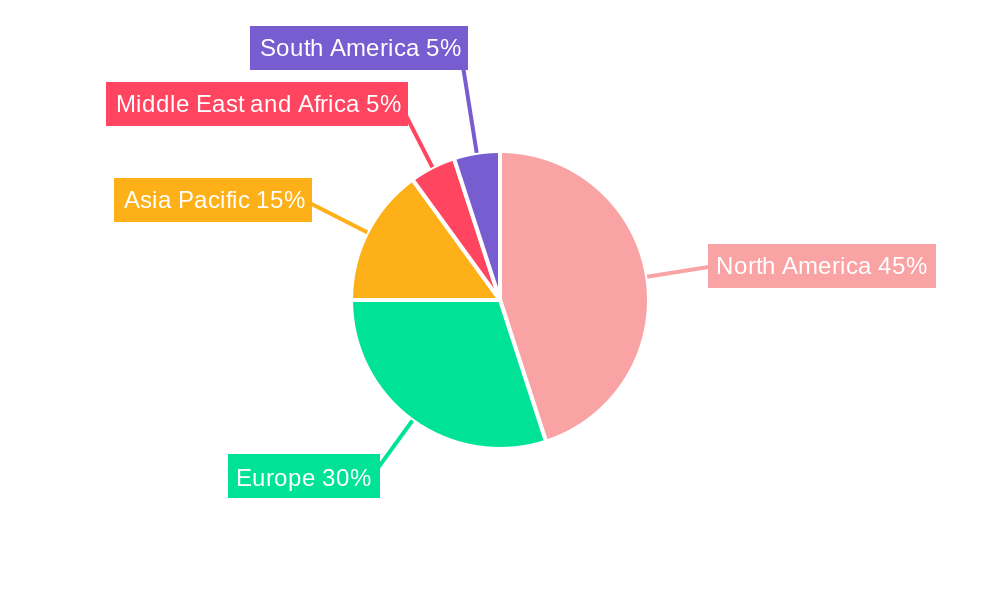
The North American region dominates the Specialty PACS market, driven by high healthcare spending, advanced infrastructure, and early adoption of new technologies. Within segments:
- Type: Cardiovascular PACS holds the largest market share, followed by Oncology PACS and Orthopedic PACS. This is due to the higher volume of cardiovascular imaging procedures and the growing need for precise image analysis in oncology and orthopedics.
- Component: Software accounts for the largest revenue share, followed by services and hardware. The increasing demand for sophisticated image analysis and workflow management solutions drives software adoption.
- Development: Web/Cloud-based Specialty PACS is gaining popularity due to its scalability, accessibility, and reduced infrastructure costs. Hospitals are the primary end-users, followed by Diagnostic Centers.
Key Drivers:
- North America: High healthcare expenditure, advanced medical infrastructure, and strong regulatory support.
- Europe: Increasing adoption of digital health initiatives and growing investment in healthcare IT.
- Asia Pacific: Rapid economic growth, rising healthcare expenditure, and expanding medical tourism.
Specialty PACS Market Product Developments
Recent product innovations focus on AI-powered diagnostic tools integrated within PACS systems, improving the speed and accuracy of diagnoses. Cloud-based solutions offer enhanced accessibility and scalability, while improved interoperability allows seamless integration with other hospital information systems. These advancements cater to the growing demand for efficient and cost-effective image management solutions that enhance patient care.
Key Drivers of Specialty PACS Market Growth
The Specialty PACS market is driven by factors like rising demand for efficient image management, increasing adoption of digital imaging techniques in specialized healthcare settings, technological advancements leading to improved diagnostic accuracy, and government initiatives promoting the use of electronic health records and image management systems. The shift towards cloud-based solutions and the growing integration of AI in medical imaging further accelerate market growth.
Challenges in the Specialty PACS Market Market
High initial investment costs and the need for skilled IT professionals for system implementation and maintenance can pose challenges. Data security concerns and compliance with stringent regulatory requirements (like HIPAA) also add to the complexity. Moreover, integrating new systems with legacy systems can prove difficult, increasing implementation timelines and costs. Competitive pressure from established vendors and new entrants necessitates continuous innovation and cost optimization strategies.
Emerging Opportunities in Specialty PACS Market
The integration of AI and machine learning for advanced image analysis presents significant opportunities for growth. Strategic partnerships between PACS vendors and healthcare providers will enhance market penetration. Expansion into emerging markets with increasing healthcare infrastructure spending offers considerable potential. Furthermore, development of specialized PACS modules for emerging medical specialties and the growing adoption of remote diagnostics will fuel market expansion.
Leading Players in the Specialty PACS Market Sector
- Sectra AB
- IBM Corporation
- Novarad
- Topcon Corporation
- Siemens AG
- Philips Healthcare
- Canon USA Inc
- Agfa Healthcare
- McKesson Corporation
- Fujifilm Holdings Corporation (Fujifilm Medical Systems)
Key Milestones in Specialty PACS Market Industry
- April 2022: FUJIFILM Healthcare Americas Corporation installed Fujifilm's Synapse Cardiology PACS version 7 at Emory Healthcare, enhancing cardiovascular imaging analysis capabilities.
- March 2022: Intelerad Medical Systems launched its Enterprise Imaging and Informatics Suite, aiming to improve data integration across the healthcare ecosystem.
Strategic Outlook for Specialty PACS Market Market
The Specialty PACS market is poised for substantial growth, driven by technological advancements, increasing demand for efficient image management solutions, and expansion into emerging markets. Strategic partnerships, investments in R&D, and focusing on specialized PACS solutions for niche segments will be crucial for market leadership. The development of AI-powered diagnostic tools and cloud-based solutions will shape the future of the Specialty PACS market, offering enhanced diagnostic capabilities and improved workflow efficiency for healthcare providers.
Specialty PACS Market Segmentation
-
1. Type
- 1.1. Cardiovascular PACS
- 1.2. Orthopedic PACS
- 1.3. Oncology PACS
- 1.4. Other Types
-
2. Component
- 2.1. Software
- 2.2. Services
- 2.3. Hardware
-
3. Development
- 3.1. On-premise Specialty PACS
- 3.2. Web/Cloud-based Specialty PACS
-
4. End User
- 4.1. Hospitals
- 4.2. Diagnostic Centers
- 4.3. Other End Users
Specialty PACS Market Segmentation By Geography
-
1. North America
- 1.1. United States
- 1.2. Canada
- 1.3. Mexico
-
2. Europe
- 2.1. Germany
- 2.2. United Kingdom
- 2.3. France
- 2.4. Italy
- 2.5. Spain
- 2.6. Rest of Europe
-
3. Asia Pacific
- 3.1. China
- 3.2. Japan
- 3.3. India
- 3.4. Australia
- 3.5. South Korea
- 3.6. Rest of Asia Pacific
-
4. Middle East and Africa
- 4.1. GCC
- 4.2. South Africa
- 4.3. Rest of Middle East and Africa
-
5. South America
- 5.1. Brazil
- 5.2. Argentina
- 5.3. Rest of South America
Specialty PACS Market REPORT HIGHLIGHTS
| Aspects | Details |
|---|---|
| Study Period | 2019-2033 |
| Base Year | 2024 |
| Estimated Year | 2025 |
| Forecast Period | 2025-2033 |
| Historical Period | 2019-2024 |
| Growth Rate | CAGR of 4.87% from 2019-2033 |
| Segmentation |
|
Table of Contents
- 1. Introduction
- 1.1. Research Scope
- 1.2. Market Segmentation
- 1.3. Research Methodology
- 1.4. Definitions and Assumptions
- 2. Executive Summary
- 2.1. Introduction
- 3. Market Dynamics
- 3.1. Introduction
- 3.2. Market Drivers
- 3.2.1. Growing Use of Imaging Devices; Growing Burden of Chronic Diseases
- 3.3. Market Restrains
- 3.3.1. Data Security and Privacy Issues
- 3.4. Market Trends
- 3.4.1. On-premise Specialty PACS are Expected to Hold the Largest Market Share in the Specialty PACS Market
- 4. Market Factor Analysis
- 4.1. Porters Five Forces
- 4.2. Supply/Value Chain
- 4.3. PESTEL analysis
- 4.4. Market Entropy
- 4.5. Patent/Trademark Analysis
- 5. Global Specialty PACS Market Analysis, Insights and Forecast, 2019-2031
- 5.1. Market Analysis, Insights and Forecast - by Type
- 5.1.1. Cardiovascular PACS
- 5.1.2. Orthopedic PACS
- 5.1.3. Oncology PACS
- 5.1.4. Other Types
- 5.2. Market Analysis, Insights and Forecast - by Component
- 5.2.1. Software
- 5.2.2. Services
- 5.2.3. Hardware
- 5.3. Market Analysis, Insights and Forecast - by Development
- 5.3.1. On-premise Specialty PACS
- 5.3.2. Web/Cloud-based Specialty PACS
- 5.4. Market Analysis, Insights and Forecast - by End User
- 5.4.1. Hospitals
- 5.4.2. Diagnostic Centers
- 5.4.3. Other End Users
- 5.5. Market Analysis, Insights and Forecast - by Region
- 5.5.1. North America
- 5.5.2. Europe
- 5.5.3. Asia Pacific
- 5.5.4. Middle East and Africa
- 5.5.5. South America
- 5.1. Market Analysis, Insights and Forecast - by Type
- 6. North America Specialty PACS Market Analysis, Insights and Forecast, 2019-2031
- 6.1. Market Analysis, Insights and Forecast - by Type
- 6.1.1. Cardiovascular PACS
- 6.1.2. Orthopedic PACS
- 6.1.3. Oncology PACS
- 6.1.4. Other Types
- 6.2. Market Analysis, Insights and Forecast - by Component
- 6.2.1. Software
- 6.2.2. Services
- 6.2.3. Hardware
- 6.3. Market Analysis, Insights and Forecast - by Development
- 6.3.1. On-premise Specialty PACS
- 6.3.2. Web/Cloud-based Specialty PACS
- 6.4. Market Analysis, Insights and Forecast - by End User
- 6.4.1. Hospitals
- 6.4.2. Diagnostic Centers
- 6.4.3. Other End Users
- 6.1. Market Analysis, Insights and Forecast - by Type
- 7. Europe Specialty PACS Market Analysis, Insights and Forecast, 2019-2031
- 7.1. Market Analysis, Insights and Forecast - by Type
- 7.1.1. Cardiovascular PACS
- 7.1.2. Orthopedic PACS
- 7.1.3. Oncology PACS
- 7.1.4. Other Types
- 7.2. Market Analysis, Insights and Forecast - by Component
- 7.2.1. Software
- 7.2.2. Services
- 7.2.3. Hardware
- 7.3. Market Analysis, Insights and Forecast - by Development
- 7.3.1. On-premise Specialty PACS
- 7.3.2. Web/Cloud-based Specialty PACS
- 7.4. Market Analysis, Insights and Forecast - by End User
- 7.4.1. Hospitals
- 7.4.2. Diagnostic Centers
- 7.4.3. Other End Users
- 7.1. Market Analysis, Insights and Forecast - by Type
- 8. Asia Pacific Specialty PACS Market Analysis, Insights and Forecast, 2019-2031
- 8.1. Market Analysis, Insights and Forecast - by Type
- 8.1.1. Cardiovascular PACS
- 8.1.2. Orthopedic PACS
- 8.1.3. Oncology PACS
- 8.1.4. Other Types
- 8.2. Market Analysis, Insights and Forecast - by Component
- 8.2.1. Software
- 8.2.2. Services
- 8.2.3. Hardware
- 8.3. Market Analysis, Insights and Forecast - by Development
- 8.3.1. On-premise Specialty PACS
- 8.3.2. Web/Cloud-based Specialty PACS
- 8.4. Market Analysis, Insights and Forecast - by End User
- 8.4.1. Hospitals
- 8.4.2. Diagnostic Centers
- 8.4.3. Other End Users
- 8.1. Market Analysis, Insights and Forecast - by Type
- 9. Middle East and Africa Specialty PACS Market Analysis, Insights and Forecast, 2019-2031
- 9.1. Market Analysis, Insights and Forecast - by Type
- 9.1.1. Cardiovascular PACS
- 9.1.2. Orthopedic PACS
- 9.1.3. Oncology PACS
- 9.1.4. Other Types
- 9.2. Market Analysis, Insights and Forecast - by Component
- 9.2.1. Software
- 9.2.2. Services
- 9.2.3. Hardware
- 9.3. Market Analysis, Insights and Forecast - by Development
- 9.3.1. On-premise Specialty PACS
- 9.3.2. Web/Cloud-based Specialty PACS
- 9.4. Market Analysis, Insights and Forecast - by End User
- 9.4.1. Hospitals
- 9.4.2. Diagnostic Centers
- 9.4.3. Other End Users
- 9.1. Market Analysis, Insights and Forecast - by Type
- 10. South America Specialty PACS Market Analysis, Insights and Forecast, 2019-2031
- 10.1. Market Analysis, Insights and Forecast - by Type
- 10.1.1. Cardiovascular PACS
- 10.1.2. Orthopedic PACS
- 10.1.3. Oncology PACS
- 10.1.4. Other Types
- 10.2. Market Analysis, Insights and Forecast - by Component
- 10.2.1. Software
- 10.2.2. Services
- 10.2.3. Hardware
- 10.3. Market Analysis, Insights and Forecast - by Development
- 10.3.1. On-premise Specialty PACS
- 10.3.2. Web/Cloud-based Specialty PACS
- 10.4. Market Analysis, Insights and Forecast - by End User
- 10.4.1. Hospitals
- 10.4.2. Diagnostic Centers
- 10.4.3. Other End Users
- 10.1. Market Analysis, Insights and Forecast - by Type
- 11. North America Specialty PACS Market Analysis, Insights and Forecast, 2019-2031
- 11.1. Market Analysis, Insights and Forecast - By Country/Sub-region
- 11.1.1 United States
- 11.1.2 Canada
- 11.1.3 Mexico
- 12. Europe Specialty PACS Market Analysis, Insights and Forecast, 2019-2031
- 12.1. Market Analysis, Insights and Forecast - By Country/Sub-region
- 12.1.1 Germany
- 12.1.2 United Kingdom
- 12.1.3 France
- 12.1.4 Italy
- 12.1.5 Spain
- 12.1.6 Rest of Europe
- 13. Asia Pacific Specialty PACS Market Analysis, Insights and Forecast, 2019-2031
- 13.1. Market Analysis, Insights and Forecast - By Country/Sub-region
- 13.1.1 China
- 13.1.2 Japan
- 13.1.3 India
- 13.1.4 Australia
- 13.1.5 South Korea
- 13.1.6 Rest of Asia Pacific
- 14. Middle East and Africa Specialty PACS Market Analysis, Insights and Forecast, 2019-2031
- 14.1. Market Analysis, Insights and Forecast - By Country/Sub-region
- 14.1.1 GCC
- 14.1.2 South Africa
- 14.1.3 Rest of Middle East and Africa
- 15. South America Specialty PACS Market Analysis, Insights and Forecast, 2019-2031
- 15.1. Market Analysis, Insights and Forecast - By Country/Sub-region
- 15.1.1 Brazil
- 15.1.2 Argentina
- 15.1.3 Rest of South America
- 16. Competitive Analysis
- 16.1. Global Market Share Analysis 2024
- 16.2. Company Profiles
- 16.2.1 Sectra AB
- 16.2.1.1. Overview
- 16.2.1.2. Products
- 16.2.1.3. SWOT Analysis
- 16.2.1.4. Recent Developments
- 16.2.1.5. Financials (Based on Availability)
- 16.2.2 IBM Corporation
- 16.2.2.1. Overview
- 16.2.2.2. Products
- 16.2.2.3. SWOT Analysis
- 16.2.2.4. Recent Developments
- 16.2.2.5. Financials (Based on Availability)
- 16.2.3 Novarad
- 16.2.3.1. Overview
- 16.2.3.2. Products
- 16.2.3.3. SWOT Analysis
- 16.2.3.4. Recent Developments
- 16.2.3.5. Financials (Based on Availability)
- 16.2.4 Topcon Corporation
- 16.2.4.1. Overview
- 16.2.4.2. Products
- 16.2.4.3. SWOT Analysis
- 16.2.4.4. Recent Developments
- 16.2.4.5. Financials (Based on Availability)
- 16.2.5 Siemens AG
- 16.2.5.1. Overview
- 16.2.5.2. Products
- 16.2.5.3. SWOT Analysis
- 16.2.5.4. Recent Developments
- 16.2.5.5. Financials (Based on Availability)
- 16.2.6 Philips Healthcare
- 16.2.6.1. Overview
- 16.2.6.2. Products
- 16.2.6.3. SWOT Analysis
- 16.2.6.4. Recent Developments
- 16.2.6.5. Financials (Based on Availability)
- 16.2.7 Canon USA Inc
- 16.2.7.1. Overview
- 16.2.7.2. Products
- 16.2.7.3. SWOT Analysis
- 16.2.7.4. Recent Developments
- 16.2.7.5. Financials (Based on Availability)
- 16.2.8 Agfa Healthcare
- 16.2.8.1. Overview
- 16.2.8.2. Products
- 16.2.8.3. SWOT Analysis
- 16.2.8.4. Recent Developments
- 16.2.8.5. Financials (Based on Availability)
- 16.2.9 McKesson Corporation
- 16.2.9.1. Overview
- 16.2.9.2. Products
- 16.2.9.3. SWOT Analysis
- 16.2.9.4. Recent Developments
- 16.2.9.5. Financials (Based on Availability)
- 16.2.10 Fujifilm Holdings Corporation (Fujifilm Medical Systems)
- 16.2.10.1. Overview
- 16.2.10.2. Products
- 16.2.10.3. SWOT Analysis
- 16.2.10.4. Recent Developments
- 16.2.10.5. Financials (Based on Availability)
- 16.2.1 Sectra AB
List of Figures
- Figure 1: Global Specialty PACS Market Revenue Breakdown (Million, %) by Region 2024 & 2032
- Figure 2: Global Specialty PACS Market Volume Breakdown (K Unit, %) by Region 2024 & 2032
- Figure 3: North America Specialty PACS Market Revenue (Million), by Country 2024 & 2032
- Figure 4: North America Specialty PACS Market Volume (K Unit), by Country 2024 & 2032
- Figure 5: North America Specialty PACS Market Revenue Share (%), by Country 2024 & 2032
- Figure 6: North America Specialty PACS Market Volume Share (%), by Country 2024 & 2032
- Figure 7: Europe Specialty PACS Market Revenue (Million), by Country 2024 & 2032
- Figure 8: Europe Specialty PACS Market Volume (K Unit), by Country 2024 & 2032
- Figure 9: Europe Specialty PACS Market Revenue Share (%), by Country 2024 & 2032
- Figure 10: Europe Specialty PACS Market Volume Share (%), by Country 2024 & 2032
- Figure 11: Asia Pacific Specialty PACS Market Revenue (Million), by Country 2024 & 2032
- Figure 12: Asia Pacific Specialty PACS Market Volume (K Unit), by Country 2024 & 2032
- Figure 13: Asia Pacific Specialty PACS Market Revenue Share (%), by Country 2024 & 2032
- Figure 14: Asia Pacific Specialty PACS Market Volume Share (%), by Country 2024 & 2032
- Figure 15: Middle East and Africa Specialty PACS Market Revenue (Million), by Country 2024 & 2032
- Figure 16: Middle East and Africa Specialty PACS Market Volume (K Unit), by Country 2024 & 2032
- Figure 17: Middle East and Africa Specialty PACS Market Revenue Share (%), by Country 2024 & 2032
- Figure 18: Middle East and Africa Specialty PACS Market Volume Share (%), by Country 2024 & 2032
- Figure 19: South America Specialty PACS Market Revenue (Million), by Country 2024 & 2032
- Figure 20: South America Specialty PACS Market Volume (K Unit), by Country 2024 & 2032
- Figure 21: South America Specialty PACS Market Revenue Share (%), by Country 2024 & 2032
- Figure 22: South America Specialty PACS Market Volume Share (%), by Country 2024 & 2032
- Figure 23: North America Specialty PACS Market Revenue (Million), by Type 2024 & 2032
- Figure 24: North America Specialty PACS Market Volume (K Unit), by Type 2024 & 2032
- Figure 25: North America Specialty PACS Market Revenue Share (%), by Type 2024 & 2032
- Figure 26: North America Specialty PACS Market Volume Share (%), by Type 2024 & 2032
- Figure 27: North America Specialty PACS Market Revenue (Million), by Component 2024 & 2032
- Figure 28: North America Specialty PACS Market Volume (K Unit), by Component 2024 & 2032
- Figure 29: North America Specialty PACS Market Revenue Share (%), by Component 2024 & 2032
- Figure 30: North America Specialty PACS Market Volume Share (%), by Component 2024 & 2032
- Figure 31: North America Specialty PACS Market Revenue (Million), by Development 2024 & 2032
- Figure 32: North America Specialty PACS Market Volume (K Unit), by Development 2024 & 2032
- Figure 33: North America Specialty PACS Market Revenue Share (%), by Development 2024 & 2032
- Figure 34: North America Specialty PACS Market Volume Share (%), by Development 2024 & 2032
- Figure 35: North America Specialty PACS Market Revenue (Million), by End User 2024 & 2032
- Figure 36: North America Specialty PACS Market Volume (K Unit), by End User 2024 & 2032
- Figure 37: North America Specialty PACS Market Revenue Share (%), by End User 2024 & 2032
- Figure 38: North America Specialty PACS Market Volume Share (%), by End User 2024 & 2032
- Figure 39: North America Specialty PACS Market Revenue (Million), by Country 2024 & 2032
- Figure 40: North America Specialty PACS Market Volume (K Unit), by Country 2024 & 2032
- Figure 41: North America Specialty PACS Market Revenue Share (%), by Country 2024 & 2032
- Figure 42: North America Specialty PACS Market Volume Share (%), by Country 2024 & 2032
- Figure 43: Europe Specialty PACS Market Revenue (Million), by Type 2024 & 2032
- Figure 44: Europe Specialty PACS Market Volume (K Unit), by Type 2024 & 2032
- Figure 45: Europe Specialty PACS Market Revenue Share (%), by Type 2024 & 2032
- Figure 46: Europe Specialty PACS Market Volume Share (%), by Type 2024 & 2032
- Figure 47: Europe Specialty PACS Market Revenue (Million), by Component 2024 & 2032
- Figure 48: Europe Specialty PACS Market Volume (K Unit), by Component 2024 & 2032
- Figure 49: Europe Specialty PACS Market Revenue Share (%), by Component 2024 & 2032
- Figure 50: Europe Specialty PACS Market Volume Share (%), by Component 2024 & 2032
- Figure 51: Europe Specialty PACS Market Revenue (Million), by Development 2024 & 2032
- Figure 52: Europe Specialty PACS Market Volume (K Unit), by Development 2024 & 2032
- Figure 53: Europe Specialty PACS Market Revenue Share (%), by Development 2024 & 2032
- Figure 54: Europe Specialty PACS Market Volume Share (%), by Development 2024 & 2032
- Figure 55: Europe Specialty PACS Market Revenue (Million), by End User 2024 & 2032
- Figure 56: Europe Specialty PACS Market Volume (K Unit), by End User 2024 & 2032
- Figure 57: Europe Specialty PACS Market Revenue Share (%), by End User 2024 & 2032
- Figure 58: Europe Specialty PACS Market Volume Share (%), by End User 2024 & 2032
- Figure 59: Europe Specialty PACS Market Revenue (Million), by Country 2024 & 2032
- Figure 60: Europe Specialty PACS Market Volume (K Unit), by Country 2024 & 2032
- Figure 61: Europe Specialty PACS Market Revenue Share (%), by Country 2024 & 2032
- Figure 62: Europe Specialty PACS Market Volume Share (%), by Country 2024 & 2032
- Figure 63: Asia Pacific Specialty PACS Market Revenue (Million), by Type 2024 & 2032
- Figure 64: Asia Pacific Specialty PACS Market Volume (K Unit), by Type 2024 & 2032
- Figure 65: Asia Pacific Specialty PACS Market Revenue Share (%), by Type 2024 & 2032
- Figure 66: Asia Pacific Specialty PACS Market Volume Share (%), by Type 2024 & 2032
- Figure 67: Asia Pacific Specialty PACS Market Revenue (Million), by Component 2024 & 2032
- Figure 68: Asia Pacific Specialty PACS Market Volume (K Unit), by Component 2024 & 2032
- Figure 69: Asia Pacific Specialty PACS Market Revenue Share (%), by Component 2024 & 2032
- Figure 70: Asia Pacific Specialty PACS Market Volume Share (%), by Component 2024 & 2032
- Figure 71: Asia Pacific Specialty PACS Market Revenue (Million), by Development 2024 & 2032
- Figure 72: Asia Pacific Specialty PACS Market Volume (K Unit), by Development 2024 & 2032
- Figure 73: Asia Pacific Specialty PACS Market Revenue Share (%), by Development 2024 & 2032
- Figure 74: Asia Pacific Specialty PACS Market Volume Share (%), by Development 2024 & 2032
- Figure 75: Asia Pacific Specialty PACS Market Revenue (Million), by End User 2024 & 2032
- Figure 76: Asia Pacific Specialty PACS Market Volume (K Unit), by End User 2024 & 2032
- Figure 77: Asia Pacific Specialty PACS Market Revenue Share (%), by End User 2024 & 2032
- Figure 78: Asia Pacific Specialty PACS Market Volume Share (%), by End User 2024 & 2032
- Figure 79: Asia Pacific Specialty PACS Market Revenue (Million), by Country 2024 & 2032
- Figure 80: Asia Pacific Specialty PACS Market Volume (K Unit), by Country 2024 & 2032
- Figure 81: Asia Pacific Specialty PACS Market Revenue Share (%), by Country 2024 & 2032
- Figure 82: Asia Pacific Specialty PACS Market Volume Share (%), by Country 2024 & 2032
- Figure 83: Middle East and Africa Specialty PACS Market Revenue (Million), by Type 2024 & 2032
- Figure 84: Middle East and Africa Specialty PACS Market Volume (K Unit), by Type 2024 & 2032
- Figure 85: Middle East and Africa Specialty PACS Market Revenue Share (%), by Type 2024 & 2032
- Figure 86: Middle East and Africa Specialty PACS Market Volume Share (%), by Type 2024 & 2032
- Figure 87: Middle East and Africa Specialty PACS Market Revenue (Million), by Component 2024 & 2032
- Figure 88: Middle East and Africa Specialty PACS Market Volume (K Unit), by Component 2024 & 2032
- Figure 89: Middle East and Africa Specialty PACS Market Revenue Share (%), by Component 2024 & 2032
- Figure 90: Middle East and Africa Specialty PACS Market Volume Share (%), by Component 2024 & 2032
- Figure 91: Middle East and Africa Specialty PACS Market Revenue (Million), by Development 2024 & 2032
- Figure 92: Middle East and Africa Specialty PACS Market Volume (K Unit), by Development 2024 & 2032
- Figure 93: Middle East and Africa Specialty PACS Market Revenue Share (%), by Development 2024 & 2032
- Figure 94: Middle East and Africa Specialty PACS Market Volume Share (%), by Development 2024 & 2032
- Figure 95: Middle East and Africa Specialty PACS Market Revenue (Million), by End User 2024 & 2032
- Figure 96: Middle East and Africa Specialty PACS Market Volume (K Unit), by End User 2024 & 2032
- Figure 97: Middle East and Africa Specialty PACS Market Revenue Share (%), by End User 2024 & 2032
- Figure 98: Middle East and Africa Specialty PACS Market Volume Share (%), by End User 2024 & 2032
- Figure 99: Middle East and Africa Specialty PACS Market Revenue (Million), by Country 2024 & 2032
- Figure 100: Middle East and Africa Specialty PACS Market Volume (K Unit), by Country 2024 & 2032
- Figure 101: Middle East and Africa Specialty PACS Market Revenue Share (%), by Country 2024 & 2032
- Figure 102: Middle East and Africa Specialty PACS Market Volume Share (%), by Country 2024 & 2032
- Figure 103: South America Specialty PACS Market Revenue (Million), by Type 2024 & 2032
- Figure 104: South America Specialty PACS Market Volume (K Unit), by Type 2024 & 2032
- Figure 105: South America Specialty PACS Market Revenue Share (%), by Type 2024 & 2032
- Figure 106: South America Specialty PACS Market Volume Share (%), by Type 2024 & 2032
- Figure 107: South America Specialty PACS Market Revenue (Million), by Component 2024 & 2032
- Figure 108: South America Specialty PACS Market Volume (K Unit), by Component 2024 & 2032
- Figure 109: South America Specialty PACS Market Revenue Share (%), by Component 2024 & 2032
- Figure 110: South America Specialty PACS Market Volume Share (%), by Component 2024 & 2032
- Figure 111: South America Specialty PACS Market Revenue (Million), by Development 2024 & 2032
- Figure 112: South America Specialty PACS Market Volume (K Unit), by Development 2024 & 2032
- Figure 113: South America Specialty PACS Market Revenue Share (%), by Development 2024 & 2032
- Figure 114: South America Specialty PACS Market Volume Share (%), by Development 2024 & 2032
- Figure 115: South America Specialty PACS Market Revenue (Million), by End User 2024 & 2032
- Figure 116: South America Specialty PACS Market Volume (K Unit), by End User 2024 & 2032
- Figure 117: South America Specialty PACS Market Revenue Share (%), by End User 2024 & 2032
- Figure 118: South America Specialty PACS Market Volume Share (%), by End User 2024 & 2032
- Figure 119: South America Specialty PACS Market Revenue (Million), by Country 2024 & 2032
- Figure 120: South America Specialty PACS Market Volume (K Unit), by Country 2024 & 2032
- Figure 121: South America Specialty PACS Market Revenue Share (%), by Country 2024 & 2032
- Figure 122: South America Specialty PACS Market Volume Share (%), by Country 2024 & 2032
List of Tables
- Table 1: Global Specialty PACS Market Revenue Million Forecast, by Region 2019 & 2032
- Table 2: Global Specialty PACS Market Volume K Unit Forecast, by Region 2019 & 2032
- Table 3: Global Specialty PACS Market Revenue Million Forecast, by Type 2019 & 2032
- Table 4: Global Specialty PACS Market Volume K Unit Forecast, by Type 2019 & 2032
- Table 5: Global Specialty PACS Market Revenue Million Forecast, by Component 2019 & 2032
- Table 6: Global Specialty PACS Market Volume K Unit Forecast, by Component 2019 & 2032
- Table 7: Global Specialty PACS Market Revenue Million Forecast, by Development 2019 & 2032
- Table 8: Global Specialty PACS Market Volume K Unit Forecast, by Development 2019 & 2032
- Table 9: Global Specialty PACS Market Revenue Million Forecast, by End User 2019 & 2032
- Table 10: Global Specialty PACS Market Volume K Unit Forecast, by End User 2019 & 2032
- Table 11: Global Specialty PACS Market Revenue Million Forecast, by Region 2019 & 2032
- Table 12: Global Specialty PACS Market Volume K Unit Forecast, by Region 2019 & 2032
- Table 13: Global Specialty PACS Market Revenue Million Forecast, by Country 2019 & 2032
- Table 14: Global Specialty PACS Market Volume K Unit Forecast, by Country 2019 & 2032
- Table 15: United States Specialty PACS Market Revenue (Million) Forecast, by Application 2019 & 2032
- Table 16: United States Specialty PACS Market Volume (K Unit) Forecast, by Application 2019 & 2032
- Table 17: Canada Specialty PACS Market Revenue (Million) Forecast, by Application 2019 & 2032
- Table 18: Canada Specialty PACS Market Volume (K Unit) Forecast, by Application 2019 & 2032
- Table 19: Mexico Specialty PACS Market Revenue (Million) Forecast, by Application 2019 & 2032
- Table 20: Mexico Specialty PACS Market Volume (K Unit) Forecast, by Application 2019 & 2032
- Table 21: Global Specialty PACS Market Revenue Million Forecast, by Country 2019 & 2032
- Table 22: Global Specialty PACS Market Volume K Unit Forecast, by Country 2019 & 2032
- Table 23: Germany Specialty PACS Market Revenue (Million) Forecast, by Application 2019 & 2032
- Table 24: Germany Specialty PACS Market Volume (K Unit) Forecast, by Application 2019 & 2032
- Table 25: United Kingdom Specialty PACS Market Revenue (Million) Forecast, by Application 2019 & 2032
- Table 26: United Kingdom Specialty PACS Market Volume (K Unit) Forecast, by Application 2019 & 2032
- Table 27: France Specialty PACS Market Revenue (Million) Forecast, by Application 2019 & 2032
- Table 28: France Specialty PACS Market Volume (K Unit) Forecast, by Application 2019 & 2032
- Table 29: Italy Specialty PACS Market Revenue (Million) Forecast, by Application 2019 & 2032
- Table 30: Italy Specialty PACS Market Volume (K Unit) Forecast, by Application 2019 & 2032
- Table 31: Spain Specialty PACS Market Revenue (Million) Forecast, by Application 2019 & 2032
- Table 32: Spain Specialty PACS Market Volume (K Unit) Forecast, by Application 2019 & 2032
- Table 33: Rest of Europe Specialty PACS Market Revenue (Million) Forecast, by Application 2019 & 2032
- Table 34: Rest of Europe Specialty PACS Market Volume (K Unit) Forecast, by Application 2019 & 2032
- Table 35: Global Specialty PACS Market Revenue Million Forecast, by Country 2019 & 2032
- Table 36: Global Specialty PACS Market Volume K Unit Forecast, by Country 2019 & 2032
- Table 37: China Specialty PACS Market Revenue (Million) Forecast, by Application 2019 & 2032
- Table 38: China Specialty PACS Market Volume (K Unit) Forecast, by Application 2019 & 2032
- Table 39: Japan Specialty PACS Market Revenue (Million) Forecast, by Application 2019 & 2032
- Table 40: Japan Specialty PACS Market Volume (K Unit) Forecast, by Application 2019 & 2032
- Table 41: India Specialty PACS Market Revenue (Million) Forecast, by Application 2019 & 2032
- Table 42: India Specialty PACS Market Volume (K Unit) Forecast, by Application 2019 & 2032
- Table 43: Australia Specialty PACS Market Revenue (Million) Forecast, by Application 2019 & 2032
- Table 44: Australia Specialty PACS Market Volume (K Unit) Forecast, by Application 2019 & 2032
- Table 45: South Korea Specialty PACS Market Revenue (Million) Forecast, by Application 2019 & 2032
- Table 46: South Korea Specialty PACS Market Volume (K Unit) Forecast, by Application 2019 & 2032
- Table 47: Rest of Asia Pacific Specialty PACS Market Revenue (Million) Forecast, by Application 2019 & 2032
- Table 48: Rest of Asia Pacific Specialty PACS Market Volume (K Unit) Forecast, by Application 2019 & 2032
- Table 49: Global Specialty PACS Market Revenue Million Forecast, by Country 2019 & 2032
- Table 50: Global Specialty PACS Market Volume K Unit Forecast, by Country 2019 & 2032
- Table 51: GCC Specialty PACS Market Revenue (Million) Forecast, by Application 2019 & 2032
- Table 52: GCC Specialty PACS Market Volume (K Unit) Forecast, by Application 2019 & 2032
- Table 53: South Africa Specialty PACS Market Revenue (Million) Forecast, by Application 2019 & 2032
- Table 54: South Africa Specialty PACS Market Volume (K Unit) Forecast, by Application 2019 & 2032
- Table 55: Rest of Middle East and Africa Specialty PACS Market Revenue (Million) Forecast, by Application 2019 & 2032
- Table 56: Rest of Middle East and Africa Specialty PACS Market Volume (K Unit) Forecast, by Application 2019 & 2032
- Table 57: Global Specialty PACS Market Revenue Million Forecast, by Country 2019 & 2032
- Table 58: Global Specialty PACS Market Volume K Unit Forecast, by Country 2019 & 2032
- Table 59: Brazil Specialty PACS Market Revenue (Million) Forecast, by Application 2019 & 2032
- Table 60: Brazil Specialty PACS Market Volume (K Unit) Forecast, by Application 2019 & 2032
- Table 61: Argentina Specialty PACS Market Revenue (Million) Forecast, by Application 2019 & 2032
- Table 62: Argentina Specialty PACS Market Volume (K Unit) Forecast, by Application 2019 & 2032
- Table 63: Rest of South America Specialty PACS Market Revenue (Million) Forecast, by Application 2019 & 2032
- Table 64: Rest of South America Specialty PACS Market Volume (K Unit) Forecast, by Application 2019 & 2032
- Table 65: Global Specialty PACS Market Revenue Million Forecast, by Type 2019 & 2032
- Table 66: Global Specialty PACS Market Volume K Unit Forecast, by Type 2019 & 2032
- Table 67: Global Specialty PACS Market Revenue Million Forecast, by Component 2019 & 2032
- Table 68: Global Specialty PACS Market Volume K Unit Forecast, by Component 2019 & 2032
- Table 69: Global Specialty PACS Market Revenue Million Forecast, by Development 2019 & 2032
- Table 70: Global Specialty PACS Market Volume K Unit Forecast, by Development 2019 & 2032
- Table 71: Global Specialty PACS Market Revenue Million Forecast, by End User 2019 & 2032
- Table 72: Global Specialty PACS Market Volume K Unit Forecast, by End User 2019 & 2032
- Table 73: Global Specialty PACS Market Revenue Million Forecast, by Country 2019 & 2032
- Table 74: Global Specialty PACS Market Volume K Unit Forecast, by Country 2019 & 2032
- Table 75: United States Specialty PACS Market Revenue (Million) Forecast, by Application 2019 & 2032
- Table 76: United States Specialty PACS Market Volume (K Unit) Forecast, by Application 2019 & 2032
- Table 77: Canada Specialty PACS Market Revenue (Million) Forecast, by Application 2019 & 2032
- Table 78: Canada Specialty PACS Market Volume (K Unit) Forecast, by Application 2019 & 2032
- Table 79: Mexico Specialty PACS Market Revenue (Million) Forecast, by Application 2019 & 2032
- Table 80: Mexico Specialty PACS Market Volume (K Unit) Forecast, by Application 2019 & 2032
- Table 81: Global Specialty PACS Market Revenue Million Forecast, by Type 2019 & 2032
- Table 82: Global Specialty PACS Market Volume K Unit Forecast, by Type 2019 & 2032
- Table 83: Global Specialty PACS Market Revenue Million Forecast, by Component 2019 & 2032
- Table 84: Global Specialty PACS Market Volume K Unit Forecast, by Component 2019 & 2032
- Table 85: Global Specialty PACS Market Revenue Million Forecast, by Development 2019 & 2032
- Table 86: Global Specialty PACS Market Volume K Unit Forecast, by Development 2019 & 2032
- Table 87: Global Specialty PACS Market Revenue Million Forecast, by End User 2019 & 2032
- Table 88: Global Specialty PACS Market Volume K Unit Forecast, by End User 2019 & 2032
- Table 89: Global Specialty PACS Market Revenue Million Forecast, by Country 2019 & 2032
- Table 90: Global Specialty PACS Market Volume K Unit Forecast, by Country 2019 & 2032
- Table 91: Germany Specialty PACS Market Revenue (Million) Forecast, by Application 2019 & 2032
- Table 92: Germany Specialty PACS Market Volume (K Unit) Forecast, by Application 2019 & 2032
- Table 93: United Kingdom Specialty PACS Market Revenue (Million) Forecast, by Application 2019 & 2032
- Table 94: United Kingdom Specialty PACS Market Volume (K Unit) Forecast, by Application 2019 & 2032
- Table 95: France Specialty PACS Market Revenue (Million) Forecast, by Application 2019 & 2032
- Table 96: France Specialty PACS Market Volume (K Unit) Forecast, by Application 2019 & 2032
- Table 97: Italy Specialty PACS Market Revenue (Million) Forecast, by Application 2019 & 2032
- Table 98: Italy Specialty PACS Market Volume (K Unit) Forecast, by Application 2019 & 2032
- Table 99: Spain Specialty PACS Market Revenue (Million) Forecast, by Application 2019 & 2032
- Table 100: Spain Specialty PACS Market Volume (K Unit) Forecast, by Application 2019 & 2032
- Table 101: Rest of Europe Specialty PACS Market Revenue (Million) Forecast, by Application 2019 & 2032
- Table 102: Rest of Europe Specialty PACS Market Volume (K Unit) Forecast, by Application 2019 & 2032
- Table 103: Global Specialty PACS Market Revenue Million Forecast, by Type 2019 & 2032
- Table 104: Global Specialty PACS Market Volume K Unit Forecast, by Type 2019 & 2032
- Table 105: Global Specialty PACS Market Revenue Million Forecast, by Component 2019 & 2032
- Table 106: Global Specialty PACS Market Volume K Unit Forecast, by Component 2019 & 2032
- Table 107: Global Specialty PACS Market Revenue Million Forecast, by Development 2019 & 2032
- Table 108: Global Specialty PACS Market Volume K Unit Forecast, by Development 2019 & 2032
- Table 109: Global Specialty PACS Market Revenue Million Forecast, by End User 2019 & 2032
- Table 110: Global Specialty PACS Market Volume K Unit Forecast, by End User 2019 & 2032
- Table 111: Global Specialty PACS Market Revenue Million Forecast, by Country 2019 & 2032
- Table 112: Global Specialty PACS Market Volume K Unit Forecast, by Country 2019 & 2032
- Table 113: China Specialty PACS Market Revenue (Million) Forecast, by Application 2019 & 2032
- Table 114: China Specialty PACS Market Volume (K Unit) Forecast, by Application 2019 & 2032
- Table 115: Japan Specialty PACS Market Revenue (Million) Forecast, by Application 2019 & 2032
- Table 116: Japan Specialty PACS Market Volume (K Unit) Forecast, by Application 2019 & 2032
- Table 117: India Specialty PACS Market Revenue (Million) Forecast, by Application 2019 & 2032
- Table 118: India Specialty PACS Market Volume (K Unit) Forecast, by Application 2019 & 2032
- Table 119: Australia Specialty PACS Market Revenue (Million) Forecast, by Application 2019 & 2032
- Table 120: Australia Specialty PACS Market Volume (K Unit) Forecast, by Application 2019 & 2032
- Table 121: South Korea Specialty PACS Market Revenue (Million) Forecast, by Application 2019 & 2032
- Table 122: South Korea Specialty PACS Market Volume (K Unit) Forecast, by Application 2019 & 2032
- Table 123: Rest of Asia Pacific Specialty PACS Market Revenue (Million) Forecast, by Application 2019 & 2032
- Table 124: Rest of Asia Pacific Specialty PACS Market Volume (K Unit) Forecast, by Application 2019 & 2032
- Table 125: Global Specialty PACS Market Revenue Million Forecast, by Type 2019 & 2032
- Table 126: Global Specialty PACS Market Volume K Unit Forecast, by Type 2019 & 2032
- Table 127: Global Specialty PACS Market Revenue Million Forecast, by Component 2019 & 2032
- Table 128: Global Specialty PACS Market Volume K Unit Forecast, by Component 2019 & 2032
- Table 129: Global Specialty PACS Market Revenue Million Forecast, by Development 2019 & 2032
- Table 130: Global Specialty PACS Market Volume K Unit Forecast, by Development 2019 & 2032
- Table 131: Global Specialty PACS Market Revenue Million Forecast, by End User 2019 & 2032
- Table 132: Global Specialty PACS Market Volume K Unit Forecast, by End User 2019 & 2032
- Table 133: Global Specialty PACS Market Revenue Million Forecast, by Country 2019 & 2032
- Table 134: Global Specialty PACS Market Volume K Unit Forecast, by Country 2019 & 2032
- Table 135: GCC Specialty PACS Market Revenue (Million) Forecast, by Application 2019 & 2032
- Table 136: GCC Specialty PACS Market Volume (K Unit) Forecast, by Application 2019 & 2032
- Table 137: South Africa Specialty PACS Market Revenue (Million) Forecast, by Application 2019 & 2032
- Table 138: South Africa Specialty PACS Market Volume (K Unit) Forecast, by Application 2019 & 2032
- Table 139: Rest of Middle East and Africa Specialty PACS Market Revenue (Million) Forecast, by Application 2019 & 2032
- Table 140: Rest of Middle East and Africa Specialty PACS Market Volume (K Unit) Forecast, by Application 2019 & 2032
- Table 141: Global Specialty PACS Market Revenue Million Forecast, by Type 2019 & 2032
- Table 142: Global Specialty PACS Market Volume K Unit Forecast, by Type 2019 & 2032
- Table 143: Global Specialty PACS Market Revenue Million Forecast, by Component 2019 & 2032
- Table 144: Global Specialty PACS Market Volume K Unit Forecast, by Component 2019 & 2032
- Table 145: Global Specialty PACS Market Revenue Million Forecast, by Development 2019 & 2032
- Table 146: Global Specialty PACS Market Volume K Unit Forecast, by Development 2019 & 2032
- Table 147: Global Specialty PACS Market Revenue Million Forecast, by End User 2019 & 2032
- Table 148: Global Specialty PACS Market Volume K Unit Forecast, by End User 2019 & 2032
- Table 149: Global Specialty PACS Market Revenue Million Forecast, by Country 2019 & 2032
- Table 150: Global Specialty PACS Market Volume K Unit Forecast, by Country 2019 & 2032
- Table 151: Brazil Specialty PACS Market Revenue (Million) Forecast, by Application 2019 & 2032
- Table 152: Brazil Specialty PACS Market Volume (K Unit) Forecast, by Application 2019 & 2032
- Table 153: Argentina Specialty PACS Market Revenue (Million) Forecast, by Application 2019 & 2032
- Table 154: Argentina Specialty PACS Market Volume (K Unit) Forecast, by Application 2019 & 2032
- Table 155: Rest of South America Specialty PACS Market Revenue (Million) Forecast, by Application 2019 & 2032
- Table 156: Rest of South America Specialty PACS Market Volume (K Unit) Forecast, by Application 2019 & 2032
Frequently Asked Questions
1. What is the projected Compound Annual Growth Rate (CAGR) of the Specialty PACS Market?
The projected CAGR is approximately 4.87%.
2. Which companies are prominent players in the Specialty PACS Market?
Key companies in the market include Sectra AB, IBM Corporation, Novarad, Topcon Corporation, Siemens AG, Philips Healthcare, Canon USA Inc, Agfa Healthcare, McKesson Corporation, Fujifilm Holdings Corporation (Fujifilm Medical Systems).
3. What are the main segments of the Specialty PACS Market?
The market segments include Type, Component, Development, End User.
4. Can you provide details about the market size?
The market size is estimated to be USD XX Million as of 2022.
5. What are some drivers contributing to market growth?
Growing Use of Imaging Devices; Growing Burden of Chronic Diseases.
6. What are the notable trends driving market growth?
On-premise Specialty PACS are Expected to Hold the Largest Market Share in the Specialty PACS Market.
7. Are there any restraints impacting market growth?
Data Security and Privacy Issues.
8. Can you provide examples of recent developments in the market?
April 2022: FUJIFILM Healthcare Americas Corporation installed Fujifilm's Synapse Cardiology PACS version 7 throughout Emory Healthcare facilities to store, process, and analyze heart and vascular imaging. Emory Healthcare is the most comprehensive academic health system in Georgia.
9. What pricing options are available for accessing the report?
Pricing options include single-user, multi-user, and enterprise licenses priced at USD 4750, USD 5250, and USD 8750 respectively.
10. Is the market size provided in terms of value or volume?
The market size is provided in terms of value, measured in Million and volume, measured in K Unit.
11. Are there any specific market keywords associated with the report?
Yes, the market keyword associated with the report is "Specialty PACS Market," which aids in identifying and referencing the specific market segment covered.
12. How do I determine which pricing option suits my needs best?
The pricing options vary based on user requirements and access needs. Individual users may opt for single-user licenses, while businesses requiring broader access may choose multi-user or enterprise licenses for cost-effective access to the report.
13. Are there any additional resources or data provided in the Specialty PACS Market report?
While the report offers comprehensive insights, it's advisable to review the specific contents or supplementary materials provided to ascertain if additional resources or data are available.
14. How can I stay updated on further developments or reports in the Specialty PACS Market?
To stay informed about further developments, trends, and reports in the Specialty PACS Market, consider subscribing to industry newsletters, following relevant companies and organizations, or regularly checking reputable industry news sources and publications.
Methodology
Step 1 - Identification of Relevant Samples Size from Population Database


Step 2 - Approaches for Defining Global Market Size (Value, Volume* & Price*)

Note*: In applicable scenarios
Step 3 - Data Sources
Primary Research
- Web Analytics
- Survey Reports
- Research Institute
- Latest Research Reports
- Opinion Leaders
Secondary Research
- Annual Reports
- White Paper
- Latest Press Release
- Industry Association
- Paid Database
- Investor Presentations

Step 4 - Data Triangulation
Involves using different sources of information in order to increase the validity of a study
These sources are likely to be stakeholders in a program - participants, other researchers, program staff, other community members, and so on.
Then we put all data in single framework & apply various statistical tools to find out the dynamic on the market.
During the analysis stage, feedback from the stakeholder groups would be compared to determine areas of agreement as well as areas of divergence
