

Key Insights
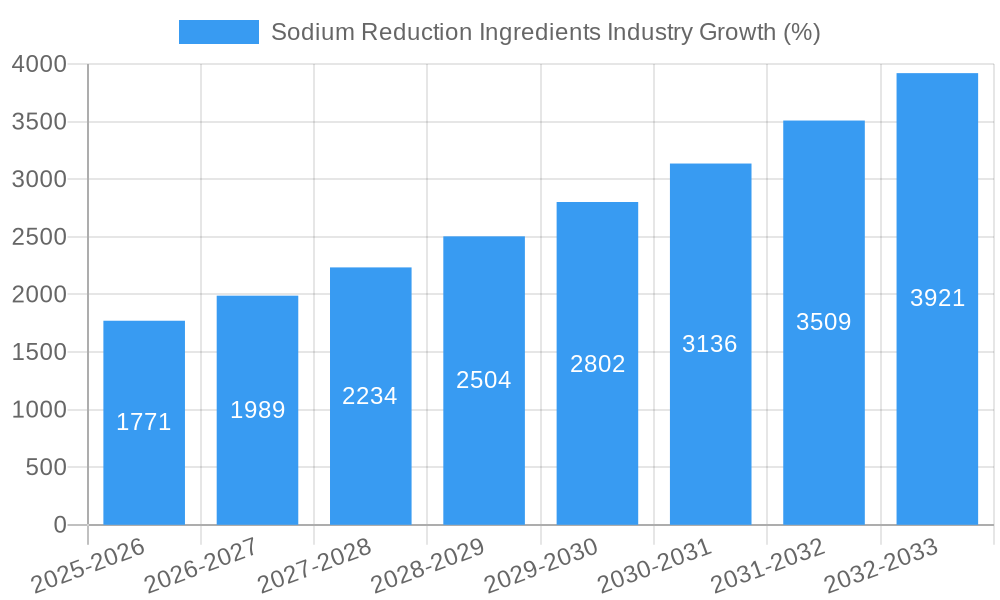
The Sodium Reduction Ingredients market is experiencing robust growth, projected to reach a substantial size by 2033, driven by increasing health consciousness and stringent government regulations aimed at curbing sodium intake globally. The market's 11.71% CAGR from 2019-2024 indicates significant expansion, and this upward trajectory is expected to continue throughout the forecast period (2025-2033). Key drivers include the rising prevalence of hypertension and cardiovascular diseases linked to high sodium consumption, fueling consumer demand for healthier food options. Furthermore, the food and beverage industry is actively seeking innovative solutions to reduce sodium content without compromising taste or texture, creating significant opportunities for sodium reduction ingredient manufacturers. Market segmentation reveals strong growth across various product types, including amino acids & glutamates, mineral salts (like potassium chloride, often used as a sodium substitute), calcium chloride, and yeast extracts, each catering to specific application needs in the bakery, confectionery, condiments, dairy, meat, and snack food sectors. The competitive landscape is characterized by a mix of established multinational corporations and specialized ingredient suppliers, showcasing ongoing innovation and investment in this expanding market.
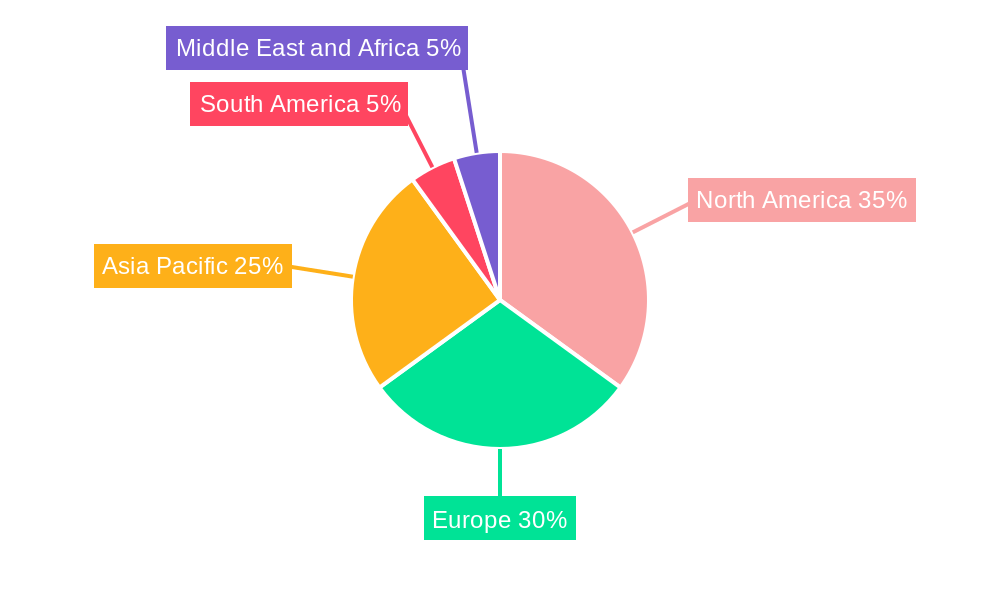
The regional distribution of the market exhibits variations, with North America and Europe currently holding significant market shares due to established regulatory frameworks and high consumer awareness. However, the Asia-Pacific region is poised for rapid growth, propelled by rising disposable incomes, changing dietary habits, and increasing prevalence of sodium-related health issues. While challenges remain, such as maintaining the organoleptic properties of food products after sodium reduction and the varying cost-effectiveness of different sodium reduction ingredients, ongoing research and development efforts are focused on overcoming these limitations. This creates a promising outlook for continued market expansion and diversification of product offerings. The continued focus on health and wellness, coupled with the increasing awareness of the health consequences of high sodium diets, is expected to propel the market to even greater heights in the coming years.
Sodium Reduction Ingredients Industry: Market Report 2019-2033
This comprehensive report provides an in-depth analysis of the Sodium Reduction Ingredients industry, offering valuable insights for stakeholders across the value chain. The study period spans from 2019-2033, with 2025 serving as the base and estimated year. The report meticulously covers market dynamics, leading players, emerging trends, and future growth opportunities, presenting a robust forecast for 2025-2033. The global market size is projected to reach xx Million by 2033, exhibiting a CAGR of xx% during the forecast period.
Sodium Reduction Ingredients Industry Market Dynamics & Concentration
The Sodium Reduction Ingredients market is characterized by a moderately concentrated landscape, with a few key players holding significant market share. However, the market is also witnessing increased participation from smaller, specialized companies focusing on niche applications and innovative product offerings. Innovation is a key driver, with continuous research and development leading to the introduction of novel sodium reduction solutions. Stringent regulatory frameworks globally, particularly concerning sodium limits in processed foods, are significantly influencing market growth. Product substitutes, such as potassium chloride and other mineral salts, are gaining traction, presenting both opportunities and challenges for existing players. Consumer preferences are increasingly shifting towards healthier food options, leading to higher demand for sodium-reduced ingredients. Mergers and acquisitions (M&A) activity is moderate, with strategic partnerships shaping the industry landscape.
- Market Concentration: The top 5 players account for approximately xx% of the global market share in 2025.
- M&A Activity: An estimated xx M&A deals were recorded between 2019 and 2024, mostly driven by consolidation within the industry.
- Innovation Drivers: Focus on clean-label ingredients, functional benefits, and improved taste and texture.
- Regulatory Frameworks: Stringent regulations on sodium content in food products are increasing globally.
- Product Substitutes: Growing adoption of potassium chloride and other mineral salts as sodium substitutes.
- End-User Trends: Rising consumer demand for healthier food choices fuels market growth.
Sodium Reduction Ingredients Industry Industry Trends & Analysis
The Sodium Reduction Ingredients market is experiencing robust growth driven by several key factors. The increasing prevalence of diet-related diseases such as hypertension and cardiovascular issues has fueled global health concerns, leading consumers to actively seek low-sodium food options. This, in turn, drives demand for sodium reduction ingredients across various food and beverage applications. Technological advancements are continually improving the taste and texture of sodium-reduced products, making them more appealing to consumers. Furthermore, favorable government regulations and public health initiatives promoting sodium reduction contribute significantly to market growth. The competitive landscape is dynamic, with established players and new entrants continually innovating and expanding their product portfolios. Market penetration of sodium reduction ingredients varies by region and application; however, overall growth momentum remains strong.
Leading Markets & Segments in Sodium Reduction Ingredients Industry
The North American region holds a dominant position in the Sodium Reduction Ingredients market due to high consumer awareness of health issues, stringent regulations, and a robust food processing industry. Within product types, Yeast Extracts hold the largest market share, followed by Amino Acids & Glutamates. In terms of applications, the Bakery & Confectionery segment is a major consumer of sodium reduction ingredients due to high volume production and demand.
Key Drivers:
- North America: High consumer awareness of health, stringent regulations, and a developed food processing industry.
- Bakery & Confectionery: High volume production and consumer demand for healthier baked goods.
- Yeast Extracts: Superior taste and functional properties in various applications.
Dominance Analysis:
The consistent growth in the North American region is driven by increasing health consciousness among consumers, coupled with stringent government regulations aimed at reducing sodium intake. The larger share of Yeast Extracts stems from their versatility, ability to enhance flavors, and role as a natural alternative to salt. Similarly, the significant market share held by the Bakery & Confectionery segment is attributed to a high volume of processed food items in this category.
Sodium Reduction Ingredients Industry Product Developments
Recent product innovations have focused on developing clean-label, natural sodium reduction ingredients with improved functionalities to address consumer demands for better taste, texture, and overall product quality. Technological advancements are resulting in more effective and palatable sodium substitutes, expanding application possibilities across various food categories. Companies are aggressively focusing on developing customized solutions to meet the specific needs of individual food manufacturers, leading to a more differentiated market.
Key Drivers of Sodium Reduction Ingredients Industry Growth
The Sodium Reduction Ingredients industry is propelled by several key drivers: the rising global prevalence of diet-related illnesses, increased consumer awareness of the harmful effects of high sodium intake, and stringent regulations aiming to reduce sodium content in processed foods. Technological advancements, such as the development of improved sodium reduction solutions with enhanced taste and functionality, further fuel market growth. Moreover, growing investment in research and development and a greater emphasis on clean-label ingredients are driving innovation and expanding the product portfolio within the industry.
Challenges in the Sodium Reduction Ingredients Industry Market
Key challenges include maintaining taste and texture in sodium-reduced products while remaining cost-competitive. Supply chain disruptions and the volatility in raw material prices pose significant threats. Intense competition from both established players and new entrants adds pressure on margins and necessitates continuous innovation. Regulatory complexities, varying across different regions, present operational challenges and necessitate adaptations to local guidelines. The cost of implementing sodium reduction strategies can be substantial, particularly for small and medium-sized enterprises.
Emerging Opportunities in Sodium Reduction Ingredients Industry
Significant opportunities lie in the development of novel sodium reduction technologies that address issues around taste and texture. Strategic collaborations between ingredient suppliers and food manufacturers can accelerate product development and market penetration. Expansion into emerging markets with growing health awareness and increasing demand for healthier food options represents a vast untapped potential. Furthermore, the growing interest in clean-label ingredients and natural sodium alternatives presents considerable growth opportunities.
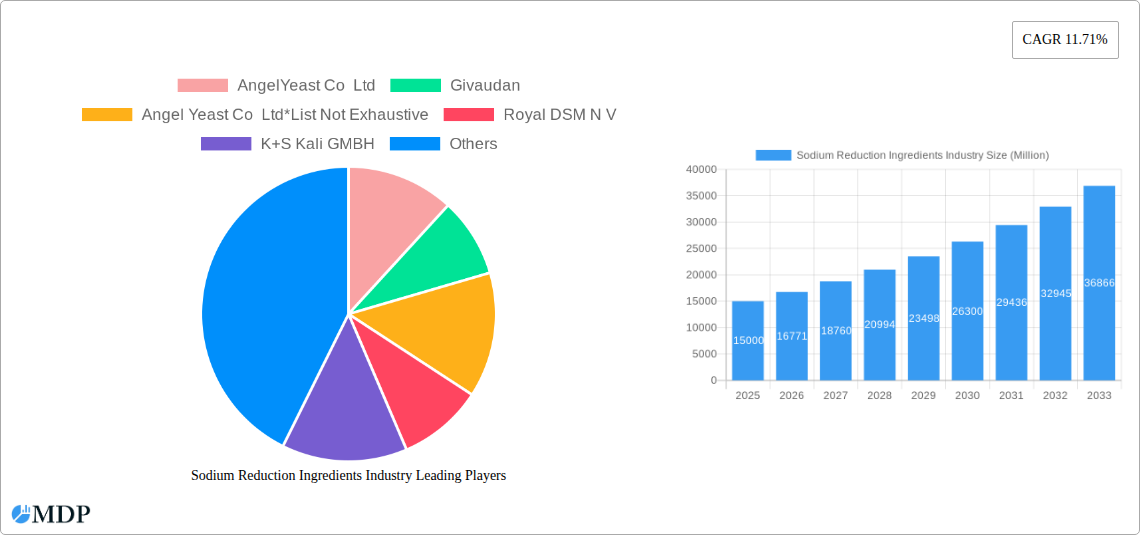
Leading Players in the Sodium Reduction Ingredients Industry Sector
- AngelYeast Co Ltd
- Givaudan
- Royal DSM N V
- K+S Kali GMBH
- Advanced Food Systems Inc
- Kerry Group Plc
- DuPont
- Dr Paul Lohmann GmbH & Co KGaA
- Cargill Inc
Key Milestones in Sodium Reduction Ingredients Industry Industry
- 2021: Cargill Salt launched a new purified sea salt flour, suitable for various blending applications.
- 2021: Tata Salt introduced India's first 30% low sodium salt – Tata Salt SuperLite.
- 2021: Food For Life launched three low-sodium products: Ezekiel 4:9 Low Sodium Sprouted Flourless English Muffins, Cereal, and Tortillas.
Strategic Outlook for Sodium Reduction Ingredients Industry Market
The Sodium Reduction Ingredients market is poised for sustained growth, driven by rising health consciousness and stricter regulations. Strategic partnerships and investments in research and development will play crucial roles in driving innovation and expanding market penetration. Companies focusing on developing clean-label, natural, and high-performing sodium reduction solutions are expected to capture significant market share. The increasing adoption of sodium reduction technologies across diverse food categories, coupled with expansion into emerging markets, positions this sector for considerable long-term growth.
Sodium Reduction Ingredients Industry Segmentation
-
1. Product Type
- 1.1. Amino Acids & Glutamates
-
1.2. Mineral Salts
- 1.2.1. Potassium Chloride
- 1.2.2. Magnesium Sulphate
- 1.2.3. Potassium Lactate
- 1.2.4. Calcium Chloride
- 1.3. Yeast Extracts
- 1.4. Others
-
2. Application
- 2.1. Bakery & Confectionery
- 2.2. Condiments, Seasonings & Sauces
- 2.3. Dairy & Frozen Foods
- 2.4. Meat & Meat Products
- 2.5. Snacks
- 2.6. Others
Sodium Reduction Ingredients Industry Segmentation By Geography
-
1. North America
- 1.1. United States
- 1.2. Canada
- 1.3. Mexico
- 1.4. Rest of North America
-
2. Europe
- 2.1. United Kingdom
- 2.2. Germany
- 2.3. France
- 2.4. Russia
- 2.5. Italy
- 2.6. Spain
- 2.7. Rest of Europe
-
3. Asia Pacific
- 3.1. India
- 3.2. China
- 3.3. Japan
- 3.4. Australia
- 3.5. Rest of Asia Pacific
-
4. South America
- 4.1. Brazil
- 4.2. Argentina
- 4.3. Rest of South America
-
5. Middle East and Africa
- 5.1. South Africa
- 5.2. Saudi Arabia
- 5.3. Rest of Middle East and Africa
Sodium Reduction Ingredients Industry REPORT HIGHLIGHTS
| Aspects | Details |
|---|---|
| Study Period | 2019-2033 |
| Base Year | 2024 |
| Estimated Year | 2025 |
| Forecast Period | 2025-2033 |
| Historical Period | 2019-2024 |
| Growth Rate | CAGR of 11.71% from 2019-2033 |
| Segmentation |
|
Table of Contents
- 1. Introduction
- 1.1. Research Scope
- 1.2. Market Segmentation
- 1.3. Research Methodology
- 1.4. Definitions and Assumptions
- 2. Executive Summary
- 2.1. Introduction
- 3. Market Dynamics
- 3.1. Introduction
- 3.2. Market Drivers
- 3.2.1. Increasing Focus on Maintaining Health and Well-Being; Launching Supplements For Specific Purposes and Targeted Population
- 3.3. Market Restrains
- 3.3.1. Supplement Consumption and Their Side-effects; Inclination Towards Substitute Products
- 3.4. Market Trends
- 3.4.1. Growing Consumer Awareness Toward High Sodium Intake
- 4. Market Factor Analysis
- 4.1. Porters Five Forces
- 4.2. Supply/Value Chain
- 4.3. PESTEL analysis
- 4.4. Market Entropy
- 4.5. Patent/Trademark Analysis
- 5. Global Sodium Reduction Ingredients Industry Analysis, Insights and Forecast, 2019-2031
- 5.1. Market Analysis, Insights and Forecast - by Product Type
- 5.1.1. Amino Acids & Glutamates
- 5.1.2. Mineral Salts
- 5.1.2.1. Potassium Chloride
- 5.1.2.2. Magnesium Sulphate
- 5.1.2.3. Potassium Lactate
- 5.1.2.4. Calcium Chloride
- 5.1.3. Yeast Extracts
- 5.1.4. Others
- 5.2. Market Analysis, Insights and Forecast - by Application
- 5.2.1. Bakery & Confectionery
- 5.2.2. Condiments, Seasonings & Sauces
- 5.2.3. Dairy & Frozen Foods
- 5.2.4. Meat & Meat Products
- 5.2.5. Snacks
- 5.2.6. Others
- 5.3. Market Analysis, Insights and Forecast - by Region
- 5.3.1. North America
- 5.3.2. Europe
- 5.3.3. Asia Pacific
- 5.3.4. South America
- 5.3.5. Middle East and Africa
- 5.1. Market Analysis, Insights and Forecast - by Product Type
- 6. North America Sodium Reduction Ingredients Industry Analysis, Insights and Forecast, 2019-2031
- 6.1. Market Analysis, Insights and Forecast - by Product Type
- 6.1.1. Amino Acids & Glutamates
- 6.1.2. Mineral Salts
- 6.1.2.1. Potassium Chloride
- 6.1.2.2. Magnesium Sulphate
- 6.1.2.3. Potassium Lactate
- 6.1.2.4. Calcium Chloride
- 6.1.3. Yeast Extracts
- 6.1.4. Others
- 6.2. Market Analysis, Insights and Forecast - by Application
- 6.2.1. Bakery & Confectionery
- 6.2.2. Condiments, Seasonings & Sauces
- 6.2.3. Dairy & Frozen Foods
- 6.2.4. Meat & Meat Products
- 6.2.5. Snacks
- 6.2.6. Others
- 6.1. Market Analysis, Insights and Forecast - by Product Type
- 7. Europe Sodium Reduction Ingredients Industry Analysis, Insights and Forecast, 2019-2031
- 7.1. Market Analysis, Insights and Forecast - by Product Type
- 7.1.1. Amino Acids & Glutamates
- 7.1.2. Mineral Salts
- 7.1.2.1. Potassium Chloride
- 7.1.2.2. Magnesium Sulphate
- 7.1.2.3. Potassium Lactate
- 7.1.2.4. Calcium Chloride
- 7.1.3. Yeast Extracts
- 7.1.4. Others
- 7.2. Market Analysis, Insights and Forecast - by Application
- 7.2.1. Bakery & Confectionery
- 7.2.2. Condiments, Seasonings & Sauces
- 7.2.3. Dairy & Frozen Foods
- 7.2.4. Meat & Meat Products
- 7.2.5. Snacks
- 7.2.6. Others
- 7.1. Market Analysis, Insights and Forecast - by Product Type
- 8. Asia Pacific Sodium Reduction Ingredients Industry Analysis, Insights and Forecast, 2019-2031
- 8.1. Market Analysis, Insights and Forecast - by Product Type
- 8.1.1. Amino Acids & Glutamates
- 8.1.2. Mineral Salts
- 8.1.2.1. Potassium Chloride
- 8.1.2.2. Magnesium Sulphate
- 8.1.2.3. Potassium Lactate
- 8.1.2.4. Calcium Chloride
- 8.1.3. Yeast Extracts
- 8.1.4. Others
- 8.2. Market Analysis, Insights and Forecast - by Application
- 8.2.1. Bakery & Confectionery
- 8.2.2. Condiments, Seasonings & Sauces
- 8.2.3. Dairy & Frozen Foods
- 8.2.4. Meat & Meat Products
- 8.2.5. Snacks
- 8.2.6. Others
- 8.1. Market Analysis, Insights and Forecast - by Product Type
- 9. South America Sodium Reduction Ingredients Industry Analysis, Insights and Forecast, 2019-2031
- 9.1. Market Analysis, Insights and Forecast - by Product Type
- 9.1.1. Amino Acids & Glutamates
- 9.1.2. Mineral Salts
- 9.1.2.1. Potassium Chloride
- 9.1.2.2. Magnesium Sulphate
- 9.1.2.3. Potassium Lactate
- 9.1.2.4. Calcium Chloride
- 9.1.3. Yeast Extracts
- 9.1.4. Others
- 9.2. Market Analysis, Insights and Forecast - by Application
- 9.2.1. Bakery & Confectionery
- 9.2.2. Condiments, Seasonings & Sauces
- 9.2.3. Dairy & Frozen Foods
- 9.2.4. Meat & Meat Products
- 9.2.5. Snacks
- 9.2.6. Others
- 9.1. Market Analysis, Insights and Forecast - by Product Type
- 10. Middle East and Africa Sodium Reduction Ingredients Industry Analysis, Insights and Forecast, 2019-2031
- 10.1. Market Analysis, Insights and Forecast - by Product Type
- 10.1.1. Amino Acids & Glutamates
- 10.1.2. Mineral Salts
- 10.1.2.1. Potassium Chloride
- 10.1.2.2. Magnesium Sulphate
- 10.1.2.3. Potassium Lactate
- 10.1.2.4. Calcium Chloride
- 10.1.3. Yeast Extracts
- 10.1.4. Others
- 10.2. Market Analysis, Insights and Forecast - by Application
- 10.2.1. Bakery & Confectionery
- 10.2.2. Condiments, Seasonings & Sauces
- 10.2.3. Dairy & Frozen Foods
- 10.2.4. Meat & Meat Products
- 10.2.5. Snacks
- 10.2.6. Others
- 10.1. Market Analysis, Insights and Forecast - by Product Type
- 11. North America Sodium Reduction Ingredients Industry Analysis, Insights and Forecast, 2019-2031
- 11.1. Market Analysis, Insights and Forecast - By Country/Sub-region
- 11.1.1 United States
- 11.1.2 Canada
- 11.1.3 Mexico
- 11.1.4 Rest of North America
- 12. Europe Sodium Reduction Ingredients Industry Analysis, Insights and Forecast, 2019-2031
- 12.1. Market Analysis, Insights and Forecast - By Country/Sub-region
- 12.1.1 United Kingdom
- 12.1.2 Germany
- 12.1.3 France
- 12.1.4 Russia
- 12.1.5 Italy
- 12.1.6 Spain
- 12.1.7 Rest of Europe
- 13. Asia Pacific Sodium Reduction Ingredients Industry Analysis, Insights and Forecast, 2019-2031
- 13.1. Market Analysis, Insights and Forecast - By Country/Sub-region
- 13.1.1 India
- 13.1.2 China
- 13.1.3 Japan
- 13.1.4 Australia
- 13.1.5 Rest of Asia Pacific
- 14. South America Sodium Reduction Ingredients Industry Analysis, Insights and Forecast, 2019-2031
- 14.1. Market Analysis, Insights and Forecast - By Country/Sub-region
- 14.1.1 Brazil
- 14.1.2 Argentina
- 14.1.3 Rest of South America
- 15. Middle East and Africa Sodium Reduction Ingredients Industry Analysis, Insights and Forecast, 2019-2031
- 15.1. Market Analysis, Insights and Forecast - By Country/Sub-region
- 15.1.1 South Africa
- 15.1.2 Saudi Arabia
- 15.1.3 Rest of Middle East and Africa
- 16. Competitive Analysis
- 16.1. Global Market Share Analysis 2024
- 16.2. Company Profiles
- 16.2.1 AngelYeast Co Ltd
- 16.2.1.1. Overview
- 16.2.1.2. Products
- 16.2.1.3. SWOT Analysis
- 16.2.1.4. Recent Developments
- 16.2.1.5. Financials (Based on Availability)
- 16.2.2 Givaudan
- 16.2.2.1. Overview
- 16.2.2.2. Products
- 16.2.2.3. SWOT Analysis
- 16.2.2.4. Recent Developments
- 16.2.2.5. Financials (Based on Availability)
- 16.2.3 Angel Yeast Co Ltd*List Not Exhaustive
- 16.2.3.1. Overview
- 16.2.3.2. Products
- 16.2.3.3. SWOT Analysis
- 16.2.3.4. Recent Developments
- 16.2.3.5. Financials (Based on Availability)
- 16.2.4 Royal DSM N V
- 16.2.4.1. Overview
- 16.2.4.2. Products
- 16.2.4.3. SWOT Analysis
- 16.2.4.4. Recent Developments
- 16.2.4.5. Financials (Based on Availability)
- 16.2.5 K+S Kali GMBH
- 16.2.5.1. Overview
- 16.2.5.2. Products
- 16.2.5.3. SWOT Analysis
- 16.2.5.4. Recent Developments
- 16.2.5.5. Financials (Based on Availability)
- 16.2.6 Advanced Food Systems Inc
- 16.2.6.1. Overview
- 16.2.6.2. Products
- 16.2.6.3. SWOT Analysis
- 16.2.6.4. Recent Developments
- 16.2.6.5. Financials (Based on Availability)
- 16.2.7 Kerry Group Plc
- 16.2.7.1. Overview
- 16.2.7.2. Products
- 16.2.7.3. SWOT Analysis
- 16.2.7.4. Recent Developments
- 16.2.7.5. Financials (Based on Availability)
- 16.2.8 DuPont
- 16.2.8.1. Overview
- 16.2.8.2. Products
- 16.2.8.3. SWOT Analysis
- 16.2.8.4. Recent Developments
- 16.2.8.5. Financials (Based on Availability)
- 16.2.9 Dr Paul Lohmann GmbH & Co KGaA
- 16.2.9.1. Overview
- 16.2.9.2. Products
- 16.2.9.3. SWOT Analysis
- 16.2.9.4. Recent Developments
- 16.2.9.5. Financials (Based on Availability)
- 16.2.10 Cargill Inc
- 16.2.10.1. Overview
- 16.2.10.2. Products
- 16.2.10.3. SWOT Analysis
- 16.2.10.4. Recent Developments
- 16.2.10.5. Financials (Based on Availability)
- 16.2.1 AngelYeast Co Ltd
List of Figures
- Figure 1: Global Sodium Reduction Ingredients Industry Revenue Breakdown (Million, %) by Region 2024 & 2032
- Figure 2: North America Sodium Reduction Ingredients Industry Revenue (Million), by Country 2024 & 2032
- Figure 3: North America Sodium Reduction Ingredients Industry Revenue Share (%), by Country 2024 & 2032
- Figure 4: Europe Sodium Reduction Ingredients Industry Revenue (Million), by Country 2024 & 2032
- Figure 5: Europe Sodium Reduction Ingredients Industry Revenue Share (%), by Country 2024 & 2032
- Figure 6: Asia Pacific Sodium Reduction Ingredients Industry Revenue (Million), by Country 2024 & 2032
- Figure 7: Asia Pacific Sodium Reduction Ingredients Industry Revenue Share (%), by Country 2024 & 2032
- Figure 8: South America Sodium Reduction Ingredients Industry Revenue (Million), by Country 2024 & 2032
- Figure 9: South America Sodium Reduction Ingredients Industry Revenue Share (%), by Country 2024 & 2032
- Figure 10: Middle East and Africa Sodium Reduction Ingredients Industry Revenue (Million), by Country 2024 & 2032
- Figure 11: Middle East and Africa Sodium Reduction Ingredients Industry Revenue Share (%), by Country 2024 & 2032
- Figure 12: North America Sodium Reduction Ingredients Industry Revenue (Million), by Product Type 2024 & 2032
- Figure 13: North America Sodium Reduction Ingredients Industry Revenue Share (%), by Product Type 2024 & 2032
- Figure 14: North America Sodium Reduction Ingredients Industry Revenue (Million), by Application 2024 & 2032
- Figure 15: North America Sodium Reduction Ingredients Industry Revenue Share (%), by Application 2024 & 2032
- Figure 16: North America Sodium Reduction Ingredients Industry Revenue (Million), by Country 2024 & 2032
- Figure 17: North America Sodium Reduction Ingredients Industry Revenue Share (%), by Country 2024 & 2032
- Figure 18: Europe Sodium Reduction Ingredients Industry Revenue (Million), by Product Type 2024 & 2032
- Figure 19: Europe Sodium Reduction Ingredients Industry Revenue Share (%), by Product Type 2024 & 2032
- Figure 20: Europe Sodium Reduction Ingredients Industry Revenue (Million), by Application 2024 & 2032
- Figure 21: Europe Sodium Reduction Ingredients Industry Revenue Share (%), by Application 2024 & 2032
- Figure 22: Europe Sodium Reduction Ingredients Industry Revenue (Million), by Country 2024 & 2032
- Figure 23: Europe Sodium Reduction Ingredients Industry Revenue Share (%), by Country 2024 & 2032
- Figure 24: Asia Pacific Sodium Reduction Ingredients Industry Revenue (Million), by Product Type 2024 & 2032
- Figure 25: Asia Pacific Sodium Reduction Ingredients Industry Revenue Share (%), by Product Type 2024 & 2032
- Figure 26: Asia Pacific Sodium Reduction Ingredients Industry Revenue (Million), by Application 2024 & 2032
- Figure 27: Asia Pacific Sodium Reduction Ingredients Industry Revenue Share (%), by Application 2024 & 2032
- Figure 28: Asia Pacific Sodium Reduction Ingredients Industry Revenue (Million), by Country 2024 & 2032
- Figure 29: Asia Pacific Sodium Reduction Ingredients Industry Revenue Share (%), by Country 2024 & 2032
- Figure 30: South America Sodium Reduction Ingredients Industry Revenue (Million), by Product Type 2024 & 2032
- Figure 31: South America Sodium Reduction Ingredients Industry Revenue Share (%), by Product Type 2024 & 2032
- Figure 32: South America Sodium Reduction Ingredients Industry Revenue (Million), by Application 2024 & 2032
- Figure 33: South America Sodium Reduction Ingredients Industry Revenue Share (%), by Application 2024 & 2032
- Figure 34: South America Sodium Reduction Ingredients Industry Revenue (Million), by Country 2024 & 2032
- Figure 35: South America Sodium Reduction Ingredients Industry Revenue Share (%), by Country 2024 & 2032
- Figure 36: Middle East and Africa Sodium Reduction Ingredients Industry Revenue (Million), by Product Type 2024 & 2032
- Figure 37: Middle East and Africa Sodium Reduction Ingredients Industry Revenue Share (%), by Product Type 2024 & 2032
- Figure 38: Middle East and Africa Sodium Reduction Ingredients Industry Revenue (Million), by Application 2024 & 2032
- Figure 39: Middle East and Africa Sodium Reduction Ingredients Industry Revenue Share (%), by Application 2024 & 2032
- Figure 40: Middle East and Africa Sodium Reduction Ingredients Industry Revenue (Million), by Country 2024 & 2032
- Figure 41: Middle East and Africa Sodium Reduction Ingredients Industry Revenue Share (%), by Country 2024 & 2032
List of Tables
- Table 1: Global Sodium Reduction Ingredients Industry Revenue Million Forecast, by Region 2019 & 2032
- Table 2: Global Sodium Reduction Ingredients Industry Revenue Million Forecast, by Product Type 2019 & 2032
- Table 3: Global Sodium Reduction Ingredients Industry Revenue Million Forecast, by Application 2019 & 2032
- Table 4: Global Sodium Reduction Ingredients Industry Revenue Million Forecast, by Region 2019 & 2032
- Table 5: Global Sodium Reduction Ingredients Industry Revenue Million Forecast, by Country 2019 & 2032
- Table 6: United States Sodium Reduction Ingredients Industry Revenue (Million) Forecast, by Application 2019 & 2032
- Table 7: Canada Sodium Reduction Ingredients Industry Revenue (Million) Forecast, by Application 2019 & 2032
- Table 8: Mexico Sodium Reduction Ingredients Industry Revenue (Million) Forecast, by Application 2019 & 2032
- Table 9: Rest of North America Sodium Reduction Ingredients Industry Revenue (Million) Forecast, by Application 2019 & 2032
- Table 10: Global Sodium Reduction Ingredients Industry Revenue Million Forecast, by Country 2019 & 2032
- Table 11: United Kingdom Sodium Reduction Ingredients Industry Revenue (Million) Forecast, by Application 2019 & 2032
- Table 12: Germany Sodium Reduction Ingredients Industry Revenue (Million) Forecast, by Application 2019 & 2032
- Table 13: France Sodium Reduction Ingredients Industry Revenue (Million) Forecast, by Application 2019 & 2032
- Table 14: Russia Sodium Reduction Ingredients Industry Revenue (Million) Forecast, by Application 2019 & 2032
- Table 15: Italy Sodium Reduction Ingredients Industry Revenue (Million) Forecast, by Application 2019 & 2032
- Table 16: Spain Sodium Reduction Ingredients Industry Revenue (Million) Forecast, by Application 2019 & 2032
- Table 17: Rest of Europe Sodium Reduction Ingredients Industry Revenue (Million) Forecast, by Application 2019 & 2032
- Table 18: Global Sodium Reduction Ingredients Industry Revenue Million Forecast, by Country 2019 & 2032
- Table 19: India Sodium Reduction Ingredients Industry Revenue (Million) Forecast, by Application 2019 & 2032
- Table 20: China Sodium Reduction Ingredients Industry Revenue (Million) Forecast, by Application 2019 & 2032
- Table 21: Japan Sodium Reduction Ingredients Industry Revenue (Million) Forecast, by Application 2019 & 2032
- Table 22: Australia Sodium Reduction Ingredients Industry Revenue (Million) Forecast, by Application 2019 & 2032
- Table 23: Rest of Asia Pacific Sodium Reduction Ingredients Industry Revenue (Million) Forecast, by Application 2019 & 2032
- Table 24: Global Sodium Reduction Ingredients Industry Revenue Million Forecast, by Country 2019 & 2032
- Table 25: Brazil Sodium Reduction Ingredients Industry Revenue (Million) Forecast, by Application 2019 & 2032
- Table 26: Argentina Sodium Reduction Ingredients Industry Revenue (Million) Forecast, by Application 2019 & 2032
- Table 27: Rest of South America Sodium Reduction Ingredients Industry Revenue (Million) Forecast, by Application 2019 & 2032
- Table 28: Global Sodium Reduction Ingredients Industry Revenue Million Forecast, by Country 2019 & 2032
- Table 29: South Africa Sodium Reduction Ingredients Industry Revenue (Million) Forecast, by Application 2019 & 2032
- Table 30: Saudi Arabia Sodium Reduction Ingredients Industry Revenue (Million) Forecast, by Application 2019 & 2032
- Table 31: Rest of Middle East and Africa Sodium Reduction Ingredients Industry Revenue (Million) Forecast, by Application 2019 & 2032
- Table 32: Global Sodium Reduction Ingredients Industry Revenue Million Forecast, by Product Type 2019 & 2032
- Table 33: Global Sodium Reduction Ingredients Industry Revenue Million Forecast, by Application 2019 & 2032
- Table 34: Global Sodium Reduction Ingredients Industry Revenue Million Forecast, by Country 2019 & 2032
- Table 35: United States Sodium Reduction Ingredients Industry Revenue (Million) Forecast, by Application 2019 & 2032
- Table 36: Canada Sodium Reduction Ingredients Industry Revenue (Million) Forecast, by Application 2019 & 2032
- Table 37: Mexico Sodium Reduction Ingredients Industry Revenue (Million) Forecast, by Application 2019 & 2032
- Table 38: Rest of North America Sodium Reduction Ingredients Industry Revenue (Million) Forecast, by Application 2019 & 2032
- Table 39: Global Sodium Reduction Ingredients Industry Revenue Million Forecast, by Product Type 2019 & 2032
- Table 40: Global Sodium Reduction Ingredients Industry Revenue Million Forecast, by Application 2019 & 2032
- Table 41: Global Sodium Reduction Ingredients Industry Revenue Million Forecast, by Country 2019 & 2032
- Table 42: United Kingdom Sodium Reduction Ingredients Industry Revenue (Million) Forecast, by Application 2019 & 2032
- Table 43: Germany Sodium Reduction Ingredients Industry Revenue (Million) Forecast, by Application 2019 & 2032
- Table 44: France Sodium Reduction Ingredients Industry Revenue (Million) Forecast, by Application 2019 & 2032
- Table 45: Russia Sodium Reduction Ingredients Industry Revenue (Million) Forecast, by Application 2019 & 2032
- Table 46: Italy Sodium Reduction Ingredients Industry Revenue (Million) Forecast, by Application 2019 & 2032
- Table 47: Spain Sodium Reduction Ingredients Industry Revenue (Million) Forecast, by Application 2019 & 2032
- Table 48: Rest of Europe Sodium Reduction Ingredients Industry Revenue (Million) Forecast, by Application 2019 & 2032
- Table 49: Global Sodium Reduction Ingredients Industry Revenue Million Forecast, by Product Type 2019 & 2032
- Table 50: Global Sodium Reduction Ingredients Industry Revenue Million Forecast, by Application 2019 & 2032
- Table 51: Global Sodium Reduction Ingredients Industry Revenue Million Forecast, by Country 2019 & 2032
- Table 52: India Sodium Reduction Ingredients Industry Revenue (Million) Forecast, by Application 2019 & 2032
- Table 53: China Sodium Reduction Ingredients Industry Revenue (Million) Forecast, by Application 2019 & 2032
- Table 54: Japan Sodium Reduction Ingredients Industry Revenue (Million) Forecast, by Application 2019 & 2032
- Table 55: Australia Sodium Reduction Ingredients Industry Revenue (Million) Forecast, by Application 2019 & 2032
- Table 56: Rest of Asia Pacific Sodium Reduction Ingredients Industry Revenue (Million) Forecast, by Application 2019 & 2032
- Table 57: Global Sodium Reduction Ingredients Industry Revenue Million Forecast, by Product Type 2019 & 2032
- Table 58: Global Sodium Reduction Ingredients Industry Revenue Million Forecast, by Application 2019 & 2032
- Table 59: Global Sodium Reduction Ingredients Industry Revenue Million Forecast, by Country 2019 & 2032
- Table 60: Brazil Sodium Reduction Ingredients Industry Revenue (Million) Forecast, by Application 2019 & 2032
- Table 61: Argentina Sodium Reduction Ingredients Industry Revenue (Million) Forecast, by Application 2019 & 2032
- Table 62: Rest of South America Sodium Reduction Ingredients Industry Revenue (Million) Forecast, by Application 2019 & 2032
- Table 63: Global Sodium Reduction Ingredients Industry Revenue Million Forecast, by Product Type 2019 & 2032
- Table 64: Global Sodium Reduction Ingredients Industry Revenue Million Forecast, by Application 2019 & 2032
- Table 65: Global Sodium Reduction Ingredients Industry Revenue Million Forecast, by Country 2019 & 2032
- Table 66: South Africa Sodium Reduction Ingredients Industry Revenue (Million) Forecast, by Application 2019 & 2032
- Table 67: Saudi Arabia Sodium Reduction Ingredients Industry Revenue (Million) Forecast, by Application 2019 & 2032
- Table 68: Rest of Middle East and Africa Sodium Reduction Ingredients Industry Revenue (Million) Forecast, by Application 2019 & 2032
Frequently Asked Questions
1. What is the projected Compound Annual Growth Rate (CAGR) of the Sodium Reduction Ingredients Industry?
The projected CAGR is approximately 11.71%.
2. Which companies are prominent players in the Sodium Reduction Ingredients Industry?
Key companies in the market include AngelYeast Co Ltd, Givaudan, Angel Yeast Co Ltd*List Not Exhaustive, Royal DSM N V, K+S Kali GMBH, Advanced Food Systems Inc, Kerry Group Plc, DuPont, Dr Paul Lohmann GmbH & Co KGaA, Cargill Inc.
3. What are the main segments of the Sodium Reduction Ingredients Industry?
The market segments include Product Type, Application.
4. Can you provide details about the market size?
The market size is estimated to be USD XX Million as of 2022.
5. What are some drivers contributing to market growth?
Increasing Focus on Maintaining Health and Well-Being; Launching Supplements For Specific Purposes and Targeted Population.
6. What are the notable trends driving market growth?
Growing Consumer Awareness Toward High Sodium Intake.
7. Are there any restraints impacting market growth?
Supplement Consumption and Their Side-effects; Inclination Towards Substitute Products.
8. Can you provide examples of recent developments in the market?
In 2021, Cargill Salt launched a new purified sea salt flour. The ingredient is a unique type of ultra-fine cut, powder-like sodium chloride. It is suitable for blending applications that require perfect sizing, including dry soup, cereal, flour, spice mixes, and topping snack foods.
9. What pricing options are available for accessing the report?
Pricing options include single-user, multi-user, and enterprise licenses priced at USD 4750, USD 5250, and USD 8750 respectively.
10. Is the market size provided in terms of value or volume?
The market size is provided in terms of value, measured in Million.
11. Are there any specific market keywords associated with the report?
Yes, the market keyword associated with the report is "Sodium Reduction Ingredients Industry," which aids in identifying and referencing the specific market segment covered.
12. How do I determine which pricing option suits my needs best?
The pricing options vary based on user requirements and access needs. Individual users may opt for single-user licenses, while businesses requiring broader access may choose multi-user or enterprise licenses for cost-effective access to the report.
13. Are there any additional resources or data provided in the Sodium Reduction Ingredients Industry report?
While the report offers comprehensive insights, it's advisable to review the specific contents or supplementary materials provided to ascertain if additional resources or data are available.
14. How can I stay updated on further developments or reports in the Sodium Reduction Ingredients Industry?
To stay informed about further developments, trends, and reports in the Sodium Reduction Ingredients Industry, consider subscribing to industry newsletters, following relevant companies and organizations, or regularly checking reputable industry news sources and publications.
Methodology
Step 1 - Identification of Relevant Samples Size from Population Database


Step 2 - Approaches for Defining Global Market Size (Value, Volume* & Price*)

Note*: In applicable scenarios
Step 3 - Data Sources
Primary Research
- Web Analytics
- Survey Reports
- Research Institute
- Latest Research Reports
- Opinion Leaders
Secondary Research
- Annual Reports
- White Paper
- Latest Press Release
- Industry Association
- Paid Database
- Investor Presentations

Step 4 - Data Triangulation
Involves using different sources of information in order to increase the validity of a study
These sources are likely to be stakeholders in a program - participants, other researchers, program staff, other community members, and so on.
Then we put all data in single framework & apply various statistical tools to find out the dynamic on the market.
During the analysis stage, feedback from the stakeholder groups would be compared to determine areas of agreement as well as areas of divergence
