

Key Insights
The SNP genotyping market is experiencing robust growth, driven by the increasing application of pharmacogenomics and diagnostics. The market's Compound Annual Growth Rate (CAGR) of 21% from 2019-2033 signifies a significant expansion, fueled by advancements in technologies like TaqMan SNP genotyping, MassARRAY SNP genotyping, and SNP GeneChip arrays. Pharmacogenomics, which tailors drug treatments based on an individual's genetic makeup, is a major driver, enabling personalized medicine and improving treatment efficacy and safety. Similarly, the diagnostic field benefits greatly from SNP genotyping's ability to identify genetic variations associated with various diseases, facilitating early diagnosis and improved patient outcomes. The North American market, particularly the United States, currently holds a significant share due to advanced healthcare infrastructure and high adoption rates of advanced technologies. However, the Asia-Pacific region is projected to witness substantial growth over the forecast period, fueled by increasing healthcare expenditure and rising awareness of genetic testing. Competition among major players like Illumina, Thermo Fisher Scientific, and Agilent Technologies is intense, driving innovation and enhancing technological advancements. While challenges remain, including the high cost of testing and regulatory hurdles, the overall market outlook for SNP genotyping remains positive, with substantial growth expected in the coming years. Market segmentation by technology and end-user further reveals specific opportunities for companies to tailor their strategies and capitalize on the expanding market. The continued integration of SNP genotyping into routine healthcare practices is a key factor contributing to its long-term growth trajectory.
The market segmentation offers opportunities for focused growth strategies. For instance, the "Other Technologies" segment might benefit from disruptive innovations, while specific end-user applications, such as infectious disease diagnostics, might experience faster growth than others within the diagnostic field. The regional landscape reveals opportunities in emerging markets in Asia-Pacific, where increased investment in healthcare infrastructure and expanding awareness are expected to drive market expansion. The competitive landscape, populated by well-established players, indicates a continued need for innovation, strategic partnerships, and product diversification to maintain a strong market position. Understanding these nuances is crucial for businesses looking to participate in and capitalize on the flourishing SNP genotyping market.
SNP Genotyping Market: A Comprehensive Report (2019-2033)
This in-depth report provides a comprehensive analysis of the SNP Genotyping Market, covering market dynamics, industry trends, leading segments, key players, and future opportunities. The study period spans from 2019 to 2033, with 2025 as the base and estimated year. This report is invaluable for industry stakeholders, investors, and researchers seeking actionable insights into this rapidly evolving market. The global SNP Genotyping market is projected to reach xx Million by 2033, exhibiting a CAGR of xx% during the forecast period (2025-2033).
SNP Genotyping Market Market Dynamics & Concentration
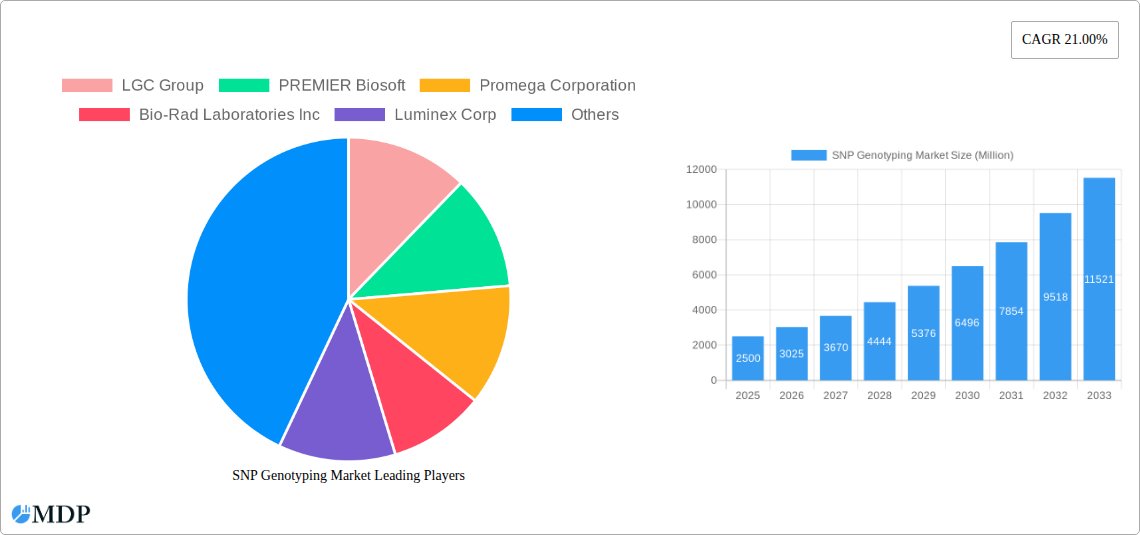
The SNP Genotyping market is characterized by a moderately consolidated landscape, with several key players holding significant market share. The market concentration is influenced by factors such as technological advancements, regulatory approvals, and the increasing demand for personalized medicine. While established players like Illumina and Thermo Fisher Scientific hold considerable sway, the market also witnesses the emergence of smaller companies specializing in niche technologies or applications.
Market Share: Illumina and Thermo Fisher Scientific collectively hold an estimated xx% of the market share in 2025, followed by Agilent Technologies and Bio-Rad Laboratories with xx% and xx% respectively. The remaining market share is distributed among other players, with smaller companies focusing on specific technologies or regional markets.
Innovation Drivers: Continuous technological advancements in sequencing technologies, including next-generation sequencing (NGS), are major drivers of innovation. These improvements lead to higher throughput, reduced costs, and enhanced accuracy, fueling market growth.
Regulatory Frameworks: Stringent regulatory approvals for diagnostic applications and personalized medicine initiatives influence market dynamics. Compliance with regulations like FDA approvals in the US and CE marking in Europe is crucial for market entry and success.
Product Substitutes: While SNP genotyping remains the primary technique, alternative technologies such as whole-genome sequencing offer broader information. However, the cost-effectiveness and targeted approach of SNP genotyping maintain its relevance in many applications.
End-User Trends: The increasing adoption of personalized medicine and pharmacogenomics, driven by advancements in genomics research, is boosting the demand for SNP genotyping services. The diagnostic field remains a major end-user segment.
M&A Activities: The past five years (2019-2024) have witnessed xx M&A deals in the SNP genotyping market. These activities are primarily driven by companies seeking to expand their product portfolio, technological capabilities, and market reach.
SNP Genotyping Market Industry Trends & Analysis
The SNP Genotyping market is experiencing significant growth fueled by several key factors. The increasing adoption of personalized medicine and pharmacogenomics is a primary driver, as SNP genotyping plays a crucial role in tailoring drug treatment based on an individual's genetic makeup. Advancements in sequencing technologies, such as next-generation sequencing (NGS), are also contributing to market expansion by increasing throughput, reducing costs, and improving accuracy. Furthermore, the growing prevalence of chronic diseases and the need for early diagnosis and treatment are bolstering the demand for SNP genotyping assays.
The market is witnessing a shift toward high-throughput platforms and automated systems to streamline workflows and increase efficiency. The rise of point-of-care diagnostics and decentralized testing is also creating new opportunities in remote areas and underserved communities. Competitive dynamics are characterized by continuous innovation, strategic partnerships, and acquisitions. Companies are focused on developing novel assays, expanding their product portfolios, and improving the accessibility and affordability of SNP genotyping technologies. The market penetration of SNP genotyping in various applications is steadily increasing, driven by technological advancements, growing awareness, and increasing affordability.

Leading Markets & Segments in SNP Genotyping Market
The North American region currently dominates the SNP Genotyping market, driven by strong research funding, advanced healthcare infrastructure, and the early adoption of new technologies. Europe follows as a significant market, with increasing investment in genomics research and healthcare initiatives. The Asia-Pacific region is expected to witness substantial growth in the coming years due to rising healthcare expenditure and growing awareness about personalized medicine.
Technology Segments:
- TaqMan SNP Genotyping: Remains a dominant technology due to its reliability, ease of use, and established market presence.
- MassARRAY SNP Genotyping: Offers high throughput and flexibility, making it suitable for large-scale studies.
- SNP GeneChip Arrays: A mature technology with established applications in various fields.
- Other Technologies: This segment encompasses emerging technologies that may gain traction in the future.
End-User Segments:
- Pharmacogenomics: This segment is experiencing rapid growth driven by the increasing need for personalized medicine and drug development.
- Diagnostic Field: This segment represents a significant portion of the market, driven by applications in infectious disease diagnosis and genetic testing.
Key Drivers for Dominant Regions/Segments:
- North America: Robust funding for genomic research, strong healthcare infrastructure, and early adoption of new technologies.
- Europe: Increasing investment in personalized medicine initiatives and growing awareness of genetic testing.
- Pharmacogenomics Segment: Rising demand for personalized medicine and the need to optimize drug efficacy and minimize adverse effects.
- Diagnostic Field Segment: Increasing prevalence of chronic diseases and the need for accurate and rapid diagnostics.
SNP Genotyping Market Product Developments
Recent product innovations in the SNP genotyping market focus on enhancing throughput, reducing costs, and improving the accuracy and speed of assays. The integration of advanced technologies like NGS and microfluidic systems is leading to miniaturized, portable, and high-throughput genotyping platforms. These developments are improving the accessibility and affordability of SNP genotyping for various applications, including clinical diagnostics, agricultural biotechnology, and forensic science. The market is also seeing increased adoption of software and analytical tools for data interpretation and management.
Key Drivers of SNP Genotyping Market Growth
The SNP genotyping market is experiencing robust growth propelled by several key factors. The increasing adoption of personalized medicine and pharmacogenomics necessitates accurate and efficient genotyping methods. Technological advancements in NGS and microfluidic technologies are leading to higher throughput, lower costs, and improved accuracy. Government initiatives promoting genomic research and healthcare infrastructure development are also driving market growth. The rising prevalence of chronic diseases and the need for early and accurate diagnosis further fuels market expansion.
Challenges in the SNP Genotyping Market Market
The SNP genotyping market faces certain challenges, including stringent regulatory approvals for diagnostic applications, which can delay product launches and increase costs. Supply chain disruptions, particularly concerning reagents and consumables, can impact market stability and availability. The competitive landscape, with established players and new entrants, necessitates continuous innovation and strategic partnerships to maintain market share and profitability. The high cost of advanced technologies and the need for specialized expertise can limit the accessibility of SNP genotyping in certain settings.
Emerging Opportunities in SNP Genotyping Market
The SNP genotyping market presents exciting opportunities for future growth. Continued technological advancements, including the development of more sensitive, cost-effective, and rapid genotyping assays, will drive market expansion. Strategic partnerships between technology providers, research institutions, and healthcare organizations will facilitate the development and adoption of new applications. The growing interest in personalized medicine and pharmacogenomics, along with expanding healthcare infrastructure in emerging economies, will open up new markets and applications for SNP genotyping.
Leading Players in the SNP Genotyping Market Sector
- LGC Group
- PREMIER Biosoft
- Promega Corporation
- Bio-Rad Laboratories Inc
- Luminex Corp
- Douglas Scientific LLC
- Danaher Corporation
- Agilent Technologies Inc
- Thermo Fischer Scientific Inc
- Life Technologies Corp
- Illumina Inc
- Sequenom
- Fluidigm Corporation
Key Milestones in SNP Genotyping Market Industry
- February 2021: Novacyt launched its SNPsig portfolio of PCR genotyping assays for SARS-CoV-2 variant diagnosis. This expanded the diagnostic capabilities and increased market competition.
- August 2021: Thermo Fisher Scientific expanded its production capacity and updated its TaqMan SARS-CoV-2 mutation panel to diagnose Delta and Lambda strains. This enhanced diagnostic capabilities and strengthened their market position.
Strategic Outlook for SNP Genotyping Market Market
The SNP Genotyping market is poised for continued growth, driven by technological advancements, increasing demand for personalized medicine, and expanding healthcare infrastructure globally. Strategic partnerships and acquisitions will play a significant role in shaping the market landscape. Companies focusing on developing innovative assays, improving data analysis tools, and expanding their market reach will be well-positioned to capitalize on emerging opportunities. The focus will increasingly be on developing more accessible, affordable, and user-friendly SNP genotyping technologies to cater to diverse applications and user needs.
SNP Genotyping Market Segmentation
-
1. Technology
- 1.1. TaqMan SNP Genotyping
- 1.2. Massarray SNP Genotyping
- 1.3. SNP GeneChip Arrays
- 1.4. Other Technologies
-
2. End User
- 2.1. Pharmacogenomics
- 2.2. Diagnostic Field
SNP Genotyping Market Segmentation By Geography
-
1. North America
- 1.1. United States
- 1.2. Canada
- 1.3. Mexico
-
2. Europe
- 2.1. Germany
- 2.2. United Kingdom
- 2.3. France
- 2.4. Italy
- 2.5. Spain
- 2.6. Rest of Europe
-
3. Asia Pacific
- 3.1. China
- 3.2. Japan
- 3.3. India
- 3.4. Australia
- 3.5. South Korea
- 3.6. Rest of Asia Pacific
-
4. Middle East and Africa
- 4.1. GCC
- 4.2. South Africa
- 4.3. Rest of Middle East and Africa
-
5. South America
- 5.1. Brazil
- 5.2. Argentina
- 5.3. Rest of South America

SNP Genotyping Market REPORT HIGHLIGHTS
| Aspects | Details |
|---|---|
| Study Period | 2019-2033 |
| Base Year | 2024 |
| Estimated Year | 2025 |
| Forecast Period | 2025-2033 |
| Historical Period | 2019-2024 |
| Growth Rate | CAGR of 21.00% from 2019-2033 |
| Segmentation |
|
Table of Contents
- 1. Introduction
- 1.1. Research Scope
- 1.2. Market Segmentation
- 1.3. Research Methodology
- 1.4. Definitions and Assumptions
- 2. Executive Summary
- 2.1. Introduction
- 3. Market Dynamics
- 3.1. Introduction
- 3.2. Market Drivers
- 3.2.1. Miniaturisation of Equipment and Instruments; Increased Multiplexing Capacity Leading to Increased Application
- 3.3. Market Restrains
- 3.3.1. Lack of Standardisation in SNP Processes; Privacy Concerns Pose a Threat to Broad Technology Adoption
- 3.4. Market Trends
- 3.4.1. Pharmacogenomics Segment Expected to Witness High Growth Over the Forecast Period
- 4. Market Factor Analysis
- 4.1. Porters Five Forces
- 4.2. Supply/Value Chain
- 4.3. PESTEL analysis
- 4.4. Market Entropy
- 4.5. Patent/Trademark Analysis
- 5. Global SNP Genotyping Market Analysis, Insights and Forecast, 2019-2031
- 5.1. Market Analysis, Insights and Forecast - by Technology
- 5.1.1. TaqMan SNP Genotyping
- 5.1.2. Massarray SNP Genotyping
- 5.1.3. SNP GeneChip Arrays
- 5.1.4. Other Technologies
- 5.2. Market Analysis, Insights and Forecast - by End User
- 5.2.1. Pharmacogenomics
- 5.2.2. Diagnostic Field
- 5.3. Market Analysis, Insights and Forecast - by Region
- 5.3.1. North America
- 5.3.2. Europe
- 5.3.3. Asia Pacific
- 5.3.4. Middle East and Africa
- 5.3.5. South America
- 5.1. Market Analysis, Insights and Forecast - by Technology
- 6. North America SNP Genotyping Market Analysis, Insights and Forecast, 2019-2031
- 6.1. Market Analysis, Insights and Forecast - by Technology
- 6.1.1. TaqMan SNP Genotyping
- 6.1.2. Massarray SNP Genotyping
- 6.1.3. SNP GeneChip Arrays
- 6.1.4. Other Technologies
- 6.2. Market Analysis, Insights and Forecast - by End User
- 6.2.1. Pharmacogenomics
- 6.2.2. Diagnostic Field
- 6.1. Market Analysis, Insights and Forecast - by Technology
- 7. Europe SNP Genotyping Market Analysis, Insights and Forecast, 2019-2031
- 7.1. Market Analysis, Insights and Forecast - by Technology
- 7.1.1. TaqMan SNP Genotyping
- 7.1.2. Massarray SNP Genotyping
- 7.1.3. SNP GeneChip Arrays
- 7.1.4. Other Technologies
- 7.2. Market Analysis, Insights and Forecast - by End User
- 7.2.1. Pharmacogenomics
- 7.2.2. Diagnostic Field
- 7.1. Market Analysis, Insights and Forecast - by Technology
- 8. Asia Pacific SNP Genotyping Market Analysis, Insights and Forecast, 2019-2031
- 8.1. Market Analysis, Insights and Forecast - by Technology
- 8.1.1. TaqMan SNP Genotyping
- 8.1.2. Massarray SNP Genotyping
- 8.1.3. SNP GeneChip Arrays
- 8.1.4. Other Technologies
- 8.2. Market Analysis, Insights and Forecast - by End User
- 8.2.1. Pharmacogenomics
- 8.2.2. Diagnostic Field
- 8.1. Market Analysis, Insights and Forecast - by Technology
- 9. Middle East and Africa SNP Genotyping Market Analysis, Insights and Forecast, 2019-2031
- 9.1. Market Analysis, Insights and Forecast - by Technology
- 9.1.1. TaqMan SNP Genotyping
- 9.1.2. Massarray SNP Genotyping
- 9.1.3. SNP GeneChip Arrays
- 9.1.4. Other Technologies
- 9.2. Market Analysis, Insights and Forecast - by End User
- 9.2.1. Pharmacogenomics
- 9.2.2. Diagnostic Field
- 9.1. Market Analysis, Insights and Forecast - by Technology
- 10. South America SNP Genotyping Market Analysis, Insights and Forecast, 2019-2031
- 10.1. Market Analysis, Insights and Forecast - by Technology
- 10.1.1. TaqMan SNP Genotyping
- 10.1.2. Massarray SNP Genotyping
- 10.1.3. SNP GeneChip Arrays
- 10.1.4. Other Technologies
- 10.2. Market Analysis, Insights and Forecast - by End User
- 10.2.1. Pharmacogenomics
- 10.2.2. Diagnostic Field
- 10.1. Market Analysis, Insights and Forecast - by Technology
- 11. North America SNP Genotyping Market Analysis, Insights and Forecast, 2019-2031
- 11.1. Market Analysis, Insights and Forecast - By Country/Sub-region
- 11.1.1 United States
- 11.1.2 Canada
- 11.1.3 Mexico
- 12. Europe SNP Genotyping Market Analysis, Insights and Forecast, 2019-2031
- 12.1. Market Analysis, Insights and Forecast - By Country/Sub-region
- 12.1.1 Germany
- 12.1.2 United Kingdom
- 12.1.3 France
- 12.1.4 Italy
- 12.1.5 Spain
- 12.1.6 Rest of Europe
- 13. Asia Pacific SNP Genotyping Market Analysis, Insights and Forecast, 2019-2031
- 13.1. Market Analysis, Insights and Forecast - By Country/Sub-region
- 13.1.1 China
- 13.1.2 Japan
- 13.1.3 India
- 13.1.4 Australia
- 13.1.5 South Korea
- 13.1.6 Rest of Asia Pacific
- 14. Middle East and Africa SNP Genotyping Market Analysis, Insights and Forecast, 2019-2031
- 14.1. Market Analysis, Insights and Forecast - By Country/Sub-region
- 14.1.1 GCC
- 14.1.2 South Africa
- 14.1.3 Rest of Middle East and Africa
- 15. South America SNP Genotyping Market Analysis, Insights and Forecast, 2019-2031
- 15.1. Market Analysis, Insights and Forecast - By Country/Sub-region
- 15.1.1 Brazil
- 15.1.2 Argentina
- 15.1.3 Rest of South America
- 16. Competitive Analysis
- 16.1. Global Market Share Analysis 2024
- 16.2. Company Profiles
- 16.2.1 LGC Group
- 16.2.1.1. Overview
- 16.2.1.2. Products
- 16.2.1.3. SWOT Analysis
- 16.2.1.4. Recent Developments
- 16.2.1.5. Financials (Based on Availability)
- 16.2.2 PREMIER Biosoft
- 16.2.2.1. Overview
- 16.2.2.2. Products
- 16.2.2.3. SWOT Analysis
- 16.2.2.4. Recent Developments
- 16.2.2.5. Financials (Based on Availability)
- 16.2.3 Promega Corporation
- 16.2.3.1. Overview
- 16.2.3.2. Products
- 16.2.3.3. SWOT Analysis
- 16.2.3.4. Recent Developments
- 16.2.3.5. Financials (Based on Availability)
- 16.2.4 Bio-Rad Laboratories Inc
- 16.2.4.1. Overview
- 16.2.4.2. Products
- 16.2.4.3. SWOT Analysis
- 16.2.4.4. Recent Developments
- 16.2.4.5. Financials (Based on Availability)
- 16.2.5 Luminex Corp
- 16.2.5.1. Overview
- 16.2.5.2. Products
- 16.2.5.3. SWOT Analysis
- 16.2.5.4. Recent Developments
- 16.2.5.5. Financials (Based on Availability)
- 16.2.6 Douglas Scientific LLC
- 16.2.6.1. Overview
- 16.2.6.2. Products
- 16.2.6.3. SWOT Analysis
- 16.2.6.4. Recent Developments
- 16.2.6.5. Financials (Based on Availability)
- 16.2.7 Danaher Corporation
- 16.2.7.1. Overview
- 16.2.7.2. Products
- 16.2.7.3. SWOT Analysis
- 16.2.7.4. Recent Developments
- 16.2.7.5. Financials (Based on Availability)
- 16.2.8 Agilent Technologies Inc
- 16.2.8.1. Overview
- 16.2.8.2. Products
- 16.2.8.3. SWOT Analysis
- 16.2.8.4. Recent Developments
- 16.2.8.5. Financials (Based on Availability)
- 16.2.9 Thermo Fischer Scientific Inc
- 16.2.9.1. Overview
- 16.2.9.2. Products
- 16.2.9.3. SWOT Analysis
- 16.2.9.4. Recent Developments
- 16.2.9.5. Financials (Based on Availability)
- 16.2.10 Life Technologies Corp
- 16.2.10.1. Overview
- 16.2.10.2. Products
- 16.2.10.3. SWOT Analysis
- 16.2.10.4. Recent Developments
- 16.2.10.5. Financials (Based on Availability)
- 16.2.11 Illumina Inc
- 16.2.11.1. Overview
- 16.2.11.2. Products
- 16.2.11.3. SWOT Analysis
- 16.2.11.4. Recent Developments
- 16.2.11.5. Financials (Based on Availability)
- 16.2.12 Sequenom
- 16.2.12.1. Overview
- 16.2.12.2. Products
- 16.2.12.3. SWOT Analysis
- 16.2.12.4. Recent Developments
- 16.2.12.5. Financials (Based on Availability)
- 16.2.13 Fluidigm Corporation
- 16.2.13.1. Overview
- 16.2.13.2. Products
- 16.2.13.3. SWOT Analysis
- 16.2.13.4. Recent Developments
- 16.2.13.5. Financials (Based on Availability)
- 16.2.1 LGC Group
List of Figures
- Figure 1: Global SNP Genotyping Market Revenue Breakdown (Million, %) by Region 2024 & 2032
- Figure 2: Global SNP Genotyping Market Volume Breakdown (K Unit, %) by Region 2024 & 2032
- Figure 3: North America SNP Genotyping Market Revenue (Million), by Country 2024 & 2032
- Figure 4: North America SNP Genotyping Market Volume (K Unit), by Country 2024 & 2032
- Figure 5: North America SNP Genotyping Market Revenue Share (%), by Country 2024 & 2032
- Figure 6: North America SNP Genotyping Market Volume Share (%), by Country 2024 & 2032
- Figure 7: Europe SNP Genotyping Market Revenue (Million), by Country 2024 & 2032
- Figure 8: Europe SNP Genotyping Market Volume (K Unit), by Country 2024 & 2032
- Figure 9: Europe SNP Genotyping Market Revenue Share (%), by Country 2024 & 2032
- Figure 10: Europe SNP Genotyping Market Volume Share (%), by Country 2024 & 2032
- Figure 11: Asia Pacific SNP Genotyping Market Revenue (Million), by Country 2024 & 2032
- Figure 12: Asia Pacific SNP Genotyping Market Volume (K Unit), by Country 2024 & 2032
- Figure 13: Asia Pacific SNP Genotyping Market Revenue Share (%), by Country 2024 & 2032
- Figure 14: Asia Pacific SNP Genotyping Market Volume Share (%), by Country 2024 & 2032
- Figure 15: Middle East and Africa SNP Genotyping Market Revenue (Million), by Country 2024 & 2032
- Figure 16: Middle East and Africa SNP Genotyping Market Volume (K Unit), by Country 2024 & 2032
- Figure 17: Middle East and Africa SNP Genotyping Market Revenue Share (%), by Country 2024 & 2032
- Figure 18: Middle East and Africa SNP Genotyping Market Volume Share (%), by Country 2024 & 2032
- Figure 19: South America SNP Genotyping Market Revenue (Million), by Country 2024 & 2032
- Figure 20: South America SNP Genotyping Market Volume (K Unit), by Country 2024 & 2032
- Figure 21: South America SNP Genotyping Market Revenue Share (%), by Country 2024 & 2032
- Figure 22: South America SNP Genotyping Market Volume Share (%), by Country 2024 & 2032
- Figure 23: North America SNP Genotyping Market Revenue (Million), by Technology 2024 & 2032
- Figure 24: North America SNP Genotyping Market Volume (K Unit), by Technology 2024 & 2032
- Figure 25: North America SNP Genotyping Market Revenue Share (%), by Technology 2024 & 2032
- Figure 26: North America SNP Genotyping Market Volume Share (%), by Technology 2024 & 2032
- Figure 27: North America SNP Genotyping Market Revenue (Million), by End User 2024 & 2032
- Figure 28: North America SNP Genotyping Market Volume (K Unit), by End User 2024 & 2032
- Figure 29: North America SNP Genotyping Market Revenue Share (%), by End User 2024 & 2032
- Figure 30: North America SNP Genotyping Market Volume Share (%), by End User 2024 & 2032
- Figure 31: North America SNP Genotyping Market Revenue (Million), by Country 2024 & 2032
- Figure 32: North America SNP Genotyping Market Volume (K Unit), by Country 2024 & 2032
- Figure 33: North America SNP Genotyping Market Revenue Share (%), by Country 2024 & 2032
- Figure 34: North America SNP Genotyping Market Volume Share (%), by Country 2024 & 2032
- Figure 35: Europe SNP Genotyping Market Revenue (Million), by Technology 2024 & 2032
- Figure 36: Europe SNP Genotyping Market Volume (K Unit), by Technology 2024 & 2032
- Figure 37: Europe SNP Genotyping Market Revenue Share (%), by Technology 2024 & 2032
- Figure 38: Europe SNP Genotyping Market Volume Share (%), by Technology 2024 & 2032
- Figure 39: Europe SNP Genotyping Market Revenue (Million), by End User 2024 & 2032
- Figure 40: Europe SNP Genotyping Market Volume (K Unit), by End User 2024 & 2032
- Figure 41: Europe SNP Genotyping Market Revenue Share (%), by End User 2024 & 2032
- Figure 42: Europe SNP Genotyping Market Volume Share (%), by End User 2024 & 2032
- Figure 43: Europe SNP Genotyping Market Revenue (Million), by Country 2024 & 2032
- Figure 44: Europe SNP Genotyping Market Volume (K Unit), by Country 2024 & 2032
- Figure 45: Europe SNP Genotyping Market Revenue Share (%), by Country 2024 & 2032
- Figure 46: Europe SNP Genotyping Market Volume Share (%), by Country 2024 & 2032
- Figure 47: Asia Pacific SNP Genotyping Market Revenue (Million), by Technology 2024 & 2032
- Figure 48: Asia Pacific SNP Genotyping Market Volume (K Unit), by Technology 2024 & 2032
- Figure 49: Asia Pacific SNP Genotyping Market Revenue Share (%), by Technology 2024 & 2032
- Figure 50: Asia Pacific SNP Genotyping Market Volume Share (%), by Technology 2024 & 2032
- Figure 51: Asia Pacific SNP Genotyping Market Revenue (Million), by End User 2024 & 2032
- Figure 52: Asia Pacific SNP Genotyping Market Volume (K Unit), by End User 2024 & 2032
- Figure 53: Asia Pacific SNP Genotyping Market Revenue Share (%), by End User 2024 & 2032
- Figure 54: Asia Pacific SNP Genotyping Market Volume Share (%), by End User 2024 & 2032
- Figure 55: Asia Pacific SNP Genotyping Market Revenue (Million), by Country 2024 & 2032
- Figure 56: Asia Pacific SNP Genotyping Market Volume (K Unit), by Country 2024 & 2032
- Figure 57: Asia Pacific SNP Genotyping Market Revenue Share (%), by Country 2024 & 2032
- Figure 58: Asia Pacific SNP Genotyping Market Volume Share (%), by Country 2024 & 2032
- Figure 59: Middle East and Africa SNP Genotyping Market Revenue (Million), by Technology 2024 & 2032
- Figure 60: Middle East and Africa SNP Genotyping Market Volume (K Unit), by Technology 2024 & 2032
- Figure 61: Middle East and Africa SNP Genotyping Market Revenue Share (%), by Technology 2024 & 2032
- Figure 62: Middle East and Africa SNP Genotyping Market Volume Share (%), by Technology 2024 & 2032
- Figure 63: Middle East and Africa SNP Genotyping Market Revenue (Million), by End User 2024 & 2032
- Figure 64: Middle East and Africa SNP Genotyping Market Volume (K Unit), by End User 2024 & 2032
- Figure 65: Middle East and Africa SNP Genotyping Market Revenue Share (%), by End User 2024 & 2032
- Figure 66: Middle East and Africa SNP Genotyping Market Volume Share (%), by End User 2024 & 2032
- Figure 67: Middle East and Africa SNP Genotyping Market Revenue (Million), by Country 2024 & 2032
- Figure 68: Middle East and Africa SNP Genotyping Market Volume (K Unit), by Country 2024 & 2032
- Figure 69: Middle East and Africa SNP Genotyping Market Revenue Share (%), by Country 2024 & 2032
- Figure 70: Middle East and Africa SNP Genotyping Market Volume Share (%), by Country 2024 & 2032
- Figure 71: South America SNP Genotyping Market Revenue (Million), by Technology 2024 & 2032
- Figure 72: South America SNP Genotyping Market Volume (K Unit), by Technology 2024 & 2032
- Figure 73: South America SNP Genotyping Market Revenue Share (%), by Technology 2024 & 2032
- Figure 74: South America SNP Genotyping Market Volume Share (%), by Technology 2024 & 2032
- Figure 75: South America SNP Genotyping Market Revenue (Million), by End User 2024 & 2032
- Figure 76: South America SNP Genotyping Market Volume (K Unit), by End User 2024 & 2032
- Figure 77: South America SNP Genotyping Market Revenue Share (%), by End User 2024 & 2032
- Figure 78: South America SNP Genotyping Market Volume Share (%), by End User 2024 & 2032
- Figure 79: South America SNP Genotyping Market Revenue (Million), by Country 2024 & 2032
- Figure 80: South America SNP Genotyping Market Volume (K Unit), by Country 2024 & 2032
- Figure 81: South America SNP Genotyping Market Revenue Share (%), by Country 2024 & 2032
- Figure 82: South America SNP Genotyping Market Volume Share (%), by Country 2024 & 2032
List of Tables
- Table 1: Global SNP Genotyping Market Revenue Million Forecast, by Region 2019 & 2032
- Table 2: Global SNP Genotyping Market Volume K Unit Forecast, by Region 2019 & 2032
- Table 3: Global SNP Genotyping Market Revenue Million Forecast, by Technology 2019 & 2032
- Table 4: Global SNP Genotyping Market Volume K Unit Forecast, by Technology 2019 & 2032
- Table 5: Global SNP Genotyping Market Revenue Million Forecast, by End User 2019 & 2032
- Table 6: Global SNP Genotyping Market Volume K Unit Forecast, by End User 2019 & 2032
- Table 7: Global SNP Genotyping Market Revenue Million Forecast, by Region 2019 & 2032
- Table 8: Global SNP Genotyping Market Volume K Unit Forecast, by Region 2019 & 2032
- Table 9: Global SNP Genotyping Market Revenue Million Forecast, by Country 2019 & 2032
- Table 10: Global SNP Genotyping Market Volume K Unit Forecast, by Country 2019 & 2032
- Table 11: United States SNP Genotyping Market Revenue (Million) Forecast, by Application 2019 & 2032
- Table 12: United States SNP Genotyping Market Volume (K Unit) Forecast, by Application 2019 & 2032
- Table 13: Canada SNP Genotyping Market Revenue (Million) Forecast, by Application 2019 & 2032
- Table 14: Canada SNP Genotyping Market Volume (K Unit) Forecast, by Application 2019 & 2032
- Table 15: Mexico SNP Genotyping Market Revenue (Million) Forecast, by Application 2019 & 2032
- Table 16: Mexico SNP Genotyping Market Volume (K Unit) Forecast, by Application 2019 & 2032
- Table 17: Global SNP Genotyping Market Revenue Million Forecast, by Country 2019 & 2032
- Table 18: Global SNP Genotyping Market Volume K Unit Forecast, by Country 2019 & 2032
- Table 19: Germany SNP Genotyping Market Revenue (Million) Forecast, by Application 2019 & 2032
- Table 20: Germany SNP Genotyping Market Volume (K Unit) Forecast, by Application 2019 & 2032
- Table 21: United Kingdom SNP Genotyping Market Revenue (Million) Forecast, by Application 2019 & 2032
- Table 22: United Kingdom SNP Genotyping Market Volume (K Unit) Forecast, by Application 2019 & 2032
- Table 23: France SNP Genotyping Market Revenue (Million) Forecast, by Application 2019 & 2032
- Table 24: France SNP Genotyping Market Volume (K Unit) Forecast, by Application 2019 & 2032
- Table 25: Italy SNP Genotyping Market Revenue (Million) Forecast, by Application 2019 & 2032
- Table 26: Italy SNP Genotyping Market Volume (K Unit) Forecast, by Application 2019 & 2032
- Table 27: Spain SNP Genotyping Market Revenue (Million) Forecast, by Application 2019 & 2032
- Table 28: Spain SNP Genotyping Market Volume (K Unit) Forecast, by Application 2019 & 2032
- Table 29: Rest of Europe SNP Genotyping Market Revenue (Million) Forecast, by Application 2019 & 2032
- Table 30: Rest of Europe SNP Genotyping Market Volume (K Unit) Forecast, by Application 2019 & 2032
- Table 31: Global SNP Genotyping Market Revenue Million Forecast, by Country 2019 & 2032
- Table 32: Global SNP Genotyping Market Volume K Unit Forecast, by Country 2019 & 2032
- Table 33: China SNP Genotyping Market Revenue (Million) Forecast, by Application 2019 & 2032
- Table 34: China SNP Genotyping Market Volume (K Unit) Forecast, by Application 2019 & 2032
- Table 35: Japan SNP Genotyping Market Revenue (Million) Forecast, by Application 2019 & 2032
- Table 36: Japan SNP Genotyping Market Volume (K Unit) Forecast, by Application 2019 & 2032
- Table 37: India SNP Genotyping Market Revenue (Million) Forecast, by Application 2019 & 2032
- Table 38: India SNP Genotyping Market Volume (K Unit) Forecast, by Application 2019 & 2032
- Table 39: Australia SNP Genotyping Market Revenue (Million) Forecast, by Application 2019 & 2032
- Table 40: Australia SNP Genotyping Market Volume (K Unit) Forecast, by Application 2019 & 2032
- Table 41: South Korea SNP Genotyping Market Revenue (Million) Forecast, by Application 2019 & 2032
- Table 42: South Korea SNP Genotyping Market Volume (K Unit) Forecast, by Application 2019 & 2032
- Table 43: Rest of Asia Pacific SNP Genotyping Market Revenue (Million) Forecast, by Application 2019 & 2032
- Table 44: Rest of Asia Pacific SNP Genotyping Market Volume (K Unit) Forecast, by Application 2019 & 2032
- Table 45: Global SNP Genotyping Market Revenue Million Forecast, by Country 2019 & 2032
- Table 46: Global SNP Genotyping Market Volume K Unit Forecast, by Country 2019 & 2032
- Table 47: GCC SNP Genotyping Market Revenue (Million) Forecast, by Application 2019 & 2032
- Table 48: GCC SNP Genotyping Market Volume (K Unit) Forecast, by Application 2019 & 2032
- Table 49: South Africa SNP Genotyping Market Revenue (Million) Forecast, by Application 2019 & 2032
- Table 50: South Africa SNP Genotyping Market Volume (K Unit) Forecast, by Application 2019 & 2032
- Table 51: Rest of Middle East and Africa SNP Genotyping Market Revenue (Million) Forecast, by Application 2019 & 2032
- Table 52: Rest of Middle East and Africa SNP Genotyping Market Volume (K Unit) Forecast, by Application 2019 & 2032
- Table 53: Global SNP Genotyping Market Revenue Million Forecast, by Country 2019 & 2032
- Table 54: Global SNP Genotyping Market Volume K Unit Forecast, by Country 2019 & 2032
- Table 55: Brazil SNP Genotyping Market Revenue (Million) Forecast, by Application 2019 & 2032
- Table 56: Brazil SNP Genotyping Market Volume (K Unit) Forecast, by Application 2019 & 2032
- Table 57: Argentina SNP Genotyping Market Revenue (Million) Forecast, by Application 2019 & 2032
- Table 58: Argentina SNP Genotyping Market Volume (K Unit) Forecast, by Application 2019 & 2032
- Table 59: Rest of South America SNP Genotyping Market Revenue (Million) Forecast, by Application 2019 & 2032
- Table 60: Rest of South America SNP Genotyping Market Volume (K Unit) Forecast, by Application 2019 & 2032
- Table 61: Global SNP Genotyping Market Revenue Million Forecast, by Technology 2019 & 2032
- Table 62: Global SNP Genotyping Market Volume K Unit Forecast, by Technology 2019 & 2032
- Table 63: Global SNP Genotyping Market Revenue Million Forecast, by End User 2019 & 2032
- Table 64: Global SNP Genotyping Market Volume K Unit Forecast, by End User 2019 & 2032
- Table 65: Global SNP Genotyping Market Revenue Million Forecast, by Country 2019 & 2032
- Table 66: Global SNP Genotyping Market Volume K Unit Forecast, by Country 2019 & 2032
- Table 67: United States SNP Genotyping Market Revenue (Million) Forecast, by Application 2019 & 2032
- Table 68: United States SNP Genotyping Market Volume (K Unit) Forecast, by Application 2019 & 2032
- Table 69: Canada SNP Genotyping Market Revenue (Million) Forecast, by Application 2019 & 2032
- Table 70: Canada SNP Genotyping Market Volume (K Unit) Forecast, by Application 2019 & 2032
- Table 71: Mexico SNP Genotyping Market Revenue (Million) Forecast, by Application 2019 & 2032
- Table 72: Mexico SNP Genotyping Market Volume (K Unit) Forecast, by Application 2019 & 2032
- Table 73: Global SNP Genotyping Market Revenue Million Forecast, by Technology 2019 & 2032
- Table 74: Global SNP Genotyping Market Volume K Unit Forecast, by Technology 2019 & 2032
- Table 75: Global SNP Genotyping Market Revenue Million Forecast, by End User 2019 & 2032
- Table 76: Global SNP Genotyping Market Volume K Unit Forecast, by End User 2019 & 2032
- Table 77: Global SNP Genotyping Market Revenue Million Forecast, by Country 2019 & 2032
- Table 78: Global SNP Genotyping Market Volume K Unit Forecast, by Country 2019 & 2032
- Table 79: Germany SNP Genotyping Market Revenue (Million) Forecast, by Application 2019 & 2032
- Table 80: Germany SNP Genotyping Market Volume (K Unit) Forecast, by Application 2019 & 2032
- Table 81: United Kingdom SNP Genotyping Market Revenue (Million) Forecast, by Application 2019 & 2032
- Table 82: United Kingdom SNP Genotyping Market Volume (K Unit) Forecast, by Application 2019 & 2032
- Table 83: France SNP Genotyping Market Revenue (Million) Forecast, by Application 2019 & 2032
- Table 84: France SNP Genotyping Market Volume (K Unit) Forecast, by Application 2019 & 2032
- Table 85: Italy SNP Genotyping Market Revenue (Million) Forecast, by Application 2019 & 2032
- Table 86: Italy SNP Genotyping Market Volume (K Unit) Forecast, by Application 2019 & 2032
- Table 87: Spain SNP Genotyping Market Revenue (Million) Forecast, by Application 2019 & 2032
- Table 88: Spain SNP Genotyping Market Volume (K Unit) Forecast, by Application 2019 & 2032
- Table 89: Rest of Europe SNP Genotyping Market Revenue (Million) Forecast, by Application 2019 & 2032
- Table 90: Rest of Europe SNP Genotyping Market Volume (K Unit) Forecast, by Application 2019 & 2032
- Table 91: Global SNP Genotyping Market Revenue Million Forecast, by Technology 2019 & 2032
- Table 92: Global SNP Genotyping Market Volume K Unit Forecast, by Technology 2019 & 2032
- Table 93: Global SNP Genotyping Market Revenue Million Forecast, by End User 2019 & 2032
- Table 94: Global SNP Genotyping Market Volume K Unit Forecast, by End User 2019 & 2032
- Table 95: Global SNP Genotyping Market Revenue Million Forecast, by Country 2019 & 2032
- Table 96: Global SNP Genotyping Market Volume K Unit Forecast, by Country 2019 & 2032
- Table 97: China SNP Genotyping Market Revenue (Million) Forecast, by Application 2019 & 2032
- Table 98: China SNP Genotyping Market Volume (K Unit) Forecast, by Application 2019 & 2032
- Table 99: Japan SNP Genotyping Market Revenue (Million) Forecast, by Application 2019 & 2032
- Table 100: Japan SNP Genotyping Market Volume (K Unit) Forecast, by Application 2019 & 2032
- Table 101: India SNP Genotyping Market Revenue (Million) Forecast, by Application 2019 & 2032
- Table 102: India SNP Genotyping Market Volume (K Unit) Forecast, by Application 2019 & 2032
- Table 103: Australia SNP Genotyping Market Revenue (Million) Forecast, by Application 2019 & 2032
- Table 104: Australia SNP Genotyping Market Volume (K Unit) Forecast, by Application 2019 & 2032
- Table 105: South Korea SNP Genotyping Market Revenue (Million) Forecast, by Application 2019 & 2032
- Table 106: South Korea SNP Genotyping Market Volume (K Unit) Forecast, by Application 2019 & 2032
- Table 107: Rest of Asia Pacific SNP Genotyping Market Revenue (Million) Forecast, by Application 2019 & 2032
- Table 108: Rest of Asia Pacific SNP Genotyping Market Volume (K Unit) Forecast, by Application 2019 & 2032
- Table 109: Global SNP Genotyping Market Revenue Million Forecast, by Technology 2019 & 2032
- Table 110: Global SNP Genotyping Market Volume K Unit Forecast, by Technology 2019 & 2032
- Table 111: Global SNP Genotyping Market Revenue Million Forecast, by End User 2019 & 2032
- Table 112: Global SNP Genotyping Market Volume K Unit Forecast, by End User 2019 & 2032
- Table 113: Global SNP Genotyping Market Revenue Million Forecast, by Country 2019 & 2032
- Table 114: Global SNP Genotyping Market Volume K Unit Forecast, by Country 2019 & 2032
- Table 115: GCC SNP Genotyping Market Revenue (Million) Forecast, by Application 2019 & 2032
- Table 116: GCC SNP Genotyping Market Volume (K Unit) Forecast, by Application 2019 & 2032
- Table 117: South Africa SNP Genotyping Market Revenue (Million) Forecast, by Application 2019 & 2032
- Table 118: South Africa SNP Genotyping Market Volume (K Unit) Forecast, by Application 2019 & 2032
- Table 119: Rest of Middle East and Africa SNP Genotyping Market Revenue (Million) Forecast, by Application 2019 & 2032
- Table 120: Rest of Middle East and Africa SNP Genotyping Market Volume (K Unit) Forecast, by Application 2019 & 2032
- Table 121: Global SNP Genotyping Market Revenue Million Forecast, by Technology 2019 & 2032
- Table 122: Global SNP Genotyping Market Volume K Unit Forecast, by Technology 2019 & 2032
- Table 123: Global SNP Genotyping Market Revenue Million Forecast, by End User 2019 & 2032
- Table 124: Global SNP Genotyping Market Volume K Unit Forecast, by End User 2019 & 2032
- Table 125: Global SNP Genotyping Market Revenue Million Forecast, by Country 2019 & 2032
- Table 126: Global SNP Genotyping Market Volume K Unit Forecast, by Country 2019 & 2032
- Table 127: Brazil SNP Genotyping Market Revenue (Million) Forecast, by Application 2019 & 2032
- Table 128: Brazil SNP Genotyping Market Volume (K Unit) Forecast, by Application 2019 & 2032
- Table 129: Argentina SNP Genotyping Market Revenue (Million) Forecast, by Application 2019 & 2032
- Table 130: Argentina SNP Genotyping Market Volume (K Unit) Forecast, by Application 2019 & 2032
- Table 131: Rest of South America SNP Genotyping Market Revenue (Million) Forecast, by Application 2019 & 2032
- Table 132: Rest of South America SNP Genotyping Market Volume (K Unit) Forecast, by Application 2019 & 2032
Frequently Asked Questions
1. What is the projected Compound Annual Growth Rate (CAGR) of the SNP Genotyping Market?
The projected CAGR is approximately 21.00%.
2. Which companies are prominent players in the SNP Genotyping Market?
Key companies in the market include LGC Group, PREMIER Biosoft, Promega Corporation, Bio-Rad Laboratories Inc, Luminex Corp, Douglas Scientific LLC, Danaher Corporation, Agilent Technologies Inc, Thermo Fischer Scientific Inc, Life Technologies Corp, Illumina Inc, Sequenom, Fluidigm Corporation.
3. What are the main segments of the SNP Genotyping Market?
The market segments include Technology, End User.
4. Can you provide details about the market size?
The market size is estimated to be USD XX Million as of 2022.
5. What are some drivers contributing to market growth?
Miniaturisation of Equipment and Instruments; Increased Multiplexing Capacity Leading to Increased Application.
6. What are the notable trends driving market growth?
Pharmacogenomics Segment Expected to Witness High Growth Over the Forecast Period.
7. Are there any restraints impacting market growth?
Lack of Standardisation in SNP Processes; Privacy Concerns Pose a Threat to Broad Technology Adoption.
8. Can you provide examples of recent developments in the market?
Feb 2021: Novacyt launched its SNPsig portfolio of PCR genotyping assays that can be used to aid the diagnosis of new variants of SARS-CoV-2.
9. What pricing options are available for accessing the report?
Pricing options include single-user, multi-user, and enterprise licenses priced at USD 4750, USD 5250, and USD 8750 respectively.
10. Is the market size provided in terms of value or volume?
The market size is provided in terms of value, measured in Million and volume, measured in K Unit.
11. Are there any specific market keywords associated with the report?
Yes, the market keyword associated with the report is "SNP Genotyping Market," which aids in identifying and referencing the specific market segment covered.
12. How do I determine which pricing option suits my needs best?
The pricing options vary based on user requirements and access needs. Individual users may opt for single-user licenses, while businesses requiring broader access may choose multi-user or enterprise licenses for cost-effective access to the report.
13. Are there any additional resources or data provided in the SNP Genotyping Market report?
While the report offers comprehensive insights, it's advisable to review the specific contents or supplementary materials provided to ascertain if additional resources or data are available.
14. How can I stay updated on further developments or reports in the SNP Genotyping Market?
To stay informed about further developments, trends, and reports in the SNP Genotyping Market, consider subscribing to industry newsletters, following relevant companies and organizations, or regularly checking reputable industry news sources and publications.
Methodology
Step 1 - Identification of Relevant Samples Size from Population Database


Step 2 - Approaches for Defining Global Market Size (Value, Volume* & Price*)

Note*: In applicable scenarios
Step 3 - Data Sources
Primary Research
- Web Analytics
- Survey Reports
- Research Institute
- Latest Research Reports
- Opinion Leaders
Secondary Research
- Annual Reports
- White Paper
- Latest Press Release
- Industry Association
- Paid Database
- Investor Presentations

Step 4 - Data Triangulation
Involves using different sources of information in order to increase the validity of a study
These sources are likely to be stakeholders in a program - participants, other researchers, program staff, other community members, and so on.
Then we put all data in single framework & apply various statistical tools to find out the dynamic on the market.
During the analysis stage, feedback from the stakeholder groups would be compared to determine areas of agreement as well as areas of divergence
