

Key Insights
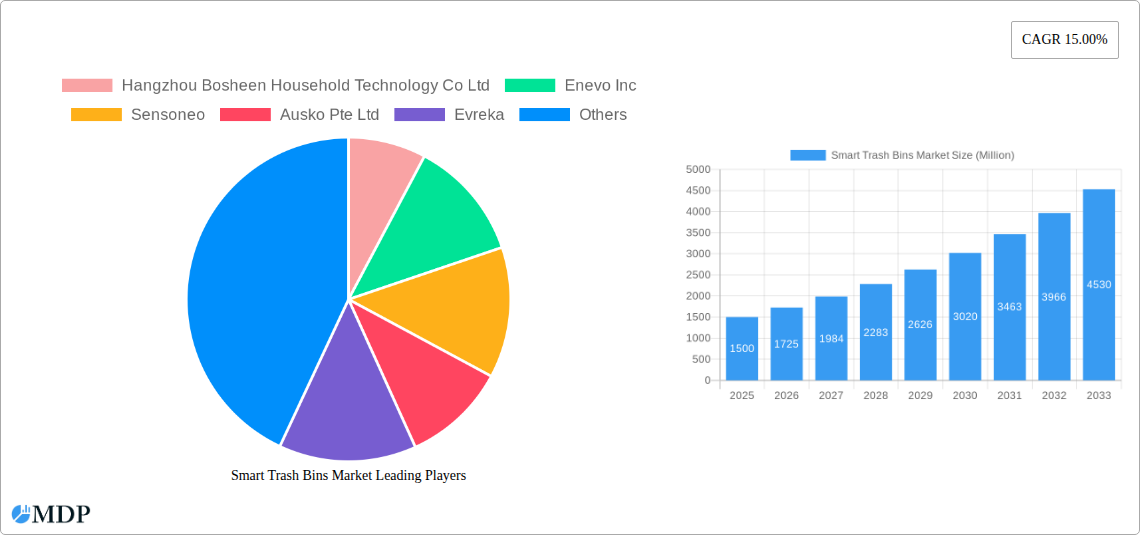
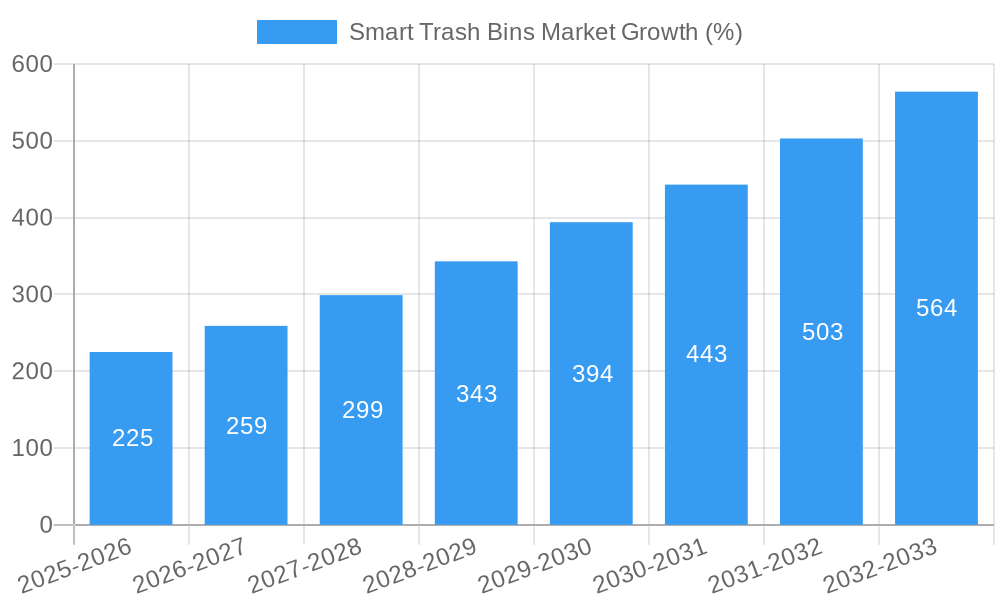
The smart trash bin market is experiencing robust growth, driven by increasing urbanization, rising environmental concerns, and the proliferation of smart city initiatives. A 15% CAGR (Compound Annual Growth Rate) indicates a significant expansion projected from 2025 to 2033. This growth is fueled by several key factors. Firstly, the integration of smart technologies, such as sensors and RFID tags, allows for real-time waste level monitoring, optimizing collection routes and reducing operational costs for municipalities and waste management companies. Secondly, the increasing demand for hygiene and sanitation, particularly in densely populated areas, is driving adoption in both residential and commercial settings. Online sales channels are also contributing to market expansion, offering convenience and wider reach to consumers. Market segmentation reveals strong growth across various solutions (hardware, software), sales channels (online and offline), and end-users (residential and commercial). The competitive landscape is relatively fragmented, with several companies vying for market share, indicating opportunities for innovation and differentiation. While the market is robust, potential restraints include high initial investment costs for smart bin implementation and the need for robust digital infrastructure in certain regions for optimal performance.
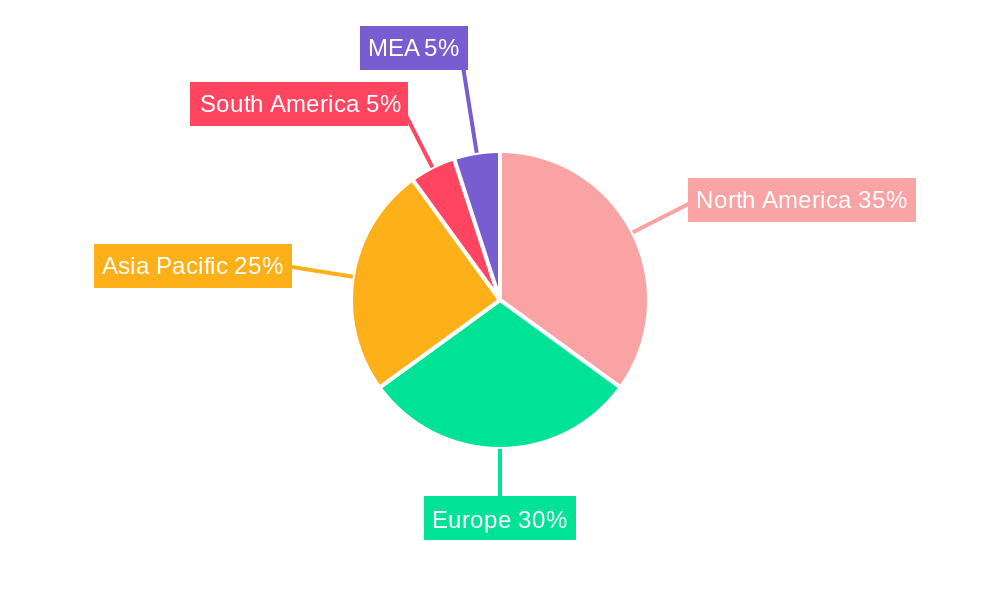
The North American market, driven by early adoption and technological advancements, is expected to maintain a significant share. However, the Asia-Pacific region is anticipated to witness rapid growth due to increasing urbanization and government support for smart city projects in countries like China, India, and Japan. Europe, with its established waste management infrastructure and environmental consciousness, is also a major contributor to market growth. Further growth will depend on effective partnerships between technology providers, municipalities, and waste management companies. Focus on cost-effectiveness, user-friendly interfaces, and integration with existing waste management systems will be crucial for continued market expansion. Future developments likely involve integration with IoT platforms and advanced analytics to provide even more granular data and insights into waste management practices, further driving market growth.
Smart Trash Bins Market: A Comprehensive Report (2019-2033)
This insightful report provides a detailed analysis of the Smart Trash Bins Market, offering a comprehensive overview of market dynamics, leading players, and future growth prospects. With a study period spanning from 2019 to 2033, including a base year of 2025 and a forecast period from 2025 to 2033, this report is an essential resource for industry stakeholders, investors, and businesses seeking to understand and capitalize on the opportunities within this rapidly evolving market. The market is projected to reach xx Million by 2033, exhibiting a CAGR of xx% during the forecast period.
Smart Trash Bins Market Market Dynamics & Concentration
The Smart Trash Bins Market is characterized by a moderately concentrated landscape, with several key players vying for market share. Innovation is a major driver, with continuous advancements in sensor technology, data analytics, and waste management strategies. Regulatory frameworks, particularly concerning waste disposal and environmental sustainability, significantly influence market growth. Product substitutes, such as traditional waste bins, still pose competition, but the advantages of smart bins in terms of efficiency and data-driven insights are driving market adoption. End-user trends, including increasing urbanization and growing environmental awareness, are fueling demand. M&A activities are relatively frequent, with approximately xx M&A deals recorded between 2019 and 2024, indicating consolidation and expansion within the sector. Major players hold approximately xx% of the market share collectively, while smaller players contribute the remaining xx%.
- Market Concentration: Moderately concentrated, with top players holding xx% market share.
- Innovation Drivers: Advancements in sensor technology, AI, and data analytics.
- Regulatory Frameworks: Government initiatives promoting smart city development and waste management.
- Product Substitutes: Traditional waste bins, but smart bins offer efficiency and data advantages.
- End-User Trends: Urbanization, environmental consciousness, and increasing demand for hygienic waste management.
- M&A Activity: Approximately xx deals between 2019 and 2024, indicating market consolidation.
Smart Trash Bins Market Industry Trends & Analysis
The Smart Trash Bins Market is experiencing robust growth driven by several key factors. Technological disruptions, particularly the integration of IoT, AI, and advanced sensor technologies, are revolutionizing waste management practices. Consumer preferences are shifting towards convenient, efficient, and environmentally friendly solutions. The competitive dynamics are marked by intense innovation, strategic partnerships, and a push towards offering integrated solutions that combine hardware, software, and data analytics. The market penetration rate for smart bins in commercial sectors is currently at approximately xx%, with a significant potential for future growth. The market is projected to witness substantial expansion, fueled by factors such as increasing awareness of waste management, technological advancements, and government initiatives. The CAGR for the period 2025-2033 is estimated to be xx%.
Leading Markets & Segments in Smart Trash Bins Market
The Smart Trash Bins Market is witnessing significant growth across various regions and segments. While specific market share data for regions and segments is not fully detailed in the prompt, the commercial sector is a significant driver, with high adoption rates of smart bins in cities and urban areas. The hardware segment, especially sensors and RFID tags, dominates the solution type segment, due to the fundamental role of these components in enabling smart functionality. Online sales channels are gaining traction, particularly for smaller, residential-focused smart bins.
- Key Drivers for Commercial Dominance: High waste generation, need for efficient waste management, and opportunities for cost optimization.
- Key Drivers for Hardware Segment Dominance: Essential components enabling smart functionality and data collection.
- Key Drivers for Online Sales Channel Growth: Convenience, wider reach, and competitive pricing.
While data limitations prevent full regional analysis, the report will thoroughly examine the market landscape in leading countries by conducting primary and secondary research.
Smart Trash Bins Market Product Developments
Recent product developments highlight a trend toward more integrated and sophisticated smart bin solutions. Manufacturers are focusing on advanced sensor technologies for precise fill-level detection, improved data analytics capabilities for optimized waste collection routes, and user-friendly interfaces for real-time monitoring. Integration with city-wide waste management systems is becoming increasingly common, allowing for better overall waste management efficiency and sustainability. Smart bins are also being integrated with additional functionalities, such as air quality monitoring and advertising displays, furthering their appeal and market viability.
Key Drivers of Smart Trash Bins Market Growth
Several factors are driving the growth of the Smart Trash Bins Market. Technological advancements, particularly in sensor technology, IoT, and AI, are enabling the development of more sophisticated and efficient smart bin solutions. Economic factors, such as rising labor costs associated with manual waste collection and the need for cost-effective waste management systems, are also pushing adoption. Government regulations and initiatives focused on smart cities and sustainable waste management practices are providing significant support to market expansion. For instance, the installation of IoT-enabled underground bins in Gandhinagar and AI-based smart bins in Kolkata are clear examples.
Challenges in the Smart Trash Bins Market Market
Despite the growth potential, several challenges hinder market expansion. Regulatory hurdles and varying standards for waste management across different regions can create complexities for manufacturers and deployment. Supply chain issues, particularly concerning the availability of advanced sensors and other critical components, can impact production and cost. Intense competition, coupled with the need for continuous innovation to stay ahead of the curve, presents further challenges. These factors contribute to an overall market restraint of approximately xx% in the current market.
Emerging Opportunities in Smart Trash Bins Market
The Smart Trash Bins Market presents significant long-term growth opportunities. Technological breakthroughs, such as the development of more energy-efficient sensors and advanced data analytics algorithms, are opening up new possibilities. Strategic partnerships between technology providers, waste management companies, and municipal authorities are creating synergistic opportunities. Market expansion into emerging economies and underserved regions offers significant untapped potential, with a predicted increase of xx% in these markets over the forecast period.
Leading Players in the Smart Trash Bins Market Sector
- Hangzhou Bosheen Household Technology Co Ltd
- Enevo Inc
- Sensoneo
- Ausko Pte Ltd
- Evreka
- Sehaj Synergy Technologies Pvt Ltd
- iTouchless Housewares and Products Inc
- Euronics Industries Pvt Ltd
- CleanRobotics
- Bine sp z o o
Key Milestones in Smart Trash Bins Market Industry
- January 2022: The New Town Kolkata Development Authority (NKDA) started installing AI-based smart waste bins in New Town, Kolkata.
- March 2022: Gandhinagar Municipal Corporation, Gujarat, initiated the installation of IoT-enabled underground bins equipped with remote-fill level sensors.
Strategic Outlook for Smart Trash Bins Market Market
The Smart Trash Bins Market is poised for significant growth in the coming years. The increasing adoption of smart city initiatives, coupled with technological advancements and rising environmental concerns, will continue to drive demand for innovative waste management solutions. Strategic partnerships, focused on developing integrated solutions and expanding market reach, will play a crucial role in shaping the future of the market. The market's potential for expansion into emerging economies and the development of new applications for smart bins will further contribute to long-term growth. The overall outlook for the smart trash bins market remains highly positive, with significant opportunities for both established players and new entrants.
Smart Trash Bins Market Segmentation
-
1. Solution Type
- 1.1. Hardware (Sensors, RFID Tags, etc.)
- 1.2. Software
-
2. Sales Channel
- 2.1. Offline
- 2.2. Online
-
3. End User
- 3.1. Residential
- 3.2. Commercial
Smart Trash Bins Market Segmentation By Geography
- 1. North America
- 2. Europe
- 3. Asia Pacific
- 4. Latin America
- 5. Middle East
Smart Trash Bins Market REPORT HIGHLIGHTS
| Aspects | Details |
|---|---|
| Study Period | 2019-2033 |
| Base Year | 2024 |
| Estimated Year | 2025 |
| Forecast Period | 2025-2033 |
| Historical Period | 2019-2024 |
| Growth Rate | CAGR of 15.00% from 2019-2033 |
| Segmentation |
|
Table of Contents
- 1. Introduction
- 1.1. Research Scope
- 1.2. Market Segmentation
- 1.3. Research Methodology
- 1.4. Definitions and Assumptions
- 2. Executive Summary
- 2.1. Introduction
- 3. Market Dynamics
- 3.1. Introduction
- 3.2. Market Drivers
- 3.2.1. Increasing Investment in Smart Cities and Effective Waste Management Systems; Increasing penetration of Internet of Things (IoT) and Wireless Connecting Devices
- 3.3. Market Restrains
- 3.3.1. Lower Awareness and Higher Cost Restraints the Market's Growth Especially in Developing Countries
- 3.4. Market Trends
- 3.4.1. Growing Urbanization & Investment in Smart City Infrastructure to Drive the Market's Growth
- 4. Market Factor Analysis
- 4.1. Porters Five Forces
- 4.2. Supply/Value Chain
- 4.3. PESTEL analysis
- 4.4. Market Entropy
- 4.5. Patent/Trademark Analysis
- 5. Global Smart Trash Bins Market Analysis, Insights and Forecast, 2019-2031
- 5.1. Market Analysis, Insights and Forecast - by Solution Type
- 5.1.1. Hardware (Sensors, RFID Tags, etc.)
- 5.1.2. Software
- 5.2. Market Analysis, Insights and Forecast - by Sales Channel
- 5.2.1. Offline
- 5.2.2. Online
- 5.3. Market Analysis, Insights and Forecast - by End User
- 5.3.1. Residential
- 5.3.2. Commercial
- 5.4. Market Analysis, Insights and Forecast - by Region
- 5.4.1. North America
- 5.4.2. Europe
- 5.4.3. Asia Pacific
- 5.4.4. Latin America
- 5.4.5. Middle East
- 5.1. Market Analysis, Insights and Forecast - by Solution Type
- 6. North America Smart Trash Bins Market Analysis, Insights and Forecast, 2019-2031
- 6.1. Market Analysis, Insights and Forecast - by Solution Type
- 6.1.1. Hardware (Sensors, RFID Tags, etc.)
- 6.1.2. Software
- 6.2. Market Analysis, Insights and Forecast - by Sales Channel
- 6.2.1. Offline
- 6.2.2. Online
- 6.3. Market Analysis, Insights and Forecast - by End User
- 6.3.1. Residential
- 6.3.2. Commercial
- 6.1. Market Analysis, Insights and Forecast - by Solution Type
- 7. Europe Smart Trash Bins Market Analysis, Insights and Forecast, 2019-2031
- 7.1. Market Analysis, Insights and Forecast - by Solution Type
- 7.1.1. Hardware (Sensors, RFID Tags, etc.)
- 7.1.2. Software
- 7.2. Market Analysis, Insights and Forecast - by Sales Channel
- 7.2.1. Offline
- 7.2.2. Online
- 7.3. Market Analysis, Insights and Forecast - by End User
- 7.3.1. Residential
- 7.3.2. Commercial
- 7.1. Market Analysis, Insights and Forecast - by Solution Type
- 8. Asia Pacific Smart Trash Bins Market Analysis, Insights and Forecast, 2019-2031
- 8.1. Market Analysis, Insights and Forecast - by Solution Type
- 8.1.1. Hardware (Sensors, RFID Tags, etc.)
- 8.1.2. Software
- 8.2. Market Analysis, Insights and Forecast - by Sales Channel
- 8.2.1. Offline
- 8.2.2. Online
- 8.3. Market Analysis, Insights and Forecast - by End User
- 8.3.1. Residential
- 8.3.2. Commercial
- 8.1. Market Analysis, Insights and Forecast - by Solution Type
- 9. Latin America Smart Trash Bins Market Analysis, Insights and Forecast, 2019-2031
- 9.1. Market Analysis, Insights and Forecast - by Solution Type
- 9.1.1. Hardware (Sensors, RFID Tags, etc.)
- 9.1.2. Software
- 9.2. Market Analysis, Insights and Forecast - by Sales Channel
- 9.2.1. Offline
- 9.2.2. Online
- 9.3. Market Analysis, Insights and Forecast - by End User
- 9.3.1. Residential
- 9.3.2. Commercial
- 9.1. Market Analysis, Insights and Forecast - by Solution Type
- 10. Middle East Smart Trash Bins Market Analysis, Insights and Forecast, 2019-2031
- 10.1. Market Analysis, Insights and Forecast - by Solution Type
- 10.1.1. Hardware (Sensors, RFID Tags, etc.)
- 10.1.2. Software
- 10.2. Market Analysis, Insights and Forecast - by Sales Channel
- 10.2.1. Offline
- 10.2.2. Online
- 10.3. Market Analysis, Insights and Forecast - by End User
- 10.3.1. Residential
- 10.3.2. Commercial
- 10.1. Market Analysis, Insights and Forecast - by Solution Type
- 11. North America Smart Trash Bins Market Analysis, Insights and Forecast, 2019-2031
- 11.1. Market Analysis, Insights and Forecast - By Country/Sub-region
- 11.1.1 United States
- 11.1.2 Canada
- 11.1.3 Mexico
- 12. Europe Smart Trash Bins Market Analysis, Insights and Forecast, 2019-2031
- 12.1. Market Analysis, Insights and Forecast - By Country/Sub-region
- 12.1.1 Germany
- 12.1.2 United Kingdom
- 12.1.3 France
- 12.1.4 Spain
- 12.1.5 Italy
- 12.1.6 Spain
- 12.1.7 Belgium
- 12.1.8 Netherland
- 12.1.9 Nordics
- 12.1.10 Rest of Europe
- 13. Asia Pacific Smart Trash Bins Market Analysis, Insights and Forecast, 2019-2031
- 13.1. Market Analysis, Insights and Forecast - By Country/Sub-region
- 13.1.1 China
- 13.1.2 Japan
- 13.1.3 India
- 13.1.4 South Korea
- 13.1.5 Southeast Asia
- 13.1.6 Australia
- 13.1.7 Indonesia
- 13.1.8 Phillipes
- 13.1.9 Singapore
- 13.1.10 Thailandc
- 13.1.11 Rest of Asia Pacific
- 14. South America Smart Trash Bins Market Analysis, Insights and Forecast, 2019-2031
- 14.1. Market Analysis, Insights and Forecast - By Country/Sub-region
- 14.1.1 Brazil
- 14.1.2 Argentina
- 14.1.3 Peru
- 14.1.4 Chile
- 14.1.5 Colombia
- 14.1.6 Ecuador
- 14.1.7 Venezuela
- 14.1.8 Rest of South America
- 15. North America Smart Trash Bins Market Analysis, Insights and Forecast, 2019-2031
- 15.1. Market Analysis, Insights and Forecast - By Country/Sub-region
- 15.1.1 United States
- 15.1.2 Canada
- 15.1.3 Mexico
- 16. MEA Smart Trash Bins Market Analysis, Insights and Forecast, 2019-2031
- 16.1. Market Analysis, Insights and Forecast - By Country/Sub-region
- 16.1.1 United Arab Emirates
- 16.1.2 Saudi Arabia
- 16.1.3 South Africa
- 16.1.4 Rest of Middle East and Africa
- 17. Competitive Analysis
- 17.1. Global Market Share Analysis 2024
- 17.2. Company Profiles
- 17.2.1 Hangzhou Bosheen Household Technology Co Ltd
- 17.2.1.1. Overview
- 17.2.1.2. Products
- 17.2.1.3. SWOT Analysis
- 17.2.1.4. Recent Developments
- 17.2.1.5. Financials (Based on Availability)
- 17.2.2 Enevo Inc
- 17.2.2.1. Overview
- 17.2.2.2. Products
- 17.2.2.3. SWOT Analysis
- 17.2.2.4. Recent Developments
- 17.2.2.5. Financials (Based on Availability)
- 17.2.3 Sensoneo
- 17.2.3.1. Overview
- 17.2.3.2. Products
- 17.2.3.3. SWOT Analysis
- 17.2.3.4. Recent Developments
- 17.2.3.5. Financials (Based on Availability)
- 17.2.4 Ausko Pte Ltd
- 17.2.4.1. Overview
- 17.2.4.2. Products
- 17.2.4.3. SWOT Analysis
- 17.2.4.4. Recent Developments
- 17.2.4.5. Financials (Based on Availability)
- 17.2.5 Evreka
- 17.2.5.1. Overview
- 17.2.5.2. Products
- 17.2.5.3. SWOT Analysis
- 17.2.5.4. Recent Developments
- 17.2.5.5. Financials (Based on Availability)
- 17.2.6 Sehaj Synergy Technologies Pvt Ltd
- 17.2.6.1. Overview
- 17.2.6.2. Products
- 17.2.6.3. SWOT Analysis
- 17.2.6.4. Recent Developments
- 17.2.6.5. Financials (Based on Availability)
- 17.2.7 iTouchless Housewares and Products Inc
- 17.2.7.1. Overview
- 17.2.7.2. Products
- 17.2.7.3. SWOT Analysis
- 17.2.7.4. Recent Developments
- 17.2.7.5. Financials (Based on Availability)
- 17.2.8 Euronics Industries Pvt Ltd
- 17.2.8.1. Overview
- 17.2.8.2. Products
- 17.2.8.3. SWOT Analysis
- 17.2.8.4. Recent Developments
- 17.2.8.5. Financials (Based on Availability)
- 17.2.9 CleanRobotics
- 17.2.9.1. Overview
- 17.2.9.2. Products
- 17.2.9.3. SWOT Analysis
- 17.2.9.4. Recent Developments
- 17.2.9.5. Financials (Based on Availability)
- 17.2.10 Bine sp z o o
- 17.2.10.1. Overview
- 17.2.10.2. Products
- 17.2.10.3. SWOT Analysis
- 17.2.10.4. Recent Developments
- 17.2.10.5. Financials (Based on Availability)
- 17.2.1 Hangzhou Bosheen Household Technology Co Ltd
List of Figures
- Figure 1: Global Smart Trash Bins Market Revenue Breakdown (Million, %) by Region 2024 & 2032
- Figure 2: North America Smart Trash Bins Market Revenue (Million), by Country 2024 & 2032
- Figure 3: North America Smart Trash Bins Market Revenue Share (%), by Country 2024 & 2032
- Figure 4: Europe Smart Trash Bins Market Revenue (Million), by Country 2024 & 2032
- Figure 5: Europe Smart Trash Bins Market Revenue Share (%), by Country 2024 & 2032
- Figure 6: Asia Pacific Smart Trash Bins Market Revenue (Million), by Country 2024 & 2032
- Figure 7: Asia Pacific Smart Trash Bins Market Revenue Share (%), by Country 2024 & 2032
- Figure 8: South America Smart Trash Bins Market Revenue (Million), by Country 2024 & 2032
- Figure 9: South America Smart Trash Bins Market Revenue Share (%), by Country 2024 & 2032
- Figure 10: North America Smart Trash Bins Market Revenue (Million), by Country 2024 & 2032
- Figure 11: North America Smart Trash Bins Market Revenue Share (%), by Country 2024 & 2032
- Figure 12: MEA Smart Trash Bins Market Revenue (Million), by Country 2024 & 2032
- Figure 13: MEA Smart Trash Bins Market Revenue Share (%), by Country 2024 & 2032
- Figure 14: North America Smart Trash Bins Market Revenue (Million), by Solution Type 2024 & 2032
- Figure 15: North America Smart Trash Bins Market Revenue Share (%), by Solution Type 2024 & 2032
- Figure 16: North America Smart Trash Bins Market Revenue (Million), by Sales Channel 2024 & 2032
- Figure 17: North America Smart Trash Bins Market Revenue Share (%), by Sales Channel 2024 & 2032
- Figure 18: North America Smart Trash Bins Market Revenue (Million), by End User 2024 & 2032
- Figure 19: North America Smart Trash Bins Market Revenue Share (%), by End User 2024 & 2032
- Figure 20: North America Smart Trash Bins Market Revenue (Million), by Country 2024 & 2032
- Figure 21: North America Smart Trash Bins Market Revenue Share (%), by Country 2024 & 2032
- Figure 22: Europe Smart Trash Bins Market Revenue (Million), by Solution Type 2024 & 2032
- Figure 23: Europe Smart Trash Bins Market Revenue Share (%), by Solution Type 2024 & 2032
- Figure 24: Europe Smart Trash Bins Market Revenue (Million), by Sales Channel 2024 & 2032
- Figure 25: Europe Smart Trash Bins Market Revenue Share (%), by Sales Channel 2024 & 2032
- Figure 26: Europe Smart Trash Bins Market Revenue (Million), by End User 2024 & 2032
- Figure 27: Europe Smart Trash Bins Market Revenue Share (%), by End User 2024 & 2032
- Figure 28: Europe Smart Trash Bins Market Revenue (Million), by Country 2024 & 2032
- Figure 29: Europe Smart Trash Bins Market Revenue Share (%), by Country 2024 & 2032
- Figure 30: Asia Pacific Smart Trash Bins Market Revenue (Million), by Solution Type 2024 & 2032
- Figure 31: Asia Pacific Smart Trash Bins Market Revenue Share (%), by Solution Type 2024 & 2032
- Figure 32: Asia Pacific Smart Trash Bins Market Revenue (Million), by Sales Channel 2024 & 2032
- Figure 33: Asia Pacific Smart Trash Bins Market Revenue Share (%), by Sales Channel 2024 & 2032
- Figure 34: Asia Pacific Smart Trash Bins Market Revenue (Million), by End User 2024 & 2032
- Figure 35: Asia Pacific Smart Trash Bins Market Revenue Share (%), by End User 2024 & 2032
- Figure 36: Asia Pacific Smart Trash Bins Market Revenue (Million), by Country 2024 & 2032
- Figure 37: Asia Pacific Smart Trash Bins Market Revenue Share (%), by Country 2024 & 2032
- Figure 38: Latin America Smart Trash Bins Market Revenue (Million), by Solution Type 2024 & 2032
- Figure 39: Latin America Smart Trash Bins Market Revenue Share (%), by Solution Type 2024 & 2032
- Figure 40: Latin America Smart Trash Bins Market Revenue (Million), by Sales Channel 2024 & 2032
- Figure 41: Latin America Smart Trash Bins Market Revenue Share (%), by Sales Channel 2024 & 2032
- Figure 42: Latin America Smart Trash Bins Market Revenue (Million), by End User 2024 & 2032
- Figure 43: Latin America Smart Trash Bins Market Revenue Share (%), by End User 2024 & 2032
- Figure 44: Latin America Smart Trash Bins Market Revenue (Million), by Country 2024 & 2032
- Figure 45: Latin America Smart Trash Bins Market Revenue Share (%), by Country 2024 & 2032
- Figure 46: Middle East Smart Trash Bins Market Revenue (Million), by Solution Type 2024 & 2032
- Figure 47: Middle East Smart Trash Bins Market Revenue Share (%), by Solution Type 2024 & 2032
- Figure 48: Middle East Smart Trash Bins Market Revenue (Million), by Sales Channel 2024 & 2032
- Figure 49: Middle East Smart Trash Bins Market Revenue Share (%), by Sales Channel 2024 & 2032
- Figure 50: Middle East Smart Trash Bins Market Revenue (Million), by End User 2024 & 2032
- Figure 51: Middle East Smart Trash Bins Market Revenue Share (%), by End User 2024 & 2032
- Figure 52: Middle East Smart Trash Bins Market Revenue (Million), by Country 2024 & 2032
- Figure 53: Middle East Smart Trash Bins Market Revenue Share (%), by Country 2024 & 2032
List of Tables
- Table 1: Global Smart Trash Bins Market Revenue Million Forecast, by Region 2019 & 2032
- Table 2: Global Smart Trash Bins Market Revenue Million Forecast, by Solution Type 2019 & 2032
- Table 3: Global Smart Trash Bins Market Revenue Million Forecast, by Sales Channel 2019 & 2032
- Table 4: Global Smart Trash Bins Market Revenue Million Forecast, by End User 2019 & 2032
- Table 5: Global Smart Trash Bins Market Revenue Million Forecast, by Region 2019 & 2032
- Table 6: Global Smart Trash Bins Market Revenue Million Forecast, by Country 2019 & 2032
- Table 7: United States Smart Trash Bins Market Revenue (Million) Forecast, by Application 2019 & 2032
- Table 8: Canada Smart Trash Bins Market Revenue (Million) Forecast, by Application 2019 & 2032
- Table 9: Mexico Smart Trash Bins Market Revenue (Million) Forecast, by Application 2019 & 2032
- Table 10: Global Smart Trash Bins Market Revenue Million Forecast, by Country 2019 & 2032
- Table 11: Germany Smart Trash Bins Market Revenue (Million) Forecast, by Application 2019 & 2032
- Table 12: United Kingdom Smart Trash Bins Market Revenue (Million) Forecast, by Application 2019 & 2032
- Table 13: France Smart Trash Bins Market Revenue (Million) Forecast, by Application 2019 & 2032
- Table 14: Spain Smart Trash Bins Market Revenue (Million) Forecast, by Application 2019 & 2032
- Table 15: Italy Smart Trash Bins Market Revenue (Million) Forecast, by Application 2019 & 2032
- Table 16: Spain Smart Trash Bins Market Revenue (Million) Forecast, by Application 2019 & 2032
- Table 17: Belgium Smart Trash Bins Market Revenue (Million) Forecast, by Application 2019 & 2032
- Table 18: Netherland Smart Trash Bins Market Revenue (Million) Forecast, by Application 2019 & 2032
- Table 19: Nordics Smart Trash Bins Market Revenue (Million) Forecast, by Application 2019 & 2032
- Table 20: Rest of Europe Smart Trash Bins Market Revenue (Million) Forecast, by Application 2019 & 2032
- Table 21: Global Smart Trash Bins Market Revenue Million Forecast, by Country 2019 & 2032
- Table 22: China Smart Trash Bins Market Revenue (Million) Forecast, by Application 2019 & 2032
- Table 23: Japan Smart Trash Bins Market Revenue (Million) Forecast, by Application 2019 & 2032
- Table 24: India Smart Trash Bins Market Revenue (Million) Forecast, by Application 2019 & 2032
- Table 25: South Korea Smart Trash Bins Market Revenue (Million) Forecast, by Application 2019 & 2032
- Table 26: Southeast Asia Smart Trash Bins Market Revenue (Million) Forecast, by Application 2019 & 2032
- Table 27: Australia Smart Trash Bins Market Revenue (Million) Forecast, by Application 2019 & 2032
- Table 28: Indonesia Smart Trash Bins Market Revenue (Million) Forecast, by Application 2019 & 2032
- Table 29: Phillipes Smart Trash Bins Market Revenue (Million) Forecast, by Application 2019 & 2032
- Table 30: Singapore Smart Trash Bins Market Revenue (Million) Forecast, by Application 2019 & 2032
- Table 31: Thailandc Smart Trash Bins Market Revenue (Million) Forecast, by Application 2019 & 2032
- Table 32: Rest of Asia Pacific Smart Trash Bins Market Revenue (Million) Forecast, by Application 2019 & 2032
- Table 33: Global Smart Trash Bins Market Revenue Million Forecast, by Country 2019 & 2032
- Table 34: Brazil Smart Trash Bins Market Revenue (Million) Forecast, by Application 2019 & 2032
- Table 35: Argentina Smart Trash Bins Market Revenue (Million) Forecast, by Application 2019 & 2032
- Table 36: Peru Smart Trash Bins Market Revenue (Million) Forecast, by Application 2019 & 2032
- Table 37: Chile Smart Trash Bins Market Revenue (Million) Forecast, by Application 2019 & 2032
- Table 38: Colombia Smart Trash Bins Market Revenue (Million) Forecast, by Application 2019 & 2032
- Table 39: Ecuador Smart Trash Bins Market Revenue (Million) Forecast, by Application 2019 & 2032
- Table 40: Venezuela Smart Trash Bins Market Revenue (Million) Forecast, by Application 2019 & 2032
- Table 41: Rest of South America Smart Trash Bins Market Revenue (Million) Forecast, by Application 2019 & 2032
- Table 42: Global Smart Trash Bins Market Revenue Million Forecast, by Country 2019 & 2032
- Table 43: United States Smart Trash Bins Market Revenue (Million) Forecast, by Application 2019 & 2032
- Table 44: Canada Smart Trash Bins Market Revenue (Million) Forecast, by Application 2019 & 2032
- Table 45: Mexico Smart Trash Bins Market Revenue (Million) Forecast, by Application 2019 & 2032
- Table 46: Global Smart Trash Bins Market Revenue Million Forecast, by Country 2019 & 2032
- Table 47: United Arab Emirates Smart Trash Bins Market Revenue (Million) Forecast, by Application 2019 & 2032
- Table 48: Saudi Arabia Smart Trash Bins Market Revenue (Million) Forecast, by Application 2019 & 2032
- Table 49: South Africa Smart Trash Bins Market Revenue (Million) Forecast, by Application 2019 & 2032
- Table 50: Rest of Middle East and Africa Smart Trash Bins Market Revenue (Million) Forecast, by Application 2019 & 2032
- Table 51: Global Smart Trash Bins Market Revenue Million Forecast, by Solution Type 2019 & 2032
- Table 52: Global Smart Trash Bins Market Revenue Million Forecast, by Sales Channel 2019 & 2032
- Table 53: Global Smart Trash Bins Market Revenue Million Forecast, by End User 2019 & 2032
- Table 54: Global Smart Trash Bins Market Revenue Million Forecast, by Country 2019 & 2032
- Table 55: Global Smart Trash Bins Market Revenue Million Forecast, by Solution Type 2019 & 2032
- Table 56: Global Smart Trash Bins Market Revenue Million Forecast, by Sales Channel 2019 & 2032
- Table 57: Global Smart Trash Bins Market Revenue Million Forecast, by End User 2019 & 2032
- Table 58: Global Smart Trash Bins Market Revenue Million Forecast, by Country 2019 & 2032
- Table 59: Global Smart Trash Bins Market Revenue Million Forecast, by Solution Type 2019 & 2032
- Table 60: Global Smart Trash Bins Market Revenue Million Forecast, by Sales Channel 2019 & 2032
- Table 61: Global Smart Trash Bins Market Revenue Million Forecast, by End User 2019 & 2032
- Table 62: Global Smart Trash Bins Market Revenue Million Forecast, by Country 2019 & 2032
- Table 63: Global Smart Trash Bins Market Revenue Million Forecast, by Solution Type 2019 & 2032
- Table 64: Global Smart Trash Bins Market Revenue Million Forecast, by Sales Channel 2019 & 2032
- Table 65: Global Smart Trash Bins Market Revenue Million Forecast, by End User 2019 & 2032
- Table 66: Global Smart Trash Bins Market Revenue Million Forecast, by Country 2019 & 2032
- Table 67: Global Smart Trash Bins Market Revenue Million Forecast, by Solution Type 2019 & 2032
- Table 68: Global Smart Trash Bins Market Revenue Million Forecast, by Sales Channel 2019 & 2032
- Table 69: Global Smart Trash Bins Market Revenue Million Forecast, by End User 2019 & 2032
- Table 70: Global Smart Trash Bins Market Revenue Million Forecast, by Country 2019 & 2032
Frequently Asked Questions
1. What is the projected Compound Annual Growth Rate (CAGR) of the Smart Trash Bins Market?
The projected CAGR is approximately 15.00%.
2. Which companies are prominent players in the Smart Trash Bins Market?
Key companies in the market include Hangzhou Bosheen Household Technology Co Ltd, Enevo Inc, Sensoneo, Ausko Pte Ltd, Evreka, Sehaj Synergy Technologies Pvt Ltd , iTouchless Housewares and Products Inc, Euronics Industries Pvt Ltd, CleanRobotics, Bine sp z o o.
3. What are the main segments of the Smart Trash Bins Market?
The market segments include Solution Type, Sales Channel, End User.
4. Can you provide details about the market size?
The market size is estimated to be USD XX Million as of 2022.
5. What are some drivers contributing to market growth?
Increasing Investment in Smart Cities and Effective Waste Management Systems; Increasing penetration of Internet of Things (IoT) and Wireless Connecting Devices.
6. What are the notable trends driving market growth?
Growing Urbanization & Investment in Smart City Infrastructure to Drive the Market's Growth.
7. Are there any restraints impacting market growth?
Lower Awareness and Higher Cost Restraints the Market's Growth Especially in Developing Countries.
8. Can you provide examples of recent developments in the market?
March 2022 : Gandhinagar Municipal Corporation, Gujrat, started the installation of IoT-enabled underground bins. These bins are equipped with remote-fill level sensors, enabling underground bins to alert the central command and control center to send the garbage collection vehicle when it is 70% full.
9. What pricing options are available for accessing the report?
Pricing options include single-user, multi-user, and enterprise licenses priced at USD 4750, USD 5250, and USD 8750 respectively.
10. Is the market size provided in terms of value or volume?
The market size is provided in terms of value, measured in Million.
11. Are there any specific market keywords associated with the report?
Yes, the market keyword associated with the report is "Smart Trash Bins Market," which aids in identifying and referencing the specific market segment covered.
12. How do I determine which pricing option suits my needs best?
The pricing options vary based on user requirements and access needs. Individual users may opt for single-user licenses, while businesses requiring broader access may choose multi-user or enterprise licenses for cost-effective access to the report.
13. Are there any additional resources or data provided in the Smart Trash Bins Market report?
While the report offers comprehensive insights, it's advisable to review the specific contents or supplementary materials provided to ascertain if additional resources or data are available.
14. How can I stay updated on further developments or reports in the Smart Trash Bins Market?
To stay informed about further developments, trends, and reports in the Smart Trash Bins Market, consider subscribing to industry newsletters, following relevant companies and organizations, or regularly checking reputable industry news sources and publications.
Methodology
Step 1 - Identification of Relevant Samples Size from Population Database


Step 2 - Approaches for Defining Global Market Size (Value, Volume* & Price*)

Note*: In applicable scenarios
Step 3 - Data Sources
Primary Research
- Web Analytics
- Survey Reports
- Research Institute
- Latest Research Reports
- Opinion Leaders
Secondary Research
- Annual Reports
- White Paper
- Latest Press Release
- Industry Association
- Paid Database
- Investor Presentations

Step 4 - Data Triangulation
Involves using different sources of information in order to increase the validity of a study
These sources are likely to be stakeholders in a program - participants, other researchers, program staff, other community members, and so on.
Then we put all data in single framework & apply various statistical tools to find out the dynamic on the market.
During the analysis stage, feedback from the stakeholder groups would be compared to determine areas of agreement as well as areas of divergence
