

Key Insights
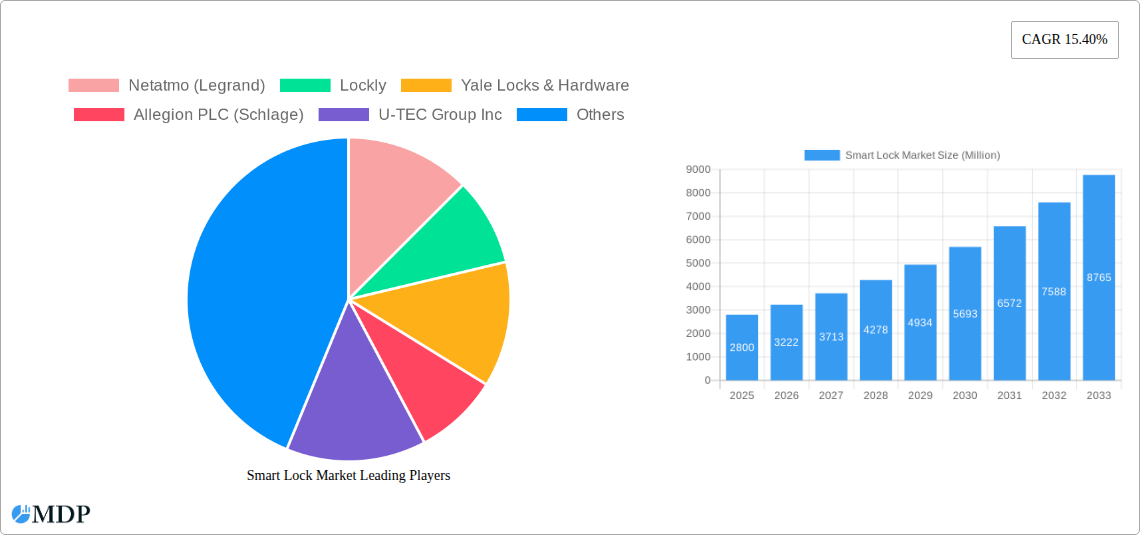
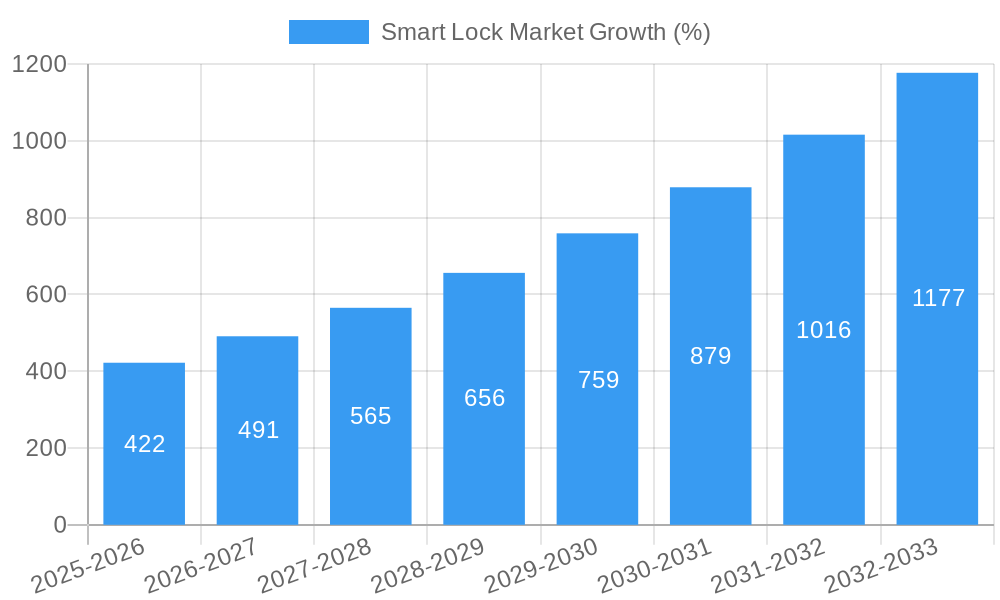
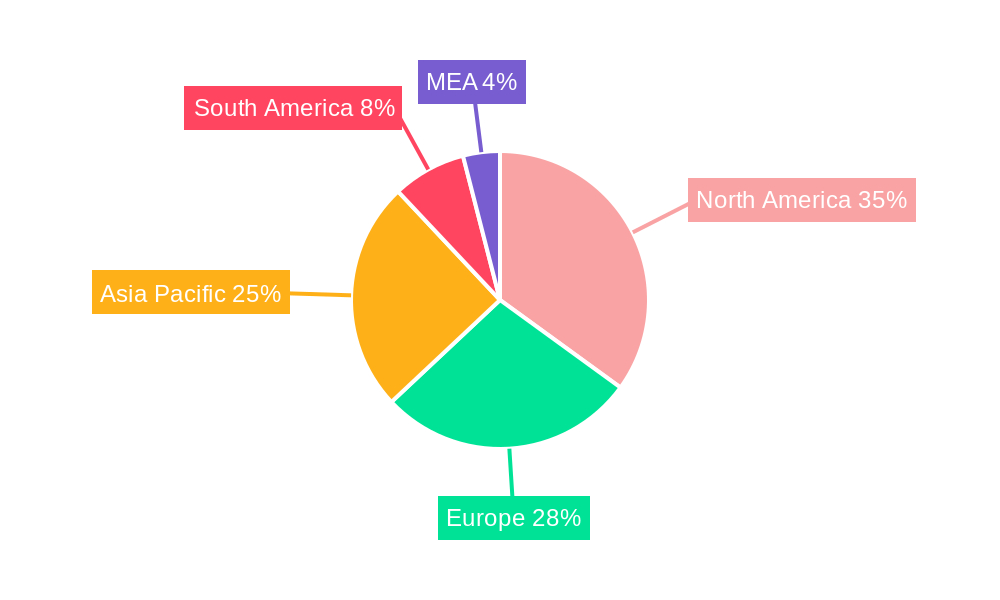
The global smart lock market is experiencing robust growth, projected to reach $2.80 billion in 2025 and maintain a Compound Annual Growth Rate (CAGR) of 15.40% from 2025 to 2033. This expansion is driven by several key factors. Increasing security concerns in residential and commercial settings are fueling demand for enhanced access control solutions. The rising adoption of smart home technology, including integration with home automation systems and voice assistants, is further propelling market growth. Convenience factors, such as remote access and keyless entry, are also significant drivers, particularly among younger demographics. The market is segmented by communication technology (Wi-Fi, Bluetooth, Zigbee, Z-Wave), authentication methods (biometric, PIN code, RFID cards), and end-user applications (commercial, educational institutions & government, industrial). While the North American market currently holds a significant share, rapid technological advancements and increasing disposable incomes in regions like Asia-Pacific are expected to drive substantial growth in these areas over the forecast period. Competition is intense, with established players like Legrand (Netatmo), Yale, Allegion (Schlage), and Spectrum Brands (Kwikset) vying for market share alongside innovative companies like Lockly and Nuki. The market's growth trajectory is expected to remain positive, fueled by ongoing technological innovation and the expanding adoption of smart home solutions globally.
Technological advancements are continuously shaping the smart lock landscape. The integration of advanced features such as facial recognition, voice control, and improved encryption protocols enhances security and user experience. The development of more energy-efficient smart locks and the rise of cloud-based access management systems are also key trends. However, challenges remain, including concerns about data privacy and security breaches, the relatively high initial cost of installation for some systems, and the potential for technical glitches or compatibility issues with existing infrastructure. Overcoming these hurdles will be crucial for sustained market expansion. The diverse range of products and features available caters to a broad spectrum of consumer preferences and needs, promoting further market penetration across various residential and commercial applications.
Smart Lock Market Report: 2019-2033 Forecast
This comprehensive report provides an in-depth analysis of the global Smart Lock Market, covering the period 2019-2033. With a focus on market dynamics, technological advancements, and competitive landscapes, this report is an essential resource for industry stakeholders, investors, and strategic decision-makers. The report incorporates key market metrics, including CAGR, market penetration, and M&A activity, providing actionable insights for informed business strategies. The total market size is projected to reach xx Million by 2033.
Smart Lock Market Dynamics & Concentration
The Smart Lock Market is characterized by a moderately concentrated landscape, with several key players vying for market share. Innovation drives market growth, with new features such as wireless charging and enhanced security protocols constantly emerging. Regulatory frameworks surrounding data privacy and security play a crucial role, impacting product development and market access. Product substitutes, including traditional key-based locks, continue to exist, albeit with diminishing market share. End-user trends indicate a preference for convenience and enhanced security, fueling demand for smart locks across various sectors. M&A activity within the market is moderate, with several strategic acquisitions aimed at expanding product portfolios and market reach.
- Market Concentration: The top 5 players account for approximately xx% of the global market share (2024).
- Innovation Drivers: Advancements in communication technologies (Wi-Fi, Bluetooth, Zigbee, Z-Wave), biometric authentication, and improved security features are key drivers.
- Regulatory Frameworks: Data privacy regulations (e.g., GDPR, CCPA) influence product design and data handling practices.
- Product Substitutes: Traditional mechanical locks represent a declining but persistent substitute.
- End-User Trends: Growing demand for convenient and secure access solutions across commercial and residential applications.
- M&A Activity: xx M&A deals were recorded in the market between 2019 and 2024.
Smart Lock Market Industry Trends & Analysis
The Smart Lock Market exhibits robust growth, driven by several key factors. Increasing adoption of smart home technologies, coupled with rising concerns over security, is significantly boosting market demand. Technological disruptions, such as the integration of AI and IoT capabilities, are enhancing the functionality and appeal of smart locks. Consumer preferences are shifting towards seamless user experiences, demanding intuitive interfaces and increased interoperability with other smart home devices. Competitive dynamics are intense, with key players focusing on product differentiation, strategic partnerships, and innovative marketing strategies. The market is expected to witness a CAGR of xx% during the forecast period (2025-2033), with significant market penetration in developed regions.
Leading Markets & Segments in Smart Lock Market
The North American region holds a dominant position in the Smart Lock Market, driven by high adoption rates in the residential and commercial sectors. Within the segments, Wi-Fi-enabled smart locks represent the largest share of communication technology, owing to their wider range and established infrastructure. Biometric authentication methods are gaining traction, emphasizing user convenience and enhanced security. The commercial sector leads in end-user applications, driven by the need for access control and security in various commercial settings.
- Key Drivers for North American Dominance: Strong consumer adoption, well-developed infrastructure, and high disposable incomes.
- Communication Technology Segment:
- Wi-Fi: xx% market share due to wide availability and long range.
- Bluetooth: xx% market share, preferred for close proximity and low power consumption.
- Zigbee & Z-Wave: xx% market share, suitable for mesh network applications.
- Authentication Method Segment:
- Biometric: Growing market share due to increased security and convenience.
- Pin Code: Maintains a significant market share due to established familiarity.
- RFID Cards: xx% market share, suitable for access control systems.
- End-user Application Segment:
- Commercial: Highest market share due to demand for security and access control.
- Educational & Government: Growing demand for secure and efficient access management.
- Industrial: xx% market share, with applications in specialized access control systems.
Smart Lock Market Product Developments
Recent product innovations include the introduction of remotely charged smart locks (Alfred International Inc. and Wi-Charge collaboration) and Apple Home Key integration (Level Lock+). These advancements emphasize wireless charging capabilities, enhanced security features, and seamless integration with existing smart home ecosystems. The market is seeing a shift toward user-friendly interfaces and increased interoperability, catering to the evolving needs of tech-savvy consumers.
Key Drivers of Smart Lock Market Growth
Technological advancements, such as improved communication protocols and biometric authentication, drive market growth. The increasing adoption of smart home technology and growing consumer demand for enhanced security contribute significantly. Favorable economic conditions and supportive government policies in certain regions further boost market expansion.
Challenges in the Smart Lock Market
Regulatory hurdles concerning data privacy and security pose challenges to market growth. Supply chain disruptions and rising component costs can impact production and pricing. Intense competition from established players and new entrants creates pressure on margins and market share. Estimates suggest that these factors could collectively reduce the market growth by xx% by 2030.
Emerging Opportunities in Smart Lock Market
Technological breakthroughs, such as advanced AI-powered security features and improved energy efficiency, will create new opportunities. Strategic partnerships between smart lock manufacturers and smart home ecosystem providers will drive market expansion. Expansion into emerging markets with growing infrastructure and consumer demand will also contribute to long-term growth.
Leading Players in the Smart Lock Market Sector
- Netatmo (Legrand)
- Lockly
- Yale Locks & Hardware
- Allegion PLC (Schlage)
- U-TEC Group Inc
- Hanman International Pte Ltd
- Nuki Home Solutions
- Kwikset (Spectrum Brands Inc)
- Salto Systems SL
- Dormakaba Group
- August Inc
- Master Lock Company LLC
Key Milestones in Smart Lock Market Industry
- September 2022: Alfred International Inc. and Wi-Charge launch the first over-the-air remotely charged smart locks, setting a new benchmark for convenience and security in commercial real estate.
- October 2022: Level Home Inc. unveils Level Lock+, integrating Apple Home Keys technology for enhanced security and ease of use.
Strategic Outlook for Smart Lock Market
The Smart Lock Market holds significant growth potential driven by technological advancements, expanding smart home adoption, and increasing demand for security solutions. Strategic partnerships, product innovation, and expansion into new markets will be crucial for companies seeking to capitalize on this growth potential. The market is poised for continued expansion, with opportunities for both established players and new entrants to create innovative solutions and capture market share.
Smart Lock Market Segmentation
-
1. Communication Technology
- 1.1. Wi-Fi
- 1.2. Bluetooth
- 1.3. Zigbee
- 1.4. Z-Wave
-
2. Authentication Method
- 2.1. Biometric
- 2.2. Pin Code
- 2.3. RFID Cards
-
3. End-user Application
- 3.1. Commercial
- 3.2. Educational Institutions & Government
- 3.3. Industrial
Smart Lock Market Segmentation By Geography
- 1. Europe
- 2. Asia Pacific
- 3. North America
- 4. Rest of the World
Smart Lock Market REPORT HIGHLIGHTS
| Aspects | Details |
|---|---|
| Study Period | 2019-2033 |
| Base Year | 2024 |
| Estimated Year | 2025 |
| Forecast Period | 2025-2033 |
| Historical Period | 2019-2024 |
| Growth Rate | CAGR of 15.40% from 2019-2033 |
| Segmentation |
|
Table of Contents
- 1. Introduction
- 1.1. Research Scope
- 1.2. Market Segmentation
- 1.3. Research Methodology
- 1.4. Definitions and Assumptions
- 2. Executive Summary
- 2.1. Introduction
- 3. Market Dynamics
- 3.1. Introduction
- 3.2. Market Drivers
- 3.2.1. Increasing Safety and Security Concerns; Increasing Adoption of Smart Home Architecture
- 3.3. Market Restrains
- 3.3.1. High cost involved in replacing the existing Deep UV with EUV lasers; Monopoly existing within the market
- 3.4. Market Trends
- 3.4.1. Commercial Adoption is Expected to Grow Significantly
- 4. Market Factor Analysis
- 4.1. Porters Five Forces
- 4.2. Supply/Value Chain
- 4.3. PESTEL analysis
- 4.4. Market Entropy
- 4.5. Patent/Trademark Analysis
- 5. Global Smart Lock Market Analysis, Insights and Forecast, 2019-2031
- 5.1. Market Analysis, Insights and Forecast - by Communication Technology
- 5.1.1. Wi-Fi
- 5.1.2. Bluetooth
- 5.1.3. Zigbee
- 5.1.4. Z-Wave
- 5.2. Market Analysis, Insights and Forecast - by Authentication Method
- 5.2.1. Biometric
- 5.2.2. Pin Code
- 5.2.3. RFID Cards
- 5.3. Market Analysis, Insights and Forecast - by End-user Application
- 5.3.1. Commercial
- 5.3.2. Educational Institutions & Government
- 5.3.3. Industrial
- 5.4. Market Analysis, Insights and Forecast - by Region
- 5.4.1. Europe
- 5.4.2. Asia Pacific
- 5.4.3. North America
- 5.4.4. Rest of the World
- 5.1. Market Analysis, Insights and Forecast - by Communication Technology
- 6. Europe Smart Lock Market Analysis, Insights and Forecast, 2019-2031
- 6.1. Market Analysis, Insights and Forecast - by Communication Technology
- 6.1.1. Wi-Fi
- 6.1.2. Bluetooth
- 6.1.3. Zigbee
- 6.1.4. Z-Wave
- 6.2. Market Analysis, Insights and Forecast - by Authentication Method
- 6.2.1. Biometric
- 6.2.2. Pin Code
- 6.2.3. RFID Cards
- 6.3. Market Analysis, Insights and Forecast - by End-user Application
- 6.3.1. Commercial
- 6.3.2. Educational Institutions & Government
- 6.3.3. Industrial
- 6.1. Market Analysis, Insights and Forecast - by Communication Technology
- 7. Asia Pacific Smart Lock Market Analysis, Insights and Forecast, 2019-2031
- 7.1. Market Analysis, Insights and Forecast - by Communication Technology
- 7.1.1. Wi-Fi
- 7.1.2. Bluetooth
- 7.1.3. Zigbee
- 7.1.4. Z-Wave
- 7.2. Market Analysis, Insights and Forecast - by Authentication Method
- 7.2.1. Biometric
- 7.2.2. Pin Code
- 7.2.3. RFID Cards
- 7.3. Market Analysis, Insights and Forecast - by End-user Application
- 7.3.1. Commercial
- 7.3.2. Educational Institutions & Government
- 7.3.3. Industrial
- 7.1. Market Analysis, Insights and Forecast - by Communication Technology
- 8. North America Smart Lock Market Analysis, Insights and Forecast, 2019-2031
- 8.1. Market Analysis, Insights and Forecast - by Communication Technology
- 8.1.1. Wi-Fi
- 8.1.2. Bluetooth
- 8.1.3. Zigbee
- 8.1.4. Z-Wave
- 8.2. Market Analysis, Insights and Forecast - by Authentication Method
- 8.2.1. Biometric
- 8.2.2. Pin Code
- 8.2.3. RFID Cards
- 8.3. Market Analysis, Insights and Forecast - by End-user Application
- 8.3.1. Commercial
- 8.3.2. Educational Institutions & Government
- 8.3.3. Industrial
- 8.1. Market Analysis, Insights and Forecast - by Communication Technology
- 9. Rest of the World Smart Lock Market Analysis, Insights and Forecast, 2019-2031
- 9.1. Market Analysis, Insights and Forecast - by Communication Technology
- 9.1.1. Wi-Fi
- 9.1.2. Bluetooth
- 9.1.3. Zigbee
- 9.1.4. Z-Wave
- 9.2. Market Analysis, Insights and Forecast - by Authentication Method
- 9.2.1. Biometric
- 9.2.2. Pin Code
- 9.2.3. RFID Cards
- 9.3. Market Analysis, Insights and Forecast - by End-user Application
- 9.3.1. Commercial
- 9.3.2. Educational Institutions & Government
- 9.3.3. Industrial
- 9.1. Market Analysis, Insights and Forecast - by Communication Technology
- 10. North America Smart Lock Market Analysis, Insights and Forecast, 2019-2031
- 10.1. Market Analysis, Insights and Forecast - By Country/Sub-region
- 10.1.1 United States
- 10.1.2 Canada
- 10.1.3 Mexico
- 11. Europe Smart Lock Market Analysis, Insights and Forecast, 2019-2031
- 11.1. Market Analysis, Insights and Forecast - By Country/Sub-region
- 11.1.1 Germany
- 11.1.2 United Kingdom
- 11.1.3 France
- 11.1.4 Spain
- 11.1.5 Italy
- 11.1.6 Spain
- 11.1.7 Belgium
- 11.1.8 Netherland
- 11.1.9 Nordics
- 11.1.10 Rest of Europe
- 12. Asia Pacific Smart Lock Market Analysis, Insights and Forecast, 2019-2031
- 12.1. Market Analysis, Insights and Forecast - By Country/Sub-region
- 12.1.1 China
- 12.1.2 Japan
- 12.1.3 India
- 12.1.4 South Korea
- 12.1.5 Southeast Asia
- 12.1.6 Australia
- 12.1.7 Indonesia
- 12.1.8 Phillipes
- 12.1.9 Singapore
- 12.1.10 Thailandc
- 12.1.11 Rest of Asia Pacific
- 13. South America Smart Lock Market Analysis, Insights and Forecast, 2019-2031
- 13.1. Market Analysis, Insights and Forecast - By Country/Sub-region
- 13.1.1 Brazil
- 13.1.2 Argentina
- 13.1.3 Peru
- 13.1.4 Chile
- 13.1.5 Colombia
- 13.1.6 Ecuador
- 13.1.7 Venezuela
- 13.1.8 Rest of South America
- 14. North America Smart Lock Market Analysis, Insights and Forecast, 2019-2031
- 14.1. Market Analysis, Insights and Forecast - By Country/Sub-region
- 14.1.1 United States
- 14.1.2 Canada
- 14.1.3 Mexico
- 15. MEA Smart Lock Market Analysis, Insights and Forecast, 2019-2031
- 15.1. Market Analysis, Insights and Forecast - By Country/Sub-region
- 15.1.1 United Arab Emirates
- 15.1.2 Saudi Arabia
- 15.1.3 South Africa
- 15.1.4 Rest of Middle East and Africa
- 16. Competitive Analysis
- 16.1. Global Market Share Analysis 2024
- 16.2. Company Profiles
- 16.2.1 Netatmo (Legrand)
- 16.2.1.1. Overview
- 16.2.1.2. Products
- 16.2.1.3. SWOT Analysis
- 16.2.1.4. Recent Developments
- 16.2.1.5. Financials (Based on Availability)
- 16.2.2 Lockly
- 16.2.2.1. Overview
- 16.2.2.2. Products
- 16.2.2.3. SWOT Analysis
- 16.2.2.4. Recent Developments
- 16.2.2.5. Financials (Based on Availability)
- 16.2.3 Yale Locks & Hardware
- 16.2.3.1. Overview
- 16.2.3.2. Products
- 16.2.3.3. SWOT Analysis
- 16.2.3.4. Recent Developments
- 16.2.3.5. Financials (Based on Availability)
- 16.2.4 Allegion PLC (Schlage)
- 16.2.4.1. Overview
- 16.2.4.2. Products
- 16.2.4.3. SWOT Analysis
- 16.2.4.4. Recent Developments
- 16.2.4.5. Financials (Based on Availability)
- 16.2.5 U-TEC Group Inc
- 16.2.5.1. Overview
- 16.2.5.2. Products
- 16.2.5.3. SWOT Analysis
- 16.2.5.4. Recent Developments
- 16.2.5.5. Financials (Based on Availability)
- 16.2.6 Hanman International Pte Ltd
- 16.2.6.1. Overview
- 16.2.6.2. Products
- 16.2.6.3. SWOT Analysis
- 16.2.6.4. Recent Developments
- 16.2.6.5. Financials (Based on Availability)
- 16.2.7 Nuki Home Solutions
- 16.2.7.1. Overview
- 16.2.7.2. Products
- 16.2.7.3. SWOT Analysis
- 16.2.7.4. Recent Developments
- 16.2.7.5. Financials (Based on Availability)
- 16.2.8 Kwikset (Spectrum Brands Inc )
- 16.2.8.1. Overview
- 16.2.8.2. Products
- 16.2.8.3. SWOT Analysis
- 16.2.8.4. Recent Developments
- 16.2.8.5. Financials (Based on Availability)
- 16.2.9 Salto Systems SL
- 16.2.9.1. Overview
- 16.2.9.2. Products
- 16.2.9.3. SWOT Analysis
- 16.2.9.4. Recent Developments
- 16.2.9.5. Financials (Based on Availability)
- 16.2.10 Dormakaba Group
- 16.2.10.1. Overview
- 16.2.10.2. Products
- 16.2.10.3. SWOT Analysis
- 16.2.10.4. Recent Developments
- 16.2.10.5. Financials (Based on Availability)
- 16.2.11 August Inc
- 16.2.11.1. Overview
- 16.2.11.2. Products
- 16.2.11.3. SWOT Analysis
- 16.2.11.4. Recent Developments
- 16.2.11.5. Financials (Based on Availability)
- 16.2.12 Master Lock Company LLC
- 16.2.12.1. Overview
- 16.2.12.2. Products
- 16.2.12.3. SWOT Analysis
- 16.2.12.4. Recent Developments
- 16.2.12.5. Financials (Based on Availability)
- 16.2.1 Netatmo (Legrand)
List of Figures
- Figure 1: Global Smart Lock Market Revenue Breakdown (Million, %) by Region 2024 & 2032
- Figure 2: Global Smart Lock Market Volume Breakdown (K Unit, %) by Region 2024 & 2032
- Figure 3: North America Smart Lock Market Revenue (Million), by Country 2024 & 2032
- Figure 4: North America Smart Lock Market Volume (K Unit), by Country 2024 & 2032
- Figure 5: North America Smart Lock Market Revenue Share (%), by Country 2024 & 2032
- Figure 6: North America Smart Lock Market Volume Share (%), by Country 2024 & 2032
- Figure 7: Europe Smart Lock Market Revenue (Million), by Country 2024 & 2032
- Figure 8: Europe Smart Lock Market Volume (K Unit), by Country 2024 & 2032
- Figure 9: Europe Smart Lock Market Revenue Share (%), by Country 2024 & 2032
- Figure 10: Europe Smart Lock Market Volume Share (%), by Country 2024 & 2032
- Figure 11: Asia Pacific Smart Lock Market Revenue (Million), by Country 2024 & 2032
- Figure 12: Asia Pacific Smart Lock Market Volume (K Unit), by Country 2024 & 2032
- Figure 13: Asia Pacific Smart Lock Market Revenue Share (%), by Country 2024 & 2032
- Figure 14: Asia Pacific Smart Lock Market Volume Share (%), by Country 2024 & 2032
- Figure 15: South America Smart Lock Market Revenue (Million), by Country 2024 & 2032
- Figure 16: South America Smart Lock Market Volume (K Unit), by Country 2024 & 2032
- Figure 17: South America Smart Lock Market Revenue Share (%), by Country 2024 & 2032
- Figure 18: South America Smart Lock Market Volume Share (%), by Country 2024 & 2032
- Figure 19: North America Smart Lock Market Revenue (Million), by Country 2024 & 2032
- Figure 20: North America Smart Lock Market Volume (K Unit), by Country 2024 & 2032
- Figure 21: North America Smart Lock Market Revenue Share (%), by Country 2024 & 2032
- Figure 22: North America Smart Lock Market Volume Share (%), by Country 2024 & 2032
- Figure 23: MEA Smart Lock Market Revenue (Million), by Country 2024 & 2032
- Figure 24: MEA Smart Lock Market Volume (K Unit), by Country 2024 & 2032
- Figure 25: MEA Smart Lock Market Revenue Share (%), by Country 2024 & 2032
- Figure 26: MEA Smart Lock Market Volume Share (%), by Country 2024 & 2032
- Figure 27: Europe Smart Lock Market Revenue (Million), by Communication Technology 2024 & 2032
- Figure 28: Europe Smart Lock Market Volume (K Unit), by Communication Technology 2024 & 2032
- Figure 29: Europe Smart Lock Market Revenue Share (%), by Communication Technology 2024 & 2032
- Figure 30: Europe Smart Lock Market Volume Share (%), by Communication Technology 2024 & 2032
- Figure 31: Europe Smart Lock Market Revenue (Million), by Authentication Method 2024 & 2032
- Figure 32: Europe Smart Lock Market Volume (K Unit), by Authentication Method 2024 & 2032
- Figure 33: Europe Smart Lock Market Revenue Share (%), by Authentication Method 2024 & 2032
- Figure 34: Europe Smart Lock Market Volume Share (%), by Authentication Method 2024 & 2032
- Figure 35: Europe Smart Lock Market Revenue (Million), by End-user Application 2024 & 2032
- Figure 36: Europe Smart Lock Market Volume (K Unit), by End-user Application 2024 & 2032
- Figure 37: Europe Smart Lock Market Revenue Share (%), by End-user Application 2024 & 2032
- Figure 38: Europe Smart Lock Market Volume Share (%), by End-user Application 2024 & 2032
- Figure 39: Europe Smart Lock Market Revenue (Million), by Country 2024 & 2032
- Figure 40: Europe Smart Lock Market Volume (K Unit), by Country 2024 & 2032
- Figure 41: Europe Smart Lock Market Revenue Share (%), by Country 2024 & 2032
- Figure 42: Europe Smart Lock Market Volume Share (%), by Country 2024 & 2032
- Figure 43: Asia Pacific Smart Lock Market Revenue (Million), by Communication Technology 2024 & 2032
- Figure 44: Asia Pacific Smart Lock Market Volume (K Unit), by Communication Technology 2024 & 2032
- Figure 45: Asia Pacific Smart Lock Market Revenue Share (%), by Communication Technology 2024 & 2032
- Figure 46: Asia Pacific Smart Lock Market Volume Share (%), by Communication Technology 2024 & 2032
- Figure 47: Asia Pacific Smart Lock Market Revenue (Million), by Authentication Method 2024 & 2032
- Figure 48: Asia Pacific Smart Lock Market Volume (K Unit), by Authentication Method 2024 & 2032
- Figure 49: Asia Pacific Smart Lock Market Revenue Share (%), by Authentication Method 2024 & 2032
- Figure 50: Asia Pacific Smart Lock Market Volume Share (%), by Authentication Method 2024 & 2032
- Figure 51: Asia Pacific Smart Lock Market Revenue (Million), by End-user Application 2024 & 2032
- Figure 52: Asia Pacific Smart Lock Market Volume (K Unit), by End-user Application 2024 & 2032
- Figure 53: Asia Pacific Smart Lock Market Revenue Share (%), by End-user Application 2024 & 2032
- Figure 54: Asia Pacific Smart Lock Market Volume Share (%), by End-user Application 2024 & 2032
- Figure 55: Asia Pacific Smart Lock Market Revenue (Million), by Country 2024 & 2032
- Figure 56: Asia Pacific Smart Lock Market Volume (K Unit), by Country 2024 & 2032
- Figure 57: Asia Pacific Smart Lock Market Revenue Share (%), by Country 2024 & 2032
- Figure 58: Asia Pacific Smart Lock Market Volume Share (%), by Country 2024 & 2032
- Figure 59: North America Smart Lock Market Revenue (Million), by Communication Technology 2024 & 2032
- Figure 60: North America Smart Lock Market Volume (K Unit), by Communication Technology 2024 & 2032
- Figure 61: North America Smart Lock Market Revenue Share (%), by Communication Technology 2024 & 2032
- Figure 62: North America Smart Lock Market Volume Share (%), by Communication Technology 2024 & 2032
- Figure 63: North America Smart Lock Market Revenue (Million), by Authentication Method 2024 & 2032
- Figure 64: North America Smart Lock Market Volume (K Unit), by Authentication Method 2024 & 2032
- Figure 65: North America Smart Lock Market Revenue Share (%), by Authentication Method 2024 & 2032
- Figure 66: North America Smart Lock Market Volume Share (%), by Authentication Method 2024 & 2032
- Figure 67: North America Smart Lock Market Revenue (Million), by End-user Application 2024 & 2032
- Figure 68: North America Smart Lock Market Volume (K Unit), by End-user Application 2024 & 2032
- Figure 69: North America Smart Lock Market Revenue Share (%), by End-user Application 2024 & 2032
- Figure 70: North America Smart Lock Market Volume Share (%), by End-user Application 2024 & 2032
- Figure 71: North America Smart Lock Market Revenue (Million), by Country 2024 & 2032
- Figure 72: North America Smart Lock Market Volume (K Unit), by Country 2024 & 2032
- Figure 73: North America Smart Lock Market Revenue Share (%), by Country 2024 & 2032
- Figure 74: North America Smart Lock Market Volume Share (%), by Country 2024 & 2032
- Figure 75: Rest of the World Smart Lock Market Revenue (Million), by Communication Technology 2024 & 2032
- Figure 76: Rest of the World Smart Lock Market Volume (K Unit), by Communication Technology 2024 & 2032
- Figure 77: Rest of the World Smart Lock Market Revenue Share (%), by Communication Technology 2024 & 2032
- Figure 78: Rest of the World Smart Lock Market Volume Share (%), by Communication Technology 2024 & 2032
- Figure 79: Rest of the World Smart Lock Market Revenue (Million), by Authentication Method 2024 & 2032
- Figure 80: Rest of the World Smart Lock Market Volume (K Unit), by Authentication Method 2024 & 2032
- Figure 81: Rest of the World Smart Lock Market Revenue Share (%), by Authentication Method 2024 & 2032
- Figure 82: Rest of the World Smart Lock Market Volume Share (%), by Authentication Method 2024 & 2032
- Figure 83: Rest of the World Smart Lock Market Revenue (Million), by End-user Application 2024 & 2032
- Figure 84: Rest of the World Smart Lock Market Volume (K Unit), by End-user Application 2024 & 2032
- Figure 85: Rest of the World Smart Lock Market Revenue Share (%), by End-user Application 2024 & 2032
- Figure 86: Rest of the World Smart Lock Market Volume Share (%), by End-user Application 2024 & 2032
- Figure 87: Rest of the World Smart Lock Market Revenue (Million), by Country 2024 & 2032
- Figure 88: Rest of the World Smart Lock Market Volume (K Unit), by Country 2024 & 2032
- Figure 89: Rest of the World Smart Lock Market Revenue Share (%), by Country 2024 & 2032
- Figure 90: Rest of the World Smart Lock Market Volume Share (%), by Country 2024 & 2032
List of Tables
- Table 1: Global Smart Lock Market Revenue Million Forecast, by Region 2019 & 2032
- Table 2: Global Smart Lock Market Volume K Unit Forecast, by Region 2019 & 2032
- Table 3: Global Smart Lock Market Revenue Million Forecast, by Communication Technology 2019 & 2032
- Table 4: Global Smart Lock Market Volume K Unit Forecast, by Communication Technology 2019 & 2032
- Table 5: Global Smart Lock Market Revenue Million Forecast, by Authentication Method 2019 & 2032
- Table 6: Global Smart Lock Market Volume K Unit Forecast, by Authentication Method 2019 & 2032
- Table 7: Global Smart Lock Market Revenue Million Forecast, by End-user Application 2019 & 2032
- Table 8: Global Smart Lock Market Volume K Unit Forecast, by End-user Application 2019 & 2032
- Table 9: Global Smart Lock Market Revenue Million Forecast, by Region 2019 & 2032
- Table 10: Global Smart Lock Market Volume K Unit Forecast, by Region 2019 & 2032
- Table 11: Global Smart Lock Market Revenue Million Forecast, by Country 2019 & 2032
- Table 12: Global Smart Lock Market Volume K Unit Forecast, by Country 2019 & 2032
- Table 13: United States Smart Lock Market Revenue (Million) Forecast, by Application 2019 & 2032
- Table 14: United States Smart Lock Market Volume (K Unit) Forecast, by Application 2019 & 2032
- Table 15: Canada Smart Lock Market Revenue (Million) Forecast, by Application 2019 & 2032
- Table 16: Canada Smart Lock Market Volume (K Unit) Forecast, by Application 2019 & 2032
- Table 17: Mexico Smart Lock Market Revenue (Million) Forecast, by Application 2019 & 2032
- Table 18: Mexico Smart Lock Market Volume (K Unit) Forecast, by Application 2019 & 2032
- Table 19: Global Smart Lock Market Revenue Million Forecast, by Country 2019 & 2032
- Table 20: Global Smart Lock Market Volume K Unit Forecast, by Country 2019 & 2032
- Table 21: Germany Smart Lock Market Revenue (Million) Forecast, by Application 2019 & 2032
- Table 22: Germany Smart Lock Market Volume (K Unit) Forecast, by Application 2019 & 2032
- Table 23: United Kingdom Smart Lock Market Revenue (Million) Forecast, by Application 2019 & 2032
- Table 24: United Kingdom Smart Lock Market Volume (K Unit) Forecast, by Application 2019 & 2032
- Table 25: France Smart Lock Market Revenue (Million) Forecast, by Application 2019 & 2032
- Table 26: France Smart Lock Market Volume (K Unit) Forecast, by Application 2019 & 2032
- Table 27: Spain Smart Lock Market Revenue (Million) Forecast, by Application 2019 & 2032
- Table 28: Spain Smart Lock Market Volume (K Unit) Forecast, by Application 2019 & 2032
- Table 29: Italy Smart Lock Market Revenue (Million) Forecast, by Application 2019 & 2032
- Table 30: Italy Smart Lock Market Volume (K Unit) Forecast, by Application 2019 & 2032
- Table 31: Spain Smart Lock Market Revenue (Million) Forecast, by Application 2019 & 2032
- Table 32: Spain Smart Lock Market Volume (K Unit) Forecast, by Application 2019 & 2032
- Table 33: Belgium Smart Lock Market Revenue (Million) Forecast, by Application 2019 & 2032
- Table 34: Belgium Smart Lock Market Volume (K Unit) Forecast, by Application 2019 & 2032
- Table 35: Netherland Smart Lock Market Revenue (Million) Forecast, by Application 2019 & 2032
- Table 36: Netherland Smart Lock Market Volume (K Unit) Forecast, by Application 2019 & 2032
- Table 37: Nordics Smart Lock Market Revenue (Million) Forecast, by Application 2019 & 2032
- Table 38: Nordics Smart Lock Market Volume (K Unit) Forecast, by Application 2019 & 2032
- Table 39: Rest of Europe Smart Lock Market Revenue (Million) Forecast, by Application 2019 & 2032
- Table 40: Rest of Europe Smart Lock Market Volume (K Unit) Forecast, by Application 2019 & 2032
- Table 41: Global Smart Lock Market Revenue Million Forecast, by Country 2019 & 2032
- Table 42: Global Smart Lock Market Volume K Unit Forecast, by Country 2019 & 2032
- Table 43: China Smart Lock Market Revenue (Million) Forecast, by Application 2019 & 2032
- Table 44: China Smart Lock Market Volume (K Unit) Forecast, by Application 2019 & 2032
- Table 45: Japan Smart Lock Market Revenue (Million) Forecast, by Application 2019 & 2032
- Table 46: Japan Smart Lock Market Volume (K Unit) Forecast, by Application 2019 & 2032
- Table 47: India Smart Lock Market Revenue (Million) Forecast, by Application 2019 & 2032
- Table 48: India Smart Lock Market Volume (K Unit) Forecast, by Application 2019 & 2032
- Table 49: South Korea Smart Lock Market Revenue (Million) Forecast, by Application 2019 & 2032
- Table 50: South Korea Smart Lock Market Volume (K Unit) Forecast, by Application 2019 & 2032
- Table 51: Southeast Asia Smart Lock Market Revenue (Million) Forecast, by Application 2019 & 2032
- Table 52: Southeast Asia Smart Lock Market Volume (K Unit) Forecast, by Application 2019 & 2032
- Table 53: Australia Smart Lock Market Revenue (Million) Forecast, by Application 2019 & 2032
- Table 54: Australia Smart Lock Market Volume (K Unit) Forecast, by Application 2019 & 2032
- Table 55: Indonesia Smart Lock Market Revenue (Million) Forecast, by Application 2019 & 2032
- Table 56: Indonesia Smart Lock Market Volume (K Unit) Forecast, by Application 2019 & 2032
- Table 57: Phillipes Smart Lock Market Revenue (Million) Forecast, by Application 2019 & 2032
- Table 58: Phillipes Smart Lock Market Volume (K Unit) Forecast, by Application 2019 & 2032
- Table 59: Singapore Smart Lock Market Revenue (Million) Forecast, by Application 2019 & 2032
- Table 60: Singapore Smart Lock Market Volume (K Unit) Forecast, by Application 2019 & 2032
- Table 61: Thailandc Smart Lock Market Revenue (Million) Forecast, by Application 2019 & 2032
- Table 62: Thailandc Smart Lock Market Volume (K Unit) Forecast, by Application 2019 & 2032
- Table 63: Rest of Asia Pacific Smart Lock Market Revenue (Million) Forecast, by Application 2019 & 2032
- Table 64: Rest of Asia Pacific Smart Lock Market Volume (K Unit) Forecast, by Application 2019 & 2032
- Table 65: Global Smart Lock Market Revenue Million Forecast, by Country 2019 & 2032
- Table 66: Global Smart Lock Market Volume K Unit Forecast, by Country 2019 & 2032
- Table 67: Brazil Smart Lock Market Revenue (Million) Forecast, by Application 2019 & 2032
- Table 68: Brazil Smart Lock Market Volume (K Unit) Forecast, by Application 2019 & 2032
- Table 69: Argentina Smart Lock Market Revenue (Million) Forecast, by Application 2019 & 2032
- Table 70: Argentina Smart Lock Market Volume (K Unit) Forecast, by Application 2019 & 2032
- Table 71: Peru Smart Lock Market Revenue (Million) Forecast, by Application 2019 & 2032
- Table 72: Peru Smart Lock Market Volume (K Unit) Forecast, by Application 2019 & 2032
- Table 73: Chile Smart Lock Market Revenue (Million) Forecast, by Application 2019 & 2032
- Table 74: Chile Smart Lock Market Volume (K Unit) Forecast, by Application 2019 & 2032
- Table 75: Colombia Smart Lock Market Revenue (Million) Forecast, by Application 2019 & 2032
- Table 76: Colombia Smart Lock Market Volume (K Unit) Forecast, by Application 2019 & 2032
- Table 77: Ecuador Smart Lock Market Revenue (Million) Forecast, by Application 2019 & 2032
- Table 78: Ecuador Smart Lock Market Volume (K Unit) Forecast, by Application 2019 & 2032
- Table 79: Venezuela Smart Lock Market Revenue (Million) Forecast, by Application 2019 & 2032
- Table 80: Venezuela Smart Lock Market Volume (K Unit) Forecast, by Application 2019 & 2032
- Table 81: Rest of South America Smart Lock Market Revenue (Million) Forecast, by Application 2019 & 2032
- Table 82: Rest of South America Smart Lock Market Volume (K Unit) Forecast, by Application 2019 & 2032
- Table 83: Global Smart Lock Market Revenue Million Forecast, by Country 2019 & 2032
- Table 84: Global Smart Lock Market Volume K Unit Forecast, by Country 2019 & 2032
- Table 85: United States Smart Lock Market Revenue (Million) Forecast, by Application 2019 & 2032
- Table 86: United States Smart Lock Market Volume (K Unit) Forecast, by Application 2019 & 2032
- Table 87: Canada Smart Lock Market Revenue (Million) Forecast, by Application 2019 & 2032
- Table 88: Canada Smart Lock Market Volume (K Unit) Forecast, by Application 2019 & 2032
- Table 89: Mexico Smart Lock Market Revenue (Million) Forecast, by Application 2019 & 2032
- Table 90: Mexico Smart Lock Market Volume (K Unit) Forecast, by Application 2019 & 2032
- Table 91: Global Smart Lock Market Revenue Million Forecast, by Country 2019 & 2032
- Table 92: Global Smart Lock Market Volume K Unit Forecast, by Country 2019 & 2032
- Table 93: United Arab Emirates Smart Lock Market Revenue (Million) Forecast, by Application 2019 & 2032
- Table 94: United Arab Emirates Smart Lock Market Volume (K Unit) Forecast, by Application 2019 & 2032
- Table 95: Saudi Arabia Smart Lock Market Revenue (Million) Forecast, by Application 2019 & 2032
- Table 96: Saudi Arabia Smart Lock Market Volume (K Unit) Forecast, by Application 2019 & 2032
- Table 97: South Africa Smart Lock Market Revenue (Million) Forecast, by Application 2019 & 2032
- Table 98: South Africa Smart Lock Market Volume (K Unit) Forecast, by Application 2019 & 2032
- Table 99: Rest of Middle East and Africa Smart Lock Market Revenue (Million) Forecast, by Application 2019 & 2032
- Table 100: Rest of Middle East and Africa Smart Lock Market Volume (K Unit) Forecast, by Application 2019 & 2032
- Table 101: Global Smart Lock Market Revenue Million Forecast, by Communication Technology 2019 & 2032
- Table 102: Global Smart Lock Market Volume K Unit Forecast, by Communication Technology 2019 & 2032
- Table 103: Global Smart Lock Market Revenue Million Forecast, by Authentication Method 2019 & 2032
- Table 104: Global Smart Lock Market Volume K Unit Forecast, by Authentication Method 2019 & 2032
- Table 105: Global Smart Lock Market Revenue Million Forecast, by End-user Application 2019 & 2032
- Table 106: Global Smart Lock Market Volume K Unit Forecast, by End-user Application 2019 & 2032
- Table 107: Global Smart Lock Market Revenue Million Forecast, by Country 2019 & 2032
- Table 108: Global Smart Lock Market Volume K Unit Forecast, by Country 2019 & 2032
- Table 109: Global Smart Lock Market Revenue Million Forecast, by Communication Technology 2019 & 2032
- Table 110: Global Smart Lock Market Volume K Unit Forecast, by Communication Technology 2019 & 2032
- Table 111: Global Smart Lock Market Revenue Million Forecast, by Authentication Method 2019 & 2032
- Table 112: Global Smart Lock Market Volume K Unit Forecast, by Authentication Method 2019 & 2032
- Table 113: Global Smart Lock Market Revenue Million Forecast, by End-user Application 2019 & 2032
- Table 114: Global Smart Lock Market Volume K Unit Forecast, by End-user Application 2019 & 2032
- Table 115: Global Smart Lock Market Revenue Million Forecast, by Country 2019 & 2032
- Table 116: Global Smart Lock Market Volume K Unit Forecast, by Country 2019 & 2032
- Table 117: Global Smart Lock Market Revenue Million Forecast, by Communication Technology 2019 & 2032
- Table 118: Global Smart Lock Market Volume K Unit Forecast, by Communication Technology 2019 & 2032
- Table 119: Global Smart Lock Market Revenue Million Forecast, by Authentication Method 2019 & 2032
- Table 120: Global Smart Lock Market Volume K Unit Forecast, by Authentication Method 2019 & 2032
- Table 121: Global Smart Lock Market Revenue Million Forecast, by End-user Application 2019 & 2032
- Table 122: Global Smart Lock Market Volume K Unit Forecast, by End-user Application 2019 & 2032
- Table 123: Global Smart Lock Market Revenue Million Forecast, by Country 2019 & 2032
- Table 124: Global Smart Lock Market Volume K Unit Forecast, by Country 2019 & 2032
- Table 125: Global Smart Lock Market Revenue Million Forecast, by Communication Technology 2019 & 2032
- Table 126: Global Smart Lock Market Volume K Unit Forecast, by Communication Technology 2019 & 2032
- Table 127: Global Smart Lock Market Revenue Million Forecast, by Authentication Method 2019 & 2032
- Table 128: Global Smart Lock Market Volume K Unit Forecast, by Authentication Method 2019 & 2032
- Table 129: Global Smart Lock Market Revenue Million Forecast, by End-user Application 2019 & 2032
- Table 130: Global Smart Lock Market Volume K Unit Forecast, by End-user Application 2019 & 2032
- Table 131: Global Smart Lock Market Revenue Million Forecast, by Country 2019 & 2032
- Table 132: Global Smart Lock Market Volume K Unit Forecast, by Country 2019 & 2032
Frequently Asked Questions
1. What is the projected Compound Annual Growth Rate (CAGR) of the Smart Lock Market?
The projected CAGR is approximately 15.40%.
2. Which companies are prominent players in the Smart Lock Market?
Key companies in the market include Netatmo (Legrand), Lockly, Yale Locks & Hardware, Allegion PLC (Schlage), U-TEC Group Inc, Hanman International Pte Ltd, Nuki Home Solutions, Kwikset (Spectrum Brands Inc ), Salto Systems SL, Dormakaba Group, August Inc, Master Lock Company LLC.
3. What are the main segments of the Smart Lock Market?
The market segments include Communication Technology, Authentication Method, End-user Application.
4. Can you provide details about the market size?
The market size is estimated to be USD 2.80 Million as of 2022.
5. What are some drivers contributing to market growth?
Increasing Safety and Security Concerns; Increasing Adoption of Smart Home Architecture.
6. What are the notable trends driving market growth?
Commercial Adoption is Expected to Grow Significantly.
7. Are there any restraints impacting market growth?
High cost involved in replacing the existing Deep UV with EUV lasers; Monopoly existing within the market.
8. Can you provide examples of recent developments in the market?
September 2022 - The first over-the-air remotely charged smart locks are now widely accessible to commercial developers of real estate in the United States and Canada, according to an announcement made today by Alfred International Inc., the intelligent lock innovator with industry-leading designs and flexibility, and Wi-Charge, the pioneer in long-range wireless power solutions. In the commercial and residential markets, Alfred ML2 smart mortise locks with wireless power options are establishing new benchmarks for safety, security, and automation. After extensive internal testing and live pilot installations, the locks have been certified.
9. What pricing options are available for accessing the report?
Pricing options include single-user, multi-user, and enterprise licenses priced at USD 4750, USD 5250, and USD 8750 respectively.
10. Is the market size provided in terms of value or volume?
The market size is provided in terms of value, measured in Million and volume, measured in K Unit.
11. Are there any specific market keywords associated with the report?
Yes, the market keyword associated with the report is "Smart Lock Market," which aids in identifying and referencing the specific market segment covered.
12. How do I determine which pricing option suits my needs best?
The pricing options vary based on user requirements and access needs. Individual users may opt for single-user licenses, while businesses requiring broader access may choose multi-user or enterprise licenses for cost-effective access to the report.
13. Are there any additional resources or data provided in the Smart Lock Market report?
While the report offers comprehensive insights, it's advisable to review the specific contents or supplementary materials provided to ascertain if additional resources or data are available.
14. How can I stay updated on further developments or reports in the Smart Lock Market?
To stay informed about further developments, trends, and reports in the Smart Lock Market, consider subscribing to industry newsletters, following relevant companies and organizations, or regularly checking reputable industry news sources and publications.
Methodology
Step 1 - Identification of Relevant Samples Size from Population Database


Step 2 - Approaches for Defining Global Market Size (Value, Volume* & Price*)

Note*: In applicable scenarios
Step 3 - Data Sources
Primary Research
- Web Analytics
- Survey Reports
- Research Institute
- Latest Research Reports
- Opinion Leaders
Secondary Research
- Annual Reports
- White Paper
- Latest Press Release
- Industry Association
- Paid Database
- Investor Presentations

Step 4 - Data Triangulation
Involves using different sources of information in order to increase the validity of a study
These sources are likely to be stakeholders in a program - participants, other researchers, program staff, other community members, and so on.
Then we put all data in single framework & apply various statistical tools to find out the dynamic on the market.
During the analysis stage, feedback from the stakeholder groups would be compared to determine areas of agreement as well as areas of divergence
