

Key Insights
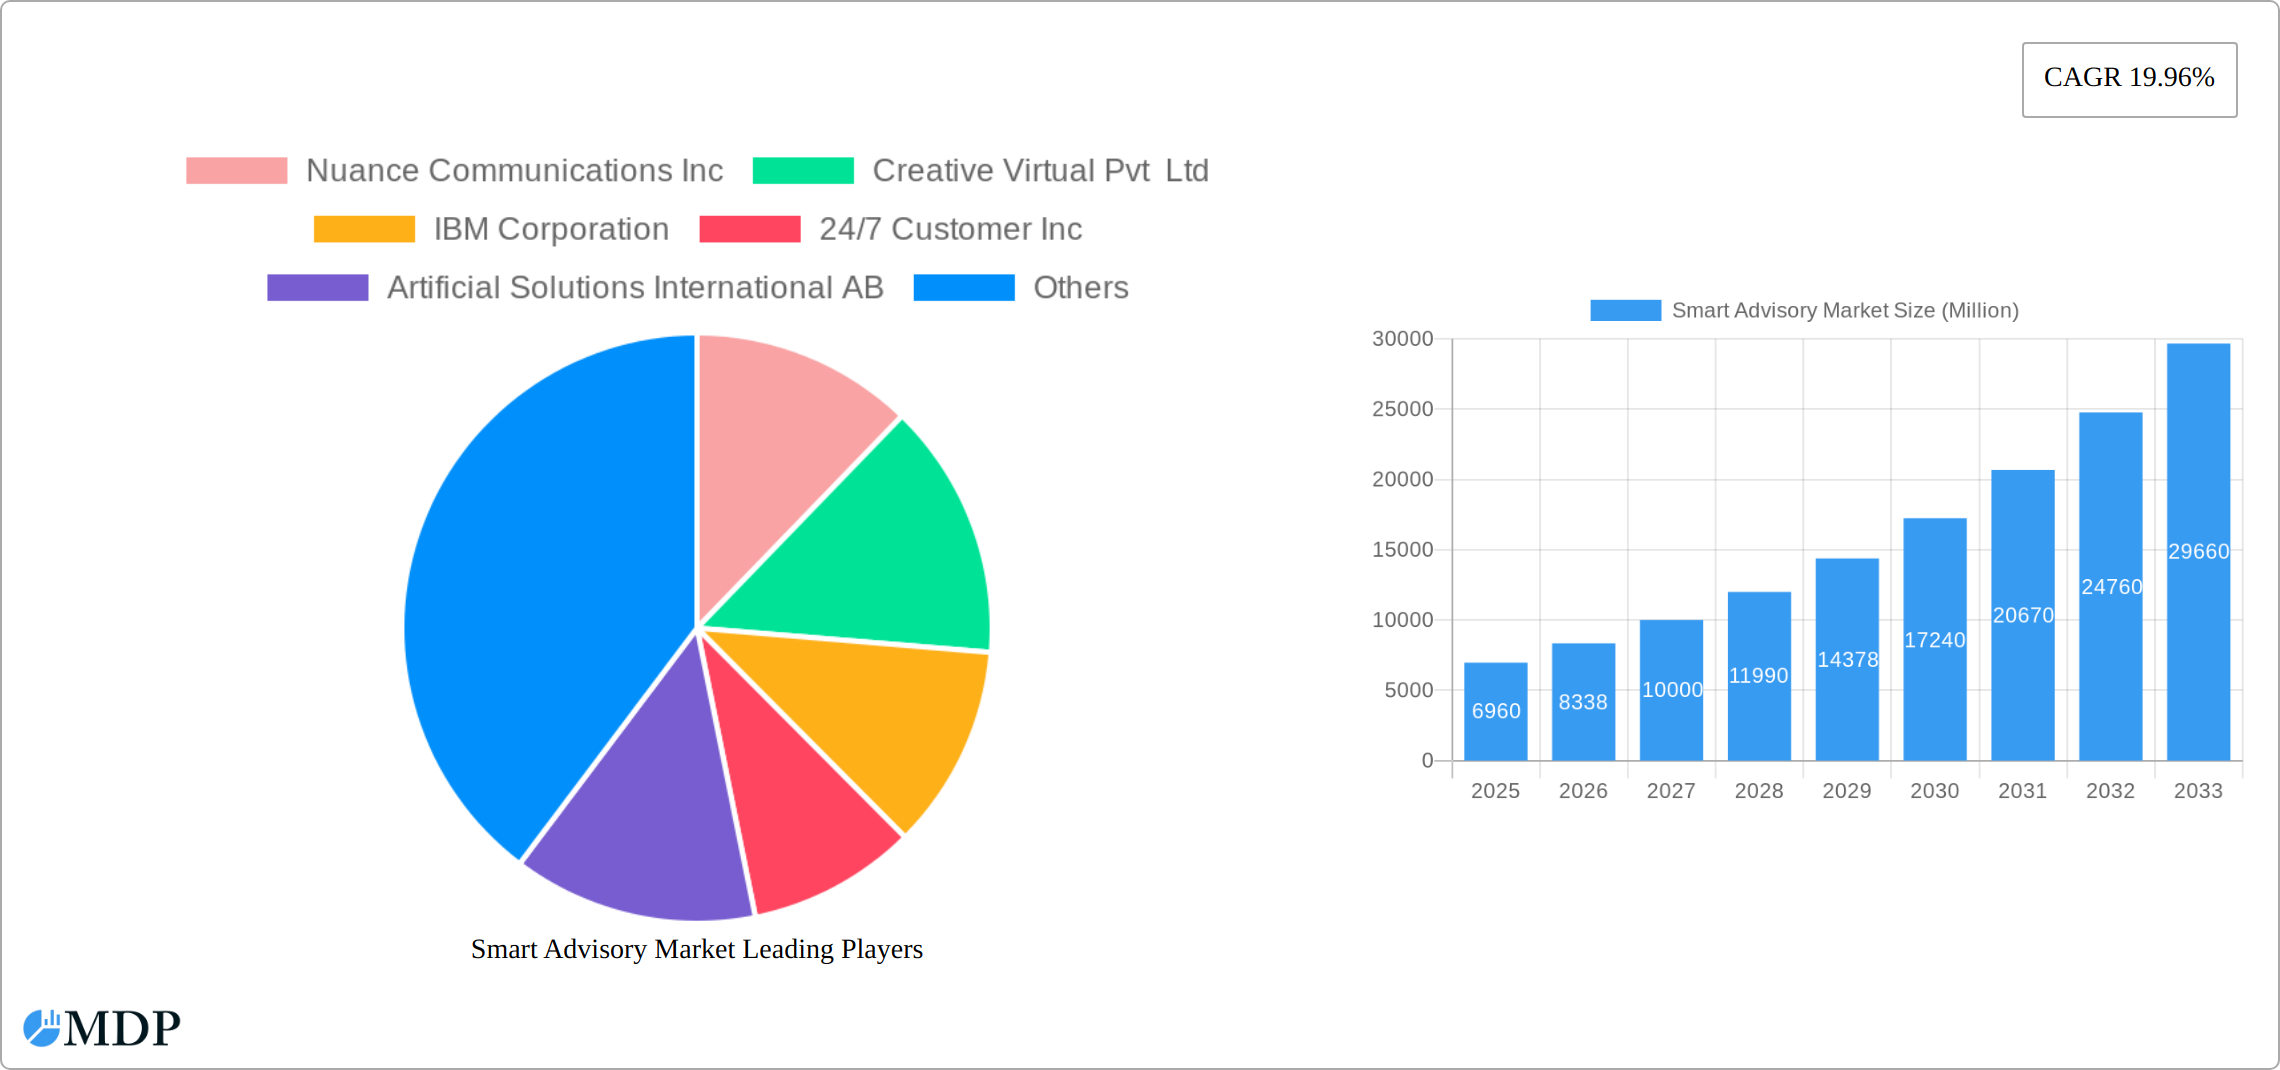
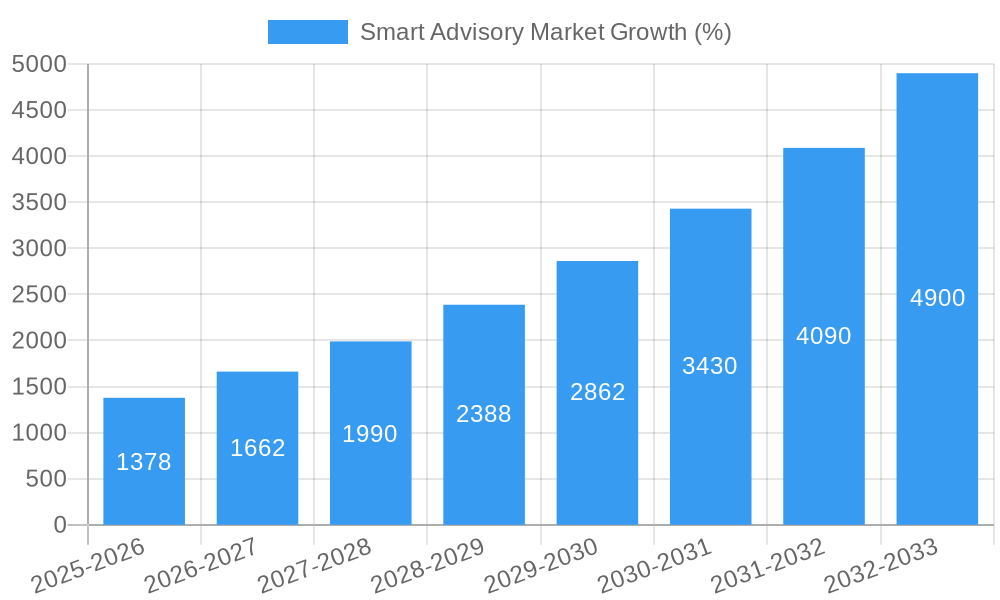
The global Smart Advisory market is experiencing robust growth, projected to reach $6.96 billion in 2025 and exhibiting a Compound Annual Growth Rate (CAGR) of 19.96% from 2025 to 2033. This expansion is fueled by several key drivers. The increasing adoption of AI-powered solutions across various sectors, particularly in BFSI (Banking, Financial Services, and Insurance) and retail, is a major catalyst. Businesses are leveraging smart advisory systems to enhance customer service, personalize financial advice, and optimize operational efficiency. The rising demand for personalized experiences and the need for efficient risk management are further contributing to market growth. The market is segmented by offerings (software and services) and end-user verticals (BFSI, retail, travel and hospitality, government, healthcare, and consumer electronics). While the BFSI sector currently dominates, other verticals are witnessing significant growth, driven by increasing digitalization and the adoption of AI-driven solutions across diverse industries. The market's growth trajectory is expected to remain positive throughout the forecast period, with continued technological advancements and increasing investment in AI and machine learning further accelerating market expansion.
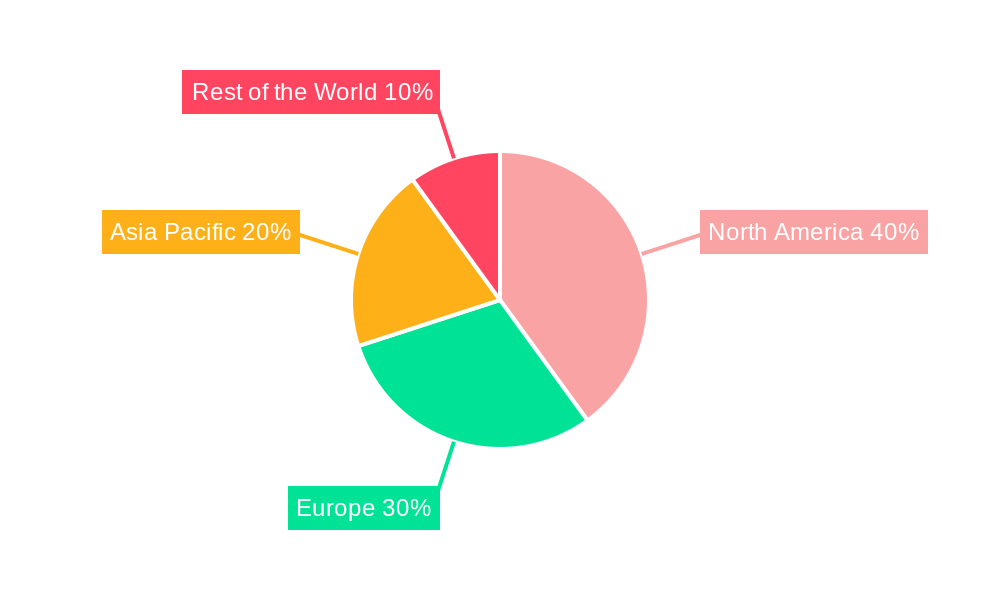
The competitive landscape is characterized by a mix of established players and emerging companies. Key players like Nuance Communications, IBM, and 24/7 Customer are leveraging their existing infrastructure and expertise to enhance their smart advisory offerings. Meanwhile, innovative startups are introducing disruptive technologies and solutions to cater to the evolving market needs. The North American market currently holds a significant share, driven by early adoption of advanced technologies and robust IT infrastructure. However, the Asia-Pacific region is expected to experience significant growth in the coming years due to increasing digitalization and rising demand for advanced customer service solutions. Europe and the rest of the world will also contribute to market expansion, albeit at a slightly slower pace. Strategic partnerships, acquisitions, and technological innovations will shape the competitive dynamics and drive further growth in the global smart advisory market over the forecast period.
Smart Advisory Market Report: 2019-2033 Forecast
This comprehensive report provides a detailed analysis of the Smart Advisory Market, projecting a robust growth trajectory from 2019 to 2033. We delve into market dynamics, leading players, emerging trends, and key opportunities, providing actionable insights for stakeholders across the BFSI, retail, travel, and government sectors. The report covers a market valued at xx Million in 2025 and projects significant expansion to xx Million by 2033, revealing a compelling investment landscape.
Smart Advisory Market Market Dynamics & Concentration
The Smart Advisory Market is experiencing a period of dynamic growth, driven by increasing demand for efficient and data-driven advisory services. Market concentration is moderate, with several key players competing for market share. Innovation in AI-powered advisory tools and automation is a major driver, while regulatory frameworks, particularly concerning data privacy and security, are shaping market practices. Product substitutes, such as traditional advisory firms, still exist, but the advantages offered by smart advisory solutions are steadily eroding their market dominance. End-user trends favor personalized and readily accessible advisory solutions, pushing the market towards greater sophistication and customization.
- Market Share (2025): IBM Corporation (xx%), Nuance Communications Inc (xx%), 24/7 Customer Inc (xx%), Others (xx%)
- M&A Activity (2019-2024): xx deals, indicating a consolidating market.
- Key Innovation Drivers: AI-powered insights, predictive analytics, personalized recommendations.
- Regulatory Landscape: Increasing focus on data security and compliance impacting market strategies.
Smart Advisory Market Industry Trends & Analysis
The Smart Advisory Market is exhibiting a robust Compound Annual Growth Rate (CAGR) of xx% during the forecast period (2025-2033). This growth is fueled by several factors, including the rising adoption of digital technologies across various end-user verticals, particularly in BFSI and retail. Technological disruptions, such as the integration of AI and machine learning, are enhancing advisory services, leading to improved accuracy and efficiency. Consumer preferences are shifting towards personalized and customized advisory solutions, aligning perfectly with the capabilities of smart advisory platforms. Competitive dynamics are intense, with companies focusing on innovation, partnerships, and strategic acquisitions to gain market share. Market penetration is steadily increasing across different segments, showcasing the growing acceptance and adoption of smart advisory solutions.
Leading Markets & Segments in Smart Advisory Market
The BFSI sector dominates the Smart Advisory Market, driven by a need for sophisticated risk management and personalized financial planning solutions. The US and other developed markets are leading in terms of adoption and technological advancement.
Key Drivers by Segment:
- BFSI: Stringent regulatory compliance, need for fraud detection, demand for personalized financial advice.
- Retail: Enhanced customer experience, personalized recommendations, optimized inventory management.
- Travel and Hospitality: Improved customer service, personalized travel planning, dynamic pricing optimization.
- Government: Efficient citizen services, optimized resource allocation, improved decision-making.
- Healthcare & Consumer Electronics: Growing adoption for personalized healthcare recommendations and product suggestions
Dominance Analysis: The BFSI segment's dominance stems from the high value of accurate financial advice and the regulatory requirements driving technology adoption. However, other segments are experiencing significant growth, with retail and travel showing particularly strong potential for future expansion.
Smart Advisory Market Product Developments
Recent product innovations focus on enhancing personalization, integrating advanced analytics, and improving user experience. AI-powered chatbots and virtual assistants are becoming increasingly sophisticated, capable of handling complex queries and providing customized advice. The competitive advantage hinges on the accuracy and efficiency of these AI-driven solutions, enabling better decision-making and improved customer satisfaction. This evolution is pushing the market toward a more proactive and intuitive approach to advisory services, addressing market needs for real-time support and insight.
Key Drivers of Smart Advisory Market Growth
Several factors contribute to the market's growth trajectory. Technological advancements in AI and machine learning are pivotal, enabling personalized insights and automation. Economic growth fuels the demand for efficient and data-driven decision-making across various sectors. Furthermore, supportive government regulations, particularly in developed economies, accelerate market adoption.
Challenges in the Smart Advisory Market Market
High initial investment costs can deter some businesses from adopting smart advisory solutions. Concerns about data security and privacy pose a significant challenge, requiring robust security measures. Intense competition among providers necessitates continuous innovation and adaptation to maintain a competitive edge. The impact of these challenges can be quantified by slower adoption rates in certain sectors and increased operating costs for providers.
Emerging Opportunities in Smart Advisory Market
Strategic partnerships between technology providers and established advisory firms unlock immense potential for market expansion. Technological breakthroughs in natural language processing and sentiment analysis further enhance personalization and user experience. Expansion into emerging markets, leveraging digital infrastructure and growing tech adoption, promises significant future growth.
Leading Players in the Smart Advisory Market Sector
- Nuance Communications Inc
- Creative Virtual Pvt Ltd
- IBM Corporation
- 24/7 Customer Inc
- Artificial Solutions International AB
- Codebaby Corporatio
- eGain Corporation
- Next IT Corporation
- CX Company Limited
- Speakoit Inc
Key Milestones in Smart Advisory Market Industry
- November 2023: Nasdaq launches Fundsight, a platform providing financial advisors with tools for fund discovery, research, and portfolio management. This boosts efficiency and client focus for advisors.
- December 2022: Waterfield Advisors expands its reach internationally through a collaboration with Singapore Airlines, showcasing the potential for global market expansion.
- October 2022: Wazir Advisor's partnership with ITA Germany promotes digitalization within the textile industry, illustrating the growing demand for smart advisory solutions across various sectors.
Strategic Outlook for Smart Advisory Market Market
The Smart Advisory Market exhibits immense long-term potential, driven by ongoing technological innovation and increasing digital adoption across diverse sectors. Strategic partnerships, expansion into untapped markets, and continuous product enhancements will be crucial for sustained growth. The market's future is bright, promising significant returns for early adopters and innovative players.
Smart Advisory Market Segmentation
-
1. Offerings
- 1.1. Software
- 1.2. Services
-
2. End-user Verticals
- 2.1. BFSI
- 2.2. Retail
- 2.3. Travel and Hospitality
- 2.4. Government
- 2.5. Other En
Smart Advisory Market Segmentation By Geography
- 1. North America
- 2. Europe
- 3. Asia Pacific
- 4. Rest of the World
Smart Advisory Market REPORT HIGHLIGHTS
| Aspects | Details |
|---|---|
| Study Period | 2019-2033 |
| Base Year | 2024 |
| Estimated Year | 2025 |
| Forecast Period | 2025-2033 |
| Historical Period | 2019-2024 |
| Growth Rate | CAGR of 19.96% from 2019-2033 |
| Segmentation |
|
Table of Contents
- 1. Introduction
- 1.1. Research Scope
- 1.2. Market Segmentation
- 1.3. Research Methodology
- 1.4. Definitions and Assumptions
- 2. Executive Summary
- 2.1. Introduction
- 3. Market Dynamics
- 3.1. Introduction
- 3.2. Market Drivers
- 3.2.1. Burgeoning Demand for Intelligent Customer Engagement; Demand for Automation for Cost Management in the Healthcare; Increasing Penetration of Websites and Mobile Applications Integrated with Cloud Computing
- 3.3. Market Restrains
- 3.3.1. Lack of Awareness and Information and Availability as add-in Under Analytics
- 3.4. Market Trends
- 3.4.1. The Retail Segment is Expected to Witness Significant Adoption for Smart Advisor Solutions.
- 4. Market Factor Analysis
- 4.1. Porters Five Forces
- 4.2. Supply/Value Chain
- 4.3. PESTEL analysis
- 4.4. Market Entropy
- 4.5. Patent/Trademark Analysis
- 5. Global Smart Advisory Market Analysis, Insights and Forecast, 2019-2031
- 5.1. Market Analysis, Insights and Forecast - by Offerings
- 5.1.1. Software
- 5.1.2. Services
- 5.2. Market Analysis, Insights and Forecast - by End-user Verticals
- 5.2.1. BFSI
- 5.2.2. Retail
- 5.2.3. Travel and Hospitality
- 5.2.4. Government
- 5.2.5. Other En
- 5.3. Market Analysis, Insights and Forecast - by Region
- 5.3.1. North America
- 5.3.2. Europe
- 5.3.3. Asia Pacific
- 5.3.4. Rest of the World
- 5.1. Market Analysis, Insights and Forecast - by Offerings
- 6. North America Smart Advisory Market Analysis, Insights and Forecast, 2019-2031
- 6.1. Market Analysis, Insights and Forecast - by Offerings
- 6.1.1. Software
- 6.1.2. Services
- 6.2. Market Analysis, Insights and Forecast - by End-user Verticals
- 6.2.1. BFSI
- 6.2.2. Retail
- 6.2.3. Travel and Hospitality
- 6.2.4. Government
- 6.2.5. Other En
- 6.1. Market Analysis, Insights and Forecast - by Offerings
- 7. Europe Smart Advisory Market Analysis, Insights and Forecast, 2019-2031
- 7.1. Market Analysis, Insights and Forecast - by Offerings
- 7.1.1. Software
- 7.1.2. Services
- 7.2. Market Analysis, Insights and Forecast - by End-user Verticals
- 7.2.1. BFSI
- 7.2.2. Retail
- 7.2.3. Travel and Hospitality
- 7.2.4. Government
- 7.2.5. Other En
- 7.1. Market Analysis, Insights and Forecast - by Offerings
- 8. Asia Pacific Smart Advisory Market Analysis, Insights and Forecast, 2019-2031
- 8.1. Market Analysis, Insights and Forecast - by Offerings
- 8.1.1. Software
- 8.1.2. Services
- 8.2. Market Analysis, Insights and Forecast - by End-user Verticals
- 8.2.1. BFSI
- 8.2.2. Retail
- 8.2.3. Travel and Hospitality
- 8.2.4. Government
- 8.2.5. Other En
- 8.1. Market Analysis, Insights and Forecast - by Offerings
- 9. Rest of the World Smart Advisory Market Analysis, Insights and Forecast, 2019-2031
- 9.1. Market Analysis, Insights and Forecast - by Offerings
- 9.1.1. Software
- 9.1.2. Services
- 9.2. Market Analysis, Insights and Forecast - by End-user Verticals
- 9.2.1. BFSI
- 9.2.2. Retail
- 9.2.3. Travel and Hospitality
- 9.2.4. Government
- 9.2.5. Other En
- 9.1. Market Analysis, Insights and Forecast - by Offerings
- 10. North America Smart Advisory Market Analysis, Insights and Forecast, 2019-2031
- 10.1. Market Analysis, Insights and Forecast - By Country/Sub-region
- 10.1.1.
- 11. Europe Smart Advisory Market Analysis, Insights and Forecast, 2019-2031
- 11.1. Market Analysis, Insights and Forecast - By Country/Sub-region
- 11.1.1.
- 12. Asia Pacific Smart Advisory Market Analysis, Insights and Forecast, 2019-2031
- 12.1. Market Analysis, Insights and Forecast - By Country/Sub-region
- 12.1.1.
- 13. Rest of the World Smart Advisory Market Analysis, Insights and Forecast, 2019-2031
- 13.1. Market Analysis, Insights and Forecast - By Country/Sub-region
- 13.1.1.
- 14. Competitive Analysis
- 14.1. Global Market Share Analysis 2024
- 14.2. Company Profiles
- 14.2.1 Nuance Communications Inc
- 14.2.1.1. Overview
- 14.2.1.2. Products
- 14.2.1.3. SWOT Analysis
- 14.2.1.4. Recent Developments
- 14.2.1.5. Financials (Based on Availability)
- 14.2.2 Creative Virtual Pvt Ltd
- 14.2.2.1. Overview
- 14.2.2.2. Products
- 14.2.2.3. SWOT Analysis
- 14.2.2.4. Recent Developments
- 14.2.2.5. Financials (Based on Availability)
- 14.2.3 IBM Corporation
- 14.2.3.1. Overview
- 14.2.3.2. Products
- 14.2.3.3. SWOT Analysis
- 14.2.3.4. Recent Developments
- 14.2.3.5. Financials (Based on Availability)
- 14.2.4 24/7 Customer Inc
- 14.2.4.1. Overview
- 14.2.4.2. Products
- 14.2.4.3. SWOT Analysis
- 14.2.4.4. Recent Developments
- 14.2.4.5. Financials (Based on Availability)
- 14.2.5 Artificial Solutions International AB
- 14.2.5.1. Overview
- 14.2.5.2. Products
- 14.2.5.3. SWOT Analysis
- 14.2.5.4. Recent Developments
- 14.2.5.5. Financials (Based on Availability)
- 14.2.6 Codebaby Corporatio
- 14.2.6.1. Overview
- 14.2.6.2. Products
- 14.2.6.3. SWOT Analysis
- 14.2.6.4. Recent Developments
- 14.2.6.5. Financials (Based on Availability)
- 14.2.7 eGain Corporation
- 14.2.7.1. Overview
- 14.2.7.2. Products
- 14.2.7.3. SWOT Analysis
- 14.2.7.4. Recent Developments
- 14.2.7.5. Financials (Based on Availability)
- 14.2.8 Next IT Corporation
- 14.2.8.1. Overview
- 14.2.8.2. Products
- 14.2.8.3. SWOT Analysis
- 14.2.8.4. Recent Developments
- 14.2.8.5. Financials (Based on Availability)
- 14.2.9 CX Company Limited
- 14.2.9.1. Overview
- 14.2.9.2. Products
- 14.2.9.3. SWOT Analysis
- 14.2.9.4. Recent Developments
- 14.2.9.5. Financials (Based on Availability)
- 14.2.10 Speakoit Inc
- 14.2.10.1. Overview
- 14.2.10.2. Products
- 14.2.10.3. SWOT Analysis
- 14.2.10.4. Recent Developments
- 14.2.10.5. Financials (Based on Availability)
- 14.2.1 Nuance Communications Inc
List of Figures
- Figure 1: Global Smart Advisory Market Revenue Breakdown (Million, %) by Region 2024 & 2032
- Figure 2: North America Smart Advisory Market Revenue (Million), by Country 2024 & 2032
- Figure 3: North America Smart Advisory Market Revenue Share (%), by Country 2024 & 2032
- Figure 4: Europe Smart Advisory Market Revenue (Million), by Country 2024 & 2032
- Figure 5: Europe Smart Advisory Market Revenue Share (%), by Country 2024 & 2032
- Figure 6: Asia Pacific Smart Advisory Market Revenue (Million), by Country 2024 & 2032
- Figure 7: Asia Pacific Smart Advisory Market Revenue Share (%), by Country 2024 & 2032
- Figure 8: Rest of the World Smart Advisory Market Revenue (Million), by Country 2024 & 2032
- Figure 9: Rest of the World Smart Advisory Market Revenue Share (%), by Country 2024 & 2032
- Figure 10: North America Smart Advisory Market Revenue (Million), by Offerings 2024 & 2032
- Figure 11: North America Smart Advisory Market Revenue Share (%), by Offerings 2024 & 2032
- Figure 12: North America Smart Advisory Market Revenue (Million), by End-user Verticals 2024 & 2032
- Figure 13: North America Smart Advisory Market Revenue Share (%), by End-user Verticals 2024 & 2032
- Figure 14: North America Smart Advisory Market Revenue (Million), by Country 2024 & 2032
- Figure 15: North America Smart Advisory Market Revenue Share (%), by Country 2024 & 2032
- Figure 16: Europe Smart Advisory Market Revenue (Million), by Offerings 2024 & 2032
- Figure 17: Europe Smart Advisory Market Revenue Share (%), by Offerings 2024 & 2032
- Figure 18: Europe Smart Advisory Market Revenue (Million), by End-user Verticals 2024 & 2032
- Figure 19: Europe Smart Advisory Market Revenue Share (%), by End-user Verticals 2024 & 2032
- Figure 20: Europe Smart Advisory Market Revenue (Million), by Country 2024 & 2032
- Figure 21: Europe Smart Advisory Market Revenue Share (%), by Country 2024 & 2032
- Figure 22: Asia Pacific Smart Advisory Market Revenue (Million), by Offerings 2024 & 2032
- Figure 23: Asia Pacific Smart Advisory Market Revenue Share (%), by Offerings 2024 & 2032
- Figure 24: Asia Pacific Smart Advisory Market Revenue (Million), by End-user Verticals 2024 & 2032
- Figure 25: Asia Pacific Smart Advisory Market Revenue Share (%), by End-user Verticals 2024 & 2032
- Figure 26: Asia Pacific Smart Advisory Market Revenue (Million), by Country 2024 & 2032
- Figure 27: Asia Pacific Smart Advisory Market Revenue Share (%), by Country 2024 & 2032
- Figure 28: Rest of the World Smart Advisory Market Revenue (Million), by Offerings 2024 & 2032
- Figure 29: Rest of the World Smart Advisory Market Revenue Share (%), by Offerings 2024 & 2032
- Figure 30: Rest of the World Smart Advisory Market Revenue (Million), by End-user Verticals 2024 & 2032
- Figure 31: Rest of the World Smart Advisory Market Revenue Share (%), by End-user Verticals 2024 & 2032
- Figure 32: Rest of the World Smart Advisory Market Revenue (Million), by Country 2024 & 2032
- Figure 33: Rest of the World Smart Advisory Market Revenue Share (%), by Country 2024 & 2032
List of Tables
- Table 1: Global Smart Advisory Market Revenue Million Forecast, by Region 2019 & 2032
- Table 2: Global Smart Advisory Market Revenue Million Forecast, by Offerings 2019 & 2032
- Table 3: Global Smart Advisory Market Revenue Million Forecast, by End-user Verticals 2019 & 2032
- Table 4: Global Smart Advisory Market Revenue Million Forecast, by Region 2019 & 2032
- Table 5: Global Smart Advisory Market Revenue Million Forecast, by Country 2019 & 2032
- Table 6: Smart Advisory Market Revenue (Million) Forecast, by Application 2019 & 2032
- Table 7: Global Smart Advisory Market Revenue Million Forecast, by Country 2019 & 2032
- Table 8: Smart Advisory Market Revenue (Million) Forecast, by Application 2019 & 2032
- Table 9: Global Smart Advisory Market Revenue Million Forecast, by Country 2019 & 2032
- Table 10: Smart Advisory Market Revenue (Million) Forecast, by Application 2019 & 2032
- Table 11: Global Smart Advisory Market Revenue Million Forecast, by Country 2019 & 2032
- Table 12: Smart Advisory Market Revenue (Million) Forecast, by Application 2019 & 2032
- Table 13: Global Smart Advisory Market Revenue Million Forecast, by Offerings 2019 & 2032
- Table 14: Global Smart Advisory Market Revenue Million Forecast, by End-user Verticals 2019 & 2032
- Table 15: Global Smart Advisory Market Revenue Million Forecast, by Country 2019 & 2032
- Table 16: Global Smart Advisory Market Revenue Million Forecast, by Offerings 2019 & 2032
- Table 17: Global Smart Advisory Market Revenue Million Forecast, by End-user Verticals 2019 & 2032
- Table 18: Global Smart Advisory Market Revenue Million Forecast, by Country 2019 & 2032
- Table 19: Global Smart Advisory Market Revenue Million Forecast, by Offerings 2019 & 2032
- Table 20: Global Smart Advisory Market Revenue Million Forecast, by End-user Verticals 2019 & 2032
- Table 21: Global Smart Advisory Market Revenue Million Forecast, by Country 2019 & 2032
- Table 22: Global Smart Advisory Market Revenue Million Forecast, by Offerings 2019 & 2032
- Table 23: Global Smart Advisory Market Revenue Million Forecast, by End-user Verticals 2019 & 2032
- Table 24: Global Smart Advisory Market Revenue Million Forecast, by Country 2019 & 2032
Frequently Asked Questions
1. What is the projected Compound Annual Growth Rate (CAGR) of the Smart Advisory Market?
The projected CAGR is approximately 19.96%.
2. Which companies are prominent players in the Smart Advisory Market?
Key companies in the market include Nuance Communications Inc, Creative Virtual Pvt Ltd, IBM Corporation, 24/7 Customer Inc, Artificial Solutions International AB, Codebaby Corporatio, eGain Corporation, Next IT Corporation, CX Company Limited, Speakoit Inc.
3. What are the main segments of the Smart Advisory Market?
The market segments include Offerings, End-user Verticals.
4. Can you provide details about the market size?
The market size is estimated to be USD 6.96 Million as of 2022.
5. What are some drivers contributing to market growth?
Burgeoning Demand for Intelligent Customer Engagement; Demand for Automation for Cost Management in the Healthcare; Increasing Penetration of Websites and Mobile Applications Integrated with Cloud Computing.
6. What are the notable trends driving market growth?
The Retail Segment is Expected to Witness Significant Adoption for Smart Advisor Solutions..
7. Are there any restraints impacting market growth?
Lack of Awareness and Information and Availability as add-in Under Analytics.
8. Can you provide examples of recent developments in the market?
November 2023 - Nasdaq Launched an Innovative Solution for Financial Advisors in Partnership with Trackinsight. US Advisors now have access to a new tool in their toolbox with the launch of Fundsight, a free online platform created by Nasdaq and Trackinsight. The site, which is accessible through a simple single sign-on that verifies advisors through their FINRA CRD number, provides new and unique tools to advisors, allowing easy access to fund discovery, research, portfolio management, investment ideas, and content, all created with the intent of saving advisors time to focus on clients and grow their business.
9. What pricing options are available for accessing the report?
Pricing options include single-user, multi-user, and enterprise licenses priced at USD 4750, USD 5250, and USD 8750 respectively.
10. Is the market size provided in terms of value or volume?
The market size is provided in terms of value, measured in Million.
11. Are there any specific market keywords associated with the report?
Yes, the market keyword associated with the report is "Smart Advisory Market," which aids in identifying and referencing the specific market segment covered.
12. How do I determine which pricing option suits my needs best?
The pricing options vary based on user requirements and access needs. Individual users may opt for single-user licenses, while businesses requiring broader access may choose multi-user or enterprise licenses for cost-effective access to the report.
13. Are there any additional resources or data provided in the Smart Advisory Market report?
While the report offers comprehensive insights, it's advisable to review the specific contents or supplementary materials provided to ascertain if additional resources or data are available.
14. How can I stay updated on further developments or reports in the Smart Advisory Market?
To stay informed about further developments, trends, and reports in the Smart Advisory Market, consider subscribing to industry newsletters, following relevant companies and organizations, or regularly checking reputable industry news sources and publications.
Methodology
Step 1 - Identification of Relevant Samples Size from Population Database


Step 2 - Approaches for Defining Global Market Size (Value, Volume* & Price*)

Note*: In applicable scenarios
Step 3 - Data Sources
Primary Research
- Web Analytics
- Survey Reports
- Research Institute
- Latest Research Reports
- Opinion Leaders
Secondary Research
- Annual Reports
- White Paper
- Latest Press Release
- Industry Association
- Paid Database
- Investor Presentations

Step 4 - Data Triangulation
Involves using different sources of information in order to increase the validity of a study
These sources are likely to be stakeholders in a program - participants, other researchers, program staff, other community members, and so on.
Then we put all data in single framework & apply various statistical tools to find out the dynamic on the market.
During the analysis stage, feedback from the stakeholder groups would be compared to determine areas of agreement as well as areas of divergence
