

Key Insights
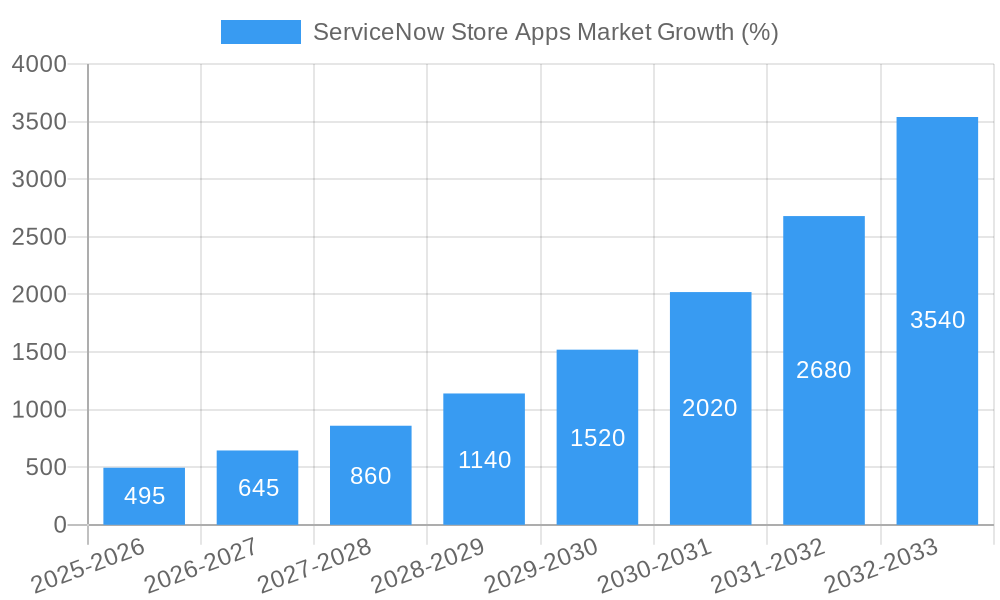
The ServiceNow Store Apps market is experiencing robust growth, fueled by the increasing adoption of cloud-based solutions and the rising demand for workflow automation and enhanced productivity across various enterprise sizes. The market's Compound Annual Growth Rate (CAGR) of 32.73% from 2019 to 2024 indicates a significant upward trajectory. This growth is driven by several factors, including the need for improved operational efficiency, the desire for better integration between various business applications, and the increasing sophistication of ServiceNow's platform. Large enterprises are currently the primary adopters, leveraging these apps for complex integrations and centralized management of IT and business processes. However, the SME segment is projected to show substantial growth in the coming years, as smaller businesses increasingly recognize the value proposition of streamlined workflows and readily available, cost-effective solutions. The market is segmented by deployment type (cloud-based and web-based), with cloud-based solutions dominating due to their scalability, flexibility, and reduced infrastructure costs. Key players like ServiceNow itself, IBM, Microsoft, and others contribute to market dynamism through continuous innovation and competitive offerings. Geographical distribution shows North America and Europe as currently leading markets, although the Asia-Pacific region is anticipated to demonstrate significant expansion, driven by increasing digitalization and technological adoption in rapidly developing economies.
The forecast period (2025-2033) promises continued expansion, propelled by advancements in artificial intelligence (AI) and machine learning (ML) integration within ServiceNow apps. These enhancements will allow for more intelligent automation, predictive analytics, and improved user experiences. However, potential restraints include integration complexities, the need for specialized skills, and concerns about data security and compliance. The market's growth will be influenced by ongoing technological advancements, evolving enterprise needs, and the emergence of new competitors. Strategic partnerships and acquisitions within the ServiceNow ecosystem will further shape the market landscape and influence the overall growth trajectory. Overall, the ServiceNow Store Apps market is poised for sustained growth, driven by a combination of technological progress, expanding adoption across various business segments, and the ongoing need for streamlined business processes.
ServiceNow Store Apps Market: A Comprehensive Report (2019-2033)
This in-depth report provides a comprehensive analysis of the ServiceNow Store Apps market, offering valuable insights for stakeholders across the industry. Covering the period from 2019 to 2033, with a focus on 2025, this report meticulously examines market dynamics, leading players, technological advancements, and future growth prospects. The market is projected to reach xx Million by 2033, presenting significant opportunities for investment and expansion. This report is indispensable for businesses seeking to understand and capitalize on this rapidly evolving market.
ServiceNow Store Apps Market Market Dynamics & Concentration
The ServiceNow Store Apps market exhibits a dynamic landscape characterized by a moderate level of concentration. While a few major players hold significant market share, numerous smaller companies contribute to the overall market activity. The market concentration ratio (CR5) for 2024 is estimated at xx%, indicating a moderately competitive environment. Innovation is a key driver, with frequent introductions of new applications and features to cater to evolving business needs. Regulatory frameworks, particularly those related to data privacy and security, significantly impact market operations. Substitute products, such as custom-built internal applications, exist but often lack the scalability and integration benefits offered by ServiceNow store apps. End-user trends show an increasing preference for cloud-based solutions and integration with other enterprise software. M&A activity has been moderate in recent years, with approximately xx deals recorded between 2019 and 2024.
- Market Share: The top 5 players collectively hold an estimated xx% of the market share in 2024.
- M&A Activity: An average of xx M&A deals per year were observed during the historical period (2019-2024).
- Innovation Drivers: Growing demand for automation, improved efficiency, and enhanced user experiences.
- Regulatory Impacts: Compliance with GDPR, CCPA, and other data privacy regulations.
ServiceNow Store Apps Market Industry Trends & Analysis
The ServiceNow Store Apps market demonstrates robust growth, driven primarily by the increasing adoption of cloud-based enterprise resource planning (ERP) systems. The market's Compound Annual Growth Rate (CAGR) from 2019 to 2024 was approximately xx%, and is projected to reach xx% during the forecast period (2025-2033). This growth is fueled by several factors, including the rising need for digital transformation across various industries, the increasing demand for improved operational efficiency, and the expanding adoption of ServiceNow's platform itself. Technological disruptions, such as the integration of AI and machine learning capabilities within ServiceNow apps, are further accelerating market expansion. Consumer preferences are shifting towards user-friendly, customizable, and highly integrated applications. Competitive dynamics are intense, with companies constantly innovating and expanding their product portfolios to maintain their market position. Market penetration remains relatively high in developed economies, but significant growth potential exists in emerging markets.
Leading Markets & Segments in ServiceNow Store Apps Market
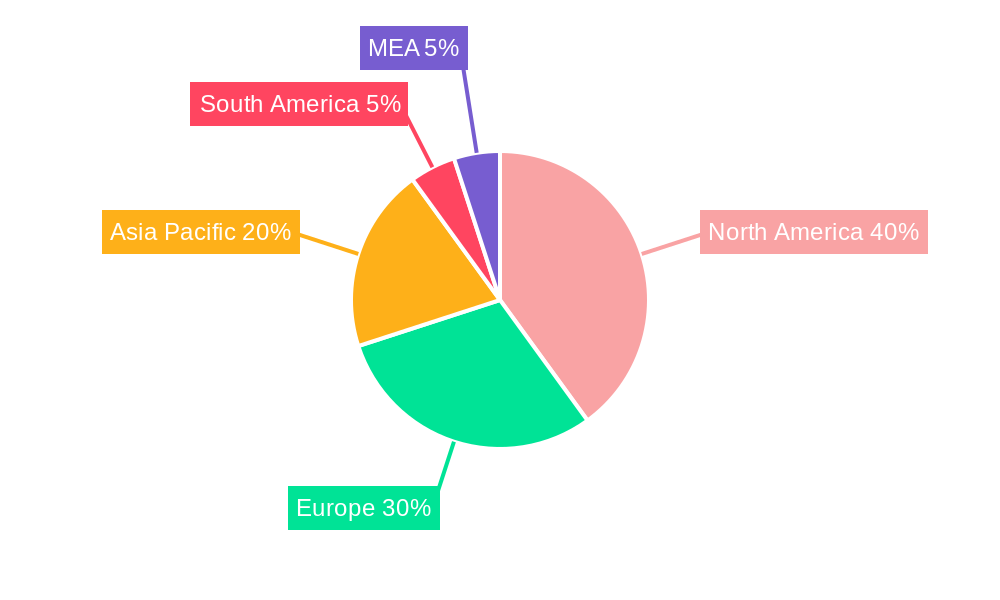
The North American region currently dominates the ServiceNow Store Apps market, accounting for approximately xx% of the global revenue in 2024. This dominance is attributed to the high concentration of large enterprises, strong IT infrastructure, and early adoption of cloud-based technologies.
- By Enterprise Size:
- Large Enterprises: This segment constitutes the largest share of the market due to their higher IT budgets and greater need for sophisticated solutions.
- Small and Medium Enterprises (SMEs): This segment is experiencing significant growth, driven by increasing affordability and accessibility of cloud-based ServiceNow apps.
- By Type:
- Cloud-Based: The majority of market revenue is generated through cloud-based applications, reflecting the global trend towards cloud computing adoption.
- Web-Based: Web-based applications are experiencing healthy growth and contribute a significant portion of the overall market.
Key Drivers for North American Dominance:
- Robust IT infrastructure and technological advancement.
- High concentration of large enterprises with significant IT spending.
- Early adoption of cloud computing and SaaS solutions.
- Favorable regulatory environment supporting digital transformation.
ServiceNow Store Apps Market Product Developments
Recent years have witnessed significant product innovations in the ServiceNow Store Apps market, focusing on enhanced automation, improved user interfaces, and seamless integration capabilities. Several key trends include the incorporation of AI and machine learning to optimize workflows, the development of more intuitive dashboards for real-time monitoring, and the increasing use of low-code/no-code development platforms to facilitate customization. These advancements are driving increased market adoption and improving the overall user experience.
Key Drivers of ServiceNow Store Apps Market Growth
The growth of the ServiceNow Store Apps market is driven by several factors, including:
- Technological advancements: The integration of AI, machine learning, and low-code development platforms.
- Increased demand for automation: Businesses are actively seeking ways to automate workflows and improve operational efficiency.
- Improved security and compliance: ServiceNow apps address stringent data security and compliance requirements.
- Growing adoption of cloud computing: Businesses are shifting their IT infrastructure to the cloud.
Challenges in the ServiceNow Store Apps Market Market
Despite the significant growth potential, the ServiceNow Store Apps market faces several challenges:
- High implementation costs: The cost of implementing and integrating ServiceNow apps can be prohibitive for some businesses.
- Integration complexities: Integrating ServiceNow apps with existing systems can be complex and require specialized expertise.
- Competition: The market is highly competitive, with both established players and new entrants vying for market share. This competition results in pressure to reduce prices which impacts profitability.
Emerging Opportunities in ServiceNow Store Apps Market
The long-term growth of the ServiceNow Store Apps market is fueled by several emerging opportunities:
- Expansion into new geographies: Significant growth potential exists in emerging markets with growing IT budgets and adoption rates of cloud computing.
- Development of niche applications: The creation of specialized apps catering to specific industry verticals.
- Strategic partnerships: Collaborations between ServiceNow and other technology providers to expand offerings and reach.
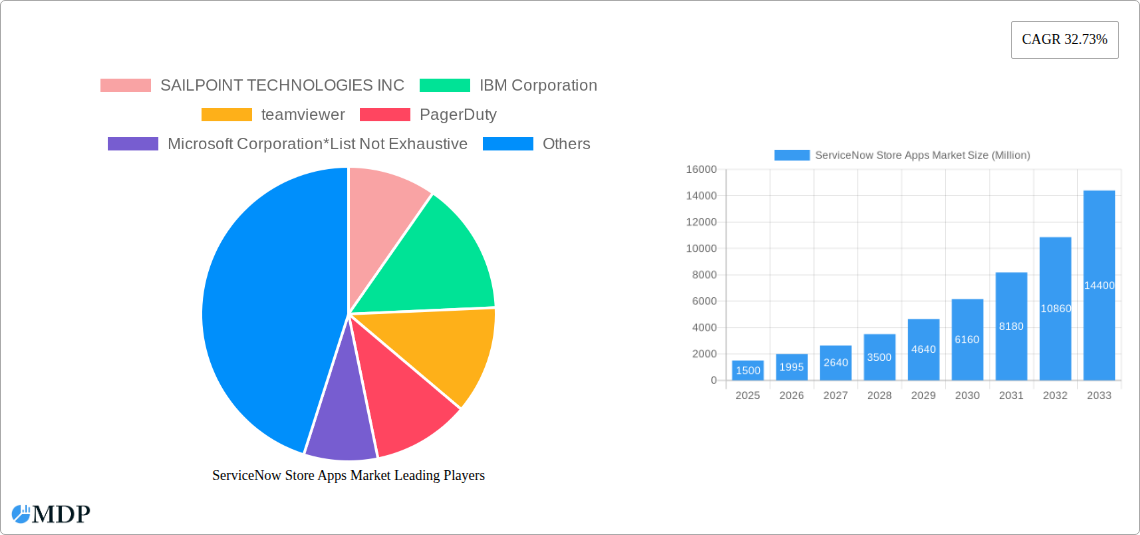
Leading Players in the ServiceNow Store Apps Market Sector
- SAILPOINT TECHNOLOGIES INC
- IBM Corporation
- teamviewer
- PagerDuty
- Microsoft Corporation
- xMatters Inc
- Cisco Systems Inc
- Okta Inc
- Talkdesk Inc
- Dynatrace LLC
Key Milestones in ServiceNow Store Apps Market Industry
- May 2023: xtype launched xtype View, a multi-instance viewer and platform engineering dashboard for ServiceNow professionals, enhancing monitoring and reducing configuration discrepancies.
- March 2023: Anglepoint launched a ServiceNow application for IBM software asset management, improving IBM software tracking within the ServiceNow environment.
Strategic Outlook for ServiceNow Store Apps Market Market
The ServiceNow Store Apps market is poised for continued expansion, driven by increasing digital transformation initiatives and the growing demand for efficient and secure enterprise solutions. Strategic opportunities lie in developing innovative applications leveraging AI and machine learning, expanding into new geographic markets, and forging strategic partnerships to broaden market reach and product offerings. Focus on user experience and seamless integration will be crucial for success in this competitive landscape. The market is expected to experience a significant surge in the coming years, presenting lucrative opportunities for players to capitalize on.
ServiceNow Store Apps Market Segmentation
-
1. Type
- 1.1. Cloud-Based
- 1.2. Web- Based
-
2. Enterprise Size
- 2.1. Small and Medium Enterprises (SMEs)
- 2.2. Large Enterprises
ServiceNow Store Apps Market Segmentation By Geography
- 1. North America
- 2. Europe
- 3. Asia
- 4. Latin America
- 5. Middle East and Africa
ServiceNow Store Apps Market REPORT HIGHLIGHTS
| Aspects | Details |
|---|---|
| Study Period | 2019-2033 |
| Base Year | 2024 |
| Estimated Year | 2025 |
| Forecast Period | 2025-2033 |
| Historical Period | 2019-2024 |
| Growth Rate | CAGR of 32.73% from 2019-2033 |
| Segmentation |
|
Table of Contents
- 1. Introduction
- 1.1. Research Scope
- 1.2. Market Segmentation
- 1.3. Research Methodology
- 1.4. Definitions and Assumptions
- 2. Executive Summary
- 2.1. Introduction
- 3. Market Dynamics
- 3.1. Introduction
- 3.2. Market Drivers
- 3.2.1. Rise in adoption of cloud services and cloud computing; Rise in digital platforms and adoption of advance technologies
- 3.3. Market Restrains
- 3.3.1. High upfront and licensing costs
- 3.4. Market Trends
- 3.4.1. Cloud-Based is Expected to Hold Significant Share of the Market
- 4. Market Factor Analysis
- 4.1. Porters Five Forces
- 4.2. Supply/Value Chain
- 4.3. PESTEL analysis
- 4.4. Market Entropy
- 4.5. Patent/Trademark Analysis
- 5. Global ServiceNow Store Apps Market Analysis, Insights and Forecast, 2019-2031
- 5.1. Market Analysis, Insights and Forecast - by Type
- 5.1.1. Cloud-Based
- 5.1.2. Web- Based
- 5.2. Market Analysis, Insights and Forecast - by Enterprise Size
- 5.2.1. Small and Medium Enterprises (SMEs)
- 5.2.2. Large Enterprises
- 5.3. Market Analysis, Insights and Forecast - by Region
- 5.3.1. North America
- 5.3.2. Europe
- 5.3.3. Asia
- 5.3.4. Latin America
- 5.3.5. Middle East and Africa
- 5.1. Market Analysis, Insights and Forecast - by Type
- 6. North America ServiceNow Store Apps Market Analysis, Insights and Forecast, 2019-2031
- 6.1. Market Analysis, Insights and Forecast - by Type
- 6.1.1. Cloud-Based
- 6.1.2. Web- Based
- 6.2. Market Analysis, Insights and Forecast - by Enterprise Size
- 6.2.1. Small and Medium Enterprises (SMEs)
- 6.2.2. Large Enterprises
- 6.1. Market Analysis, Insights and Forecast - by Type
- 7. Europe ServiceNow Store Apps Market Analysis, Insights and Forecast, 2019-2031
- 7.1. Market Analysis, Insights and Forecast - by Type
- 7.1.1. Cloud-Based
- 7.1.2. Web- Based
- 7.2. Market Analysis, Insights and Forecast - by Enterprise Size
- 7.2.1. Small and Medium Enterprises (SMEs)
- 7.2.2. Large Enterprises
- 7.1. Market Analysis, Insights and Forecast - by Type
- 8. Asia ServiceNow Store Apps Market Analysis, Insights and Forecast, 2019-2031
- 8.1. Market Analysis, Insights and Forecast - by Type
- 8.1.1. Cloud-Based
- 8.1.2. Web- Based
- 8.2. Market Analysis, Insights and Forecast - by Enterprise Size
- 8.2.1. Small and Medium Enterprises (SMEs)
- 8.2.2. Large Enterprises
- 8.1. Market Analysis, Insights and Forecast - by Type
- 9. Latin America ServiceNow Store Apps Market Analysis, Insights and Forecast, 2019-2031
- 9.1. Market Analysis, Insights and Forecast - by Type
- 9.1.1. Cloud-Based
- 9.1.2. Web- Based
- 9.2. Market Analysis, Insights and Forecast - by Enterprise Size
- 9.2.1. Small and Medium Enterprises (SMEs)
- 9.2.2. Large Enterprises
- 9.1. Market Analysis, Insights and Forecast - by Type
- 10. Middle East and Africa ServiceNow Store Apps Market Analysis, Insights and Forecast, 2019-2031
- 10.1. Market Analysis, Insights and Forecast - by Type
- 10.1.1. Cloud-Based
- 10.1.2. Web- Based
- 10.2. Market Analysis, Insights and Forecast - by Enterprise Size
- 10.2.1. Small and Medium Enterprises (SMEs)
- 10.2.2. Large Enterprises
- 10.1. Market Analysis, Insights and Forecast - by Type
- 11. North America ServiceNow Store Apps Market Analysis, Insights and Forecast, 2019-2031
- 11.1. Market Analysis, Insights and Forecast - By Country/Sub-region
- 11.1.1 United States
- 11.1.2 Canada
- 11.1.3 Mexico
- 12. Europe ServiceNow Store Apps Market Analysis, Insights and Forecast, 2019-2031
- 12.1. Market Analysis, Insights and Forecast - By Country/Sub-region
- 12.1.1 Germany
- 12.1.2 United Kingdom
- 12.1.3 France
- 12.1.4 Spain
- 12.1.5 Italy
- 12.1.6 Spain
- 12.1.7 Belgium
- 12.1.8 Netherland
- 12.1.9 Nordics
- 12.1.10 Rest of Europe
- 13. Asia Pacific ServiceNow Store Apps Market Analysis, Insights and Forecast, 2019-2031
- 13.1. Market Analysis, Insights and Forecast - By Country/Sub-region
- 13.1.1 China
- 13.1.2 Japan
- 13.1.3 India
- 13.1.4 South Korea
- 13.1.5 Southeast Asia
- 13.1.6 Australia
- 13.1.7 Indonesia
- 13.1.8 Phillipes
- 13.1.9 Singapore
- 13.1.10 Thailandc
- 13.1.11 Rest of Asia Pacific
- 14. South America ServiceNow Store Apps Market Analysis, Insights and Forecast, 2019-2031
- 14.1. Market Analysis, Insights and Forecast - By Country/Sub-region
- 14.1.1 Brazil
- 14.1.2 Argentina
- 14.1.3 Peru
- 14.1.4 Chile
- 14.1.5 Colombia
- 14.1.6 Ecuador
- 14.1.7 Venezuela
- 14.1.8 Rest of South America
- 15. North America ServiceNow Store Apps Market Analysis, Insights and Forecast, 2019-2031
- 15.1. Market Analysis, Insights and Forecast - By Country/Sub-region
- 15.1.1 United States
- 15.1.2 Canada
- 15.1.3 Mexico
- 16. MEA ServiceNow Store Apps Market Analysis, Insights and Forecast, 2019-2031
- 16.1. Market Analysis, Insights and Forecast - By Country/Sub-region
- 16.1.1 United Arab Emirates
- 16.1.2 Saudi Arabia
- 16.1.3 South Africa
- 16.1.4 Rest of Middle East and Africa
- 17. Competitive Analysis
- 17.1. Global Market Share Analysis 2024
- 17.2. Company Profiles
- 17.2.1 SAILPOINT TECHNOLOGIES INC
- 17.2.1.1. Overview
- 17.2.1.2. Products
- 17.2.1.3. SWOT Analysis
- 17.2.1.4. Recent Developments
- 17.2.1.5. Financials (Based on Availability)
- 17.2.2 IBM Corporation
- 17.2.2.1. Overview
- 17.2.2.2. Products
- 17.2.2.3. SWOT Analysis
- 17.2.2.4. Recent Developments
- 17.2.2.5. Financials (Based on Availability)
- 17.2.3 teamviewer
- 17.2.3.1. Overview
- 17.2.3.2. Products
- 17.2.3.3. SWOT Analysis
- 17.2.3.4. Recent Developments
- 17.2.3.5. Financials (Based on Availability)
- 17.2.4 PagerDuty
- 17.2.4.1. Overview
- 17.2.4.2. Products
- 17.2.4.3. SWOT Analysis
- 17.2.4.4. Recent Developments
- 17.2.4.5. Financials (Based on Availability)
- 17.2.5 Microsoft Corporation*List Not Exhaustive
- 17.2.5.1. Overview
- 17.2.5.2. Products
- 17.2.5.3. SWOT Analysis
- 17.2.5.4. Recent Developments
- 17.2.5.5. Financials (Based on Availability)
- 17.2.6 xMatters Inc
- 17.2.6.1. Overview
- 17.2.6.2. Products
- 17.2.6.3. SWOT Analysis
- 17.2.6.4. Recent Developments
- 17.2.6.5. Financials (Based on Availability)
- 17.2.7 Cisco Systems Inc
- 17.2.7.1. Overview
- 17.2.7.2. Products
- 17.2.7.3. SWOT Analysis
- 17.2.7.4. Recent Developments
- 17.2.7.5. Financials (Based on Availability)
- 17.2.8 Okta Inc
- 17.2.8.1. Overview
- 17.2.8.2. Products
- 17.2.8.3. SWOT Analysis
- 17.2.8.4. Recent Developments
- 17.2.8.5. Financials (Based on Availability)
- 17.2.9 Talkdesk Inc
- 17.2.9.1. Overview
- 17.2.9.2. Products
- 17.2.9.3. SWOT Analysis
- 17.2.9.4. Recent Developments
- 17.2.9.5. Financials (Based on Availability)
- 17.2.10 Dynatrace LLC
- 17.2.10.1. Overview
- 17.2.10.2. Products
- 17.2.10.3. SWOT Analysis
- 17.2.10.4. Recent Developments
- 17.2.10.5. Financials (Based on Availability)
- 17.2.1 SAILPOINT TECHNOLOGIES INC
List of Figures
- Figure 1: Global ServiceNow Store Apps Market Revenue Breakdown (Million, %) by Region 2024 & 2032
- Figure 2: North America ServiceNow Store Apps Market Revenue (Million), by Country 2024 & 2032
- Figure 3: North America ServiceNow Store Apps Market Revenue Share (%), by Country 2024 & 2032
- Figure 4: Europe ServiceNow Store Apps Market Revenue (Million), by Country 2024 & 2032
- Figure 5: Europe ServiceNow Store Apps Market Revenue Share (%), by Country 2024 & 2032
- Figure 6: Asia Pacific ServiceNow Store Apps Market Revenue (Million), by Country 2024 & 2032
- Figure 7: Asia Pacific ServiceNow Store Apps Market Revenue Share (%), by Country 2024 & 2032
- Figure 8: South America ServiceNow Store Apps Market Revenue (Million), by Country 2024 & 2032
- Figure 9: South America ServiceNow Store Apps Market Revenue Share (%), by Country 2024 & 2032
- Figure 10: North America ServiceNow Store Apps Market Revenue (Million), by Country 2024 & 2032
- Figure 11: North America ServiceNow Store Apps Market Revenue Share (%), by Country 2024 & 2032
- Figure 12: MEA ServiceNow Store Apps Market Revenue (Million), by Country 2024 & 2032
- Figure 13: MEA ServiceNow Store Apps Market Revenue Share (%), by Country 2024 & 2032
- Figure 14: North America ServiceNow Store Apps Market Revenue (Million), by Type 2024 & 2032
- Figure 15: North America ServiceNow Store Apps Market Revenue Share (%), by Type 2024 & 2032
- Figure 16: North America ServiceNow Store Apps Market Revenue (Million), by Enterprise Size 2024 & 2032
- Figure 17: North America ServiceNow Store Apps Market Revenue Share (%), by Enterprise Size 2024 & 2032
- Figure 18: North America ServiceNow Store Apps Market Revenue (Million), by Country 2024 & 2032
- Figure 19: North America ServiceNow Store Apps Market Revenue Share (%), by Country 2024 & 2032
- Figure 20: Europe ServiceNow Store Apps Market Revenue (Million), by Type 2024 & 2032
- Figure 21: Europe ServiceNow Store Apps Market Revenue Share (%), by Type 2024 & 2032
- Figure 22: Europe ServiceNow Store Apps Market Revenue (Million), by Enterprise Size 2024 & 2032
- Figure 23: Europe ServiceNow Store Apps Market Revenue Share (%), by Enterprise Size 2024 & 2032
- Figure 24: Europe ServiceNow Store Apps Market Revenue (Million), by Country 2024 & 2032
- Figure 25: Europe ServiceNow Store Apps Market Revenue Share (%), by Country 2024 & 2032
- Figure 26: Asia ServiceNow Store Apps Market Revenue (Million), by Type 2024 & 2032
- Figure 27: Asia ServiceNow Store Apps Market Revenue Share (%), by Type 2024 & 2032
- Figure 28: Asia ServiceNow Store Apps Market Revenue (Million), by Enterprise Size 2024 & 2032
- Figure 29: Asia ServiceNow Store Apps Market Revenue Share (%), by Enterprise Size 2024 & 2032
- Figure 30: Asia ServiceNow Store Apps Market Revenue (Million), by Country 2024 & 2032
- Figure 31: Asia ServiceNow Store Apps Market Revenue Share (%), by Country 2024 & 2032
- Figure 32: Latin America ServiceNow Store Apps Market Revenue (Million), by Type 2024 & 2032
- Figure 33: Latin America ServiceNow Store Apps Market Revenue Share (%), by Type 2024 & 2032
- Figure 34: Latin America ServiceNow Store Apps Market Revenue (Million), by Enterprise Size 2024 & 2032
- Figure 35: Latin America ServiceNow Store Apps Market Revenue Share (%), by Enterprise Size 2024 & 2032
- Figure 36: Latin America ServiceNow Store Apps Market Revenue (Million), by Country 2024 & 2032
- Figure 37: Latin America ServiceNow Store Apps Market Revenue Share (%), by Country 2024 & 2032
- Figure 38: Middle East and Africa ServiceNow Store Apps Market Revenue (Million), by Type 2024 & 2032
- Figure 39: Middle East and Africa ServiceNow Store Apps Market Revenue Share (%), by Type 2024 & 2032
- Figure 40: Middle East and Africa ServiceNow Store Apps Market Revenue (Million), by Enterprise Size 2024 & 2032
- Figure 41: Middle East and Africa ServiceNow Store Apps Market Revenue Share (%), by Enterprise Size 2024 & 2032
- Figure 42: Middle East and Africa ServiceNow Store Apps Market Revenue (Million), by Country 2024 & 2032
- Figure 43: Middle East and Africa ServiceNow Store Apps Market Revenue Share (%), by Country 2024 & 2032
List of Tables
- Table 1: Global ServiceNow Store Apps Market Revenue Million Forecast, by Region 2019 & 2032
- Table 2: Global ServiceNow Store Apps Market Revenue Million Forecast, by Type 2019 & 2032
- Table 3: Global ServiceNow Store Apps Market Revenue Million Forecast, by Enterprise Size 2019 & 2032
- Table 4: Global ServiceNow Store Apps Market Revenue Million Forecast, by Region 2019 & 2032
- Table 5: Global ServiceNow Store Apps Market Revenue Million Forecast, by Country 2019 & 2032
- Table 6: United States ServiceNow Store Apps Market Revenue (Million) Forecast, by Application 2019 & 2032
- Table 7: Canada ServiceNow Store Apps Market Revenue (Million) Forecast, by Application 2019 & 2032
- Table 8: Mexico ServiceNow Store Apps Market Revenue (Million) Forecast, by Application 2019 & 2032
- Table 9: Global ServiceNow Store Apps Market Revenue Million Forecast, by Country 2019 & 2032
- Table 10: Germany ServiceNow Store Apps Market Revenue (Million) Forecast, by Application 2019 & 2032
- Table 11: United Kingdom ServiceNow Store Apps Market Revenue (Million) Forecast, by Application 2019 & 2032
- Table 12: France ServiceNow Store Apps Market Revenue (Million) Forecast, by Application 2019 & 2032
- Table 13: Spain ServiceNow Store Apps Market Revenue (Million) Forecast, by Application 2019 & 2032
- Table 14: Italy ServiceNow Store Apps Market Revenue (Million) Forecast, by Application 2019 & 2032
- Table 15: Spain ServiceNow Store Apps Market Revenue (Million) Forecast, by Application 2019 & 2032
- Table 16: Belgium ServiceNow Store Apps Market Revenue (Million) Forecast, by Application 2019 & 2032
- Table 17: Netherland ServiceNow Store Apps Market Revenue (Million) Forecast, by Application 2019 & 2032
- Table 18: Nordics ServiceNow Store Apps Market Revenue (Million) Forecast, by Application 2019 & 2032
- Table 19: Rest of Europe ServiceNow Store Apps Market Revenue (Million) Forecast, by Application 2019 & 2032
- Table 20: Global ServiceNow Store Apps Market Revenue Million Forecast, by Country 2019 & 2032
- Table 21: China ServiceNow Store Apps Market Revenue (Million) Forecast, by Application 2019 & 2032
- Table 22: Japan ServiceNow Store Apps Market Revenue (Million) Forecast, by Application 2019 & 2032
- Table 23: India ServiceNow Store Apps Market Revenue (Million) Forecast, by Application 2019 & 2032
- Table 24: South Korea ServiceNow Store Apps Market Revenue (Million) Forecast, by Application 2019 & 2032
- Table 25: Southeast Asia ServiceNow Store Apps Market Revenue (Million) Forecast, by Application 2019 & 2032
- Table 26: Australia ServiceNow Store Apps Market Revenue (Million) Forecast, by Application 2019 & 2032
- Table 27: Indonesia ServiceNow Store Apps Market Revenue (Million) Forecast, by Application 2019 & 2032
- Table 28: Phillipes ServiceNow Store Apps Market Revenue (Million) Forecast, by Application 2019 & 2032
- Table 29: Singapore ServiceNow Store Apps Market Revenue (Million) Forecast, by Application 2019 & 2032
- Table 30: Thailandc ServiceNow Store Apps Market Revenue (Million) Forecast, by Application 2019 & 2032
- Table 31: Rest of Asia Pacific ServiceNow Store Apps Market Revenue (Million) Forecast, by Application 2019 & 2032
- Table 32: Global ServiceNow Store Apps Market Revenue Million Forecast, by Country 2019 & 2032
- Table 33: Brazil ServiceNow Store Apps Market Revenue (Million) Forecast, by Application 2019 & 2032
- Table 34: Argentina ServiceNow Store Apps Market Revenue (Million) Forecast, by Application 2019 & 2032
- Table 35: Peru ServiceNow Store Apps Market Revenue (Million) Forecast, by Application 2019 & 2032
- Table 36: Chile ServiceNow Store Apps Market Revenue (Million) Forecast, by Application 2019 & 2032
- Table 37: Colombia ServiceNow Store Apps Market Revenue (Million) Forecast, by Application 2019 & 2032
- Table 38: Ecuador ServiceNow Store Apps Market Revenue (Million) Forecast, by Application 2019 & 2032
- Table 39: Venezuela ServiceNow Store Apps Market Revenue (Million) Forecast, by Application 2019 & 2032
- Table 40: Rest of South America ServiceNow Store Apps Market Revenue (Million) Forecast, by Application 2019 & 2032
- Table 41: Global ServiceNow Store Apps Market Revenue Million Forecast, by Country 2019 & 2032
- Table 42: United States ServiceNow Store Apps Market Revenue (Million) Forecast, by Application 2019 & 2032
- Table 43: Canada ServiceNow Store Apps Market Revenue (Million) Forecast, by Application 2019 & 2032
- Table 44: Mexico ServiceNow Store Apps Market Revenue (Million) Forecast, by Application 2019 & 2032
- Table 45: Global ServiceNow Store Apps Market Revenue Million Forecast, by Country 2019 & 2032
- Table 46: United Arab Emirates ServiceNow Store Apps Market Revenue (Million) Forecast, by Application 2019 & 2032
- Table 47: Saudi Arabia ServiceNow Store Apps Market Revenue (Million) Forecast, by Application 2019 & 2032
- Table 48: South Africa ServiceNow Store Apps Market Revenue (Million) Forecast, by Application 2019 & 2032
- Table 49: Rest of Middle East and Africa ServiceNow Store Apps Market Revenue (Million) Forecast, by Application 2019 & 2032
- Table 50: Global ServiceNow Store Apps Market Revenue Million Forecast, by Type 2019 & 2032
- Table 51: Global ServiceNow Store Apps Market Revenue Million Forecast, by Enterprise Size 2019 & 2032
- Table 52: Global ServiceNow Store Apps Market Revenue Million Forecast, by Country 2019 & 2032
- Table 53: Global ServiceNow Store Apps Market Revenue Million Forecast, by Type 2019 & 2032
- Table 54: Global ServiceNow Store Apps Market Revenue Million Forecast, by Enterprise Size 2019 & 2032
- Table 55: Global ServiceNow Store Apps Market Revenue Million Forecast, by Country 2019 & 2032
- Table 56: Global ServiceNow Store Apps Market Revenue Million Forecast, by Type 2019 & 2032
- Table 57: Global ServiceNow Store Apps Market Revenue Million Forecast, by Enterprise Size 2019 & 2032
- Table 58: Global ServiceNow Store Apps Market Revenue Million Forecast, by Country 2019 & 2032
- Table 59: Global ServiceNow Store Apps Market Revenue Million Forecast, by Type 2019 & 2032
- Table 60: Global ServiceNow Store Apps Market Revenue Million Forecast, by Enterprise Size 2019 & 2032
- Table 61: Global ServiceNow Store Apps Market Revenue Million Forecast, by Country 2019 & 2032
- Table 62: Global ServiceNow Store Apps Market Revenue Million Forecast, by Type 2019 & 2032
- Table 63: Global ServiceNow Store Apps Market Revenue Million Forecast, by Enterprise Size 2019 & 2032
- Table 64: Global ServiceNow Store Apps Market Revenue Million Forecast, by Country 2019 & 2032
Frequently Asked Questions
1. What is the projected Compound Annual Growth Rate (CAGR) of the ServiceNow Store Apps Market?
The projected CAGR is approximately 32.73%.
2. Which companies are prominent players in the ServiceNow Store Apps Market?
Key companies in the market include SAILPOINT TECHNOLOGIES INC, IBM Corporation, teamviewer, PagerDuty, Microsoft Corporation*List Not Exhaustive, xMatters Inc, Cisco Systems Inc, Okta Inc, Talkdesk Inc, Dynatrace LLC.
3. What are the main segments of the ServiceNow Store Apps Market?
The market segments include Type, Enterprise Size.
4. Can you provide details about the market size?
The market size is estimated to be USD XX Million as of 2022.
5. What are some drivers contributing to market growth?
Rise in adoption of cloud services and cloud computing; Rise in digital platforms and adoption of advance technologies.
6. What are the notable trends driving market growth?
Cloud-Based is Expected to Hold Significant Share of the Market.
7. Are there any restraints impacting market growth?
High upfront and licensing costs.
8. Can you provide examples of recent developments in the market?
May 2023: xtype, the renowned agile software delivery company, announced the launch of xtype View, an innovative multi-instance viewer and platform engineering dashboard exclusively designed for ServiceNow professionals. As the inaugural real-time, multi-instance dashboard tailored specifically for ServiceNow experts, xtype View offers a comprehensive solution to effortlessly monitor all plugins and applications within their ServiceNow ecosystem from a single unified interface. xtype View is available free of charge and is poised to significantly mitigate the challenges associated with configuration discrepancies, ultimately enhancing the ServiceNow experience.
9. What pricing options are available for accessing the report?
Pricing options include single-user, multi-user, and enterprise licenses priced at USD 4750, USD 5250, and USD 8750 respectively.
10. Is the market size provided in terms of value or volume?
The market size is provided in terms of value, measured in Million.
11. Are there any specific market keywords associated with the report?
Yes, the market keyword associated with the report is "ServiceNow Store Apps Market," which aids in identifying and referencing the specific market segment covered.
12. How do I determine which pricing option suits my needs best?
The pricing options vary based on user requirements and access needs. Individual users may opt for single-user licenses, while businesses requiring broader access may choose multi-user or enterprise licenses for cost-effective access to the report.
13. Are there any additional resources or data provided in the ServiceNow Store Apps Market report?
While the report offers comprehensive insights, it's advisable to review the specific contents or supplementary materials provided to ascertain if additional resources or data are available.
14. How can I stay updated on further developments or reports in the ServiceNow Store Apps Market?
To stay informed about further developments, trends, and reports in the ServiceNow Store Apps Market, consider subscribing to industry newsletters, following relevant companies and organizations, or regularly checking reputable industry news sources and publications.
Methodology
Step 1 - Identification of Relevant Samples Size from Population Database


Step 2 - Approaches for Defining Global Market Size (Value, Volume* & Price*)

Note*: In applicable scenarios
Step 3 - Data Sources
Primary Research
- Web Analytics
- Survey Reports
- Research Institute
- Latest Research Reports
- Opinion Leaders
Secondary Research
- Annual Reports
- White Paper
- Latest Press Release
- Industry Association
- Paid Database
- Investor Presentations

Step 4 - Data Triangulation
Involves using different sources of information in order to increase the validity of a study
These sources are likely to be stakeholders in a program - participants, other researchers, program staff, other community members, and so on.
Then we put all data in single framework & apply various statistical tools to find out the dynamic on the market.
During the analysis stage, feedback from the stakeholder groups would be compared to determine areas of agreement as well as areas of divergence
