

Key Insights
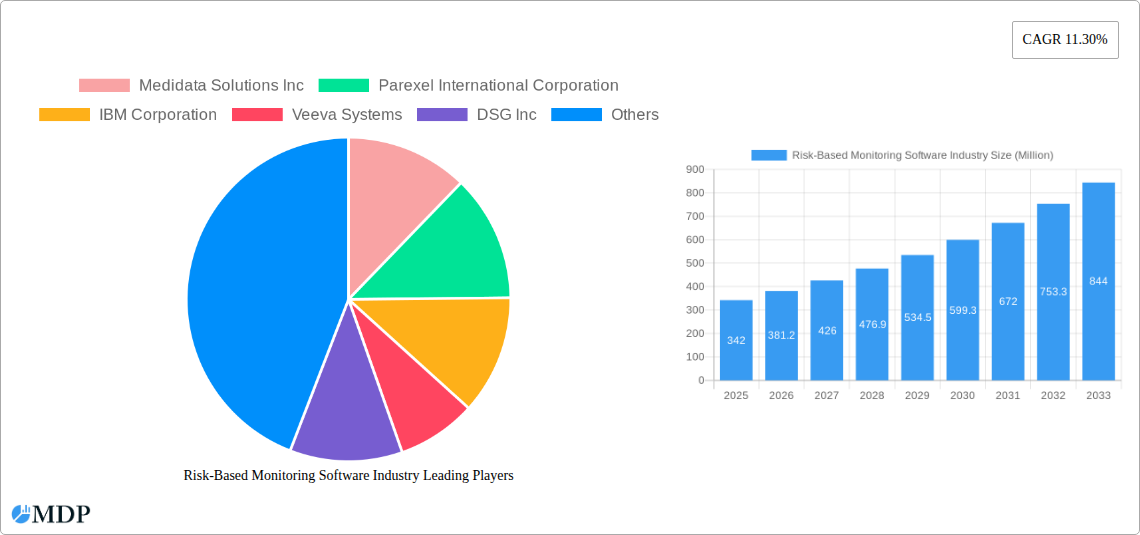
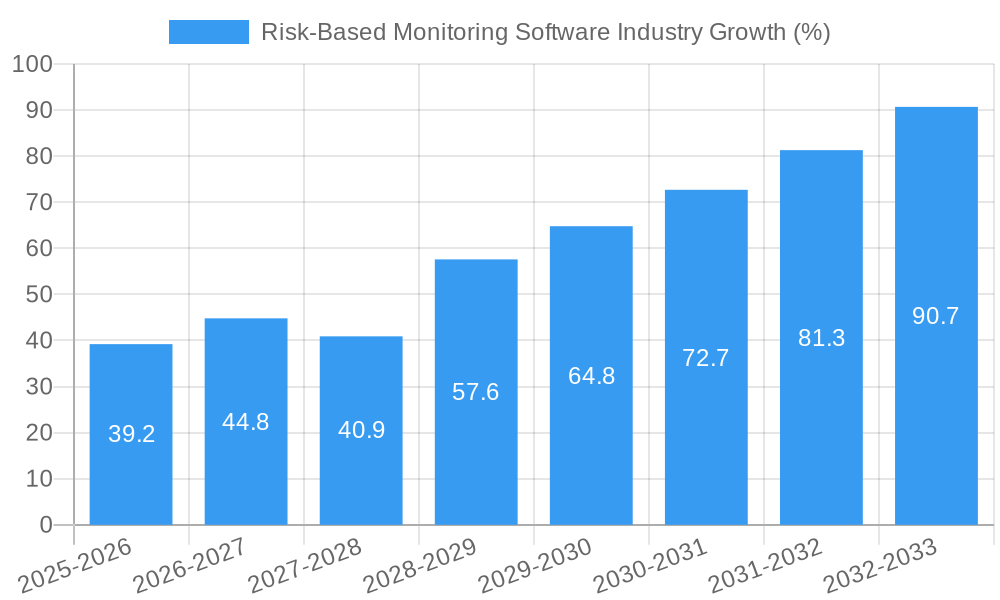
The Risk-Based Monitoring (RBM) software market, currently valued at $342 million in 2025, is experiencing robust growth, projected to expand at a Compound Annual Growth Rate (CAGR) of 11.30% from 2025 to 2033. This growth is fueled by several key factors. Increasing regulatory scrutiny and the need for more efficient clinical trial management are driving pharmaceutical and biotech companies to adopt RBM solutions. These sophisticated systems allow for proactive identification and mitigation of risks, leading to cost savings, faster trial completion times, and improved data quality. The rise of decentralized clinical trials (DCTs) further accelerates RBM adoption, as remote monitoring requires robust and adaptable software to manage geographically dispersed data and patient interactions. Furthermore, technological advancements, such as the integration of artificial intelligence (AI) and machine learning (ML) into RBM platforms, are enhancing the capabilities of these systems, allowing for more accurate risk assessment and predictive analytics. Key players like Medidata Solutions, Parexel, IBM, Veeva Systems, and others are actively contributing to market growth through continuous innovation and strategic partnerships.
The competitive landscape is characterized by a mix of established players and emerging technology providers. While established players benefit from extensive experience and existing customer bases, newer entrants are leveraging innovative technologies to disrupt the market. The market is segmented by deployment model (cloud-based and on-premise), functionality (data collection, analysis, reporting), and end-user (pharmaceutical companies, CROs). Despite the positive growth trajectory, market expansion may be slightly tempered by factors such as the high initial investment cost for RBM software and the need for robust data security measures. However, the overall long-term outlook for the RBM software market remains extremely positive, driven by the continuous demand for improved efficiency and regulatory compliance within the clinical trials industry.
Risk-Based Monitoring (RBM) Software Market Report: 2019-2033
This comprehensive report provides a detailed analysis of the Risk-Based Monitoring (RBM) Software market, offering actionable insights for industry stakeholders. With a study period spanning 2019-2033, a base year of 2025, and a forecast period of 2025-2033, this report unveils the market's dynamics, trends, and future potential. The report analyzes key players such as Medidata Solutions Inc, Parexel International Corporation, IBM Corporation, Veeva Systems, DSG Inc, MedNet Solutions Inc, Signant Health, OpenClinica LLC, Oracle, and Anju Software (list not exhaustive) and presents a comprehensive overview of the market's current state and future trajectory, encompassing market size estimations in Millions.
Risk-Based Monitoring Software Industry Market Dynamics & Concentration
The Risk-Based Monitoring (RBM) Software market is characterized by a moderately concentrated landscape, with a few major players holding significant market share. The xx% market share held by the top 5 players in 2024 reflects a consolidating trend. Innovation in areas like AI and machine learning is a key driver, enhancing data analysis and efficiency within clinical trials. Stringent regulatory frameworks, particularly those governing data privacy and security, significantly impact market operations. The increasing adoption of cloud-based solutions presents a viable substitute for traditional on-premise software. End-user trends favor solutions that seamlessly integrate with existing clinical trial management systems and offer advanced analytics capabilities. The market has witnessed xx M&A deals in the historical period (2019-2024), indicating consolidation and strategic expansion among key players.
- Market Concentration: Top 5 players hold approximately xx% of market share in 2024.
- Innovation Drivers: AI, machine learning, cloud computing, and enhanced data analytics.
- Regulatory Frameworks: HIPAA, GDPR, and other relevant data privacy regulations.
- Product Substitutes: Cloud-based solutions, traditional on-premise systems.
- End-User Trends: Demand for seamless integration and advanced analytics.
- M&A Activity: xx deals recorded between 2019 and 2024.
Risk-Based Monitoring Software Industry Industry Trends & Analysis
The RBM Software market exhibits a robust Compound Annual Growth Rate (CAGR) of xx% during the forecast period (2025-2033). This growth is driven primarily by increasing adoption of RBM methodologies by pharmaceutical and biotechnology companies, aiming for increased efficiency and reduced costs in clinical trials. Technological disruptions, particularly the integration of AI and machine learning, significantly enhance data analysis and risk identification. Consumer preference leans towards user-friendly interfaces, robust security features, and cost-effective solutions. Competitive dynamics are shaped by product innovation, strategic partnerships, and mergers and acquisitions. Market penetration remains relatively high in developed regions, with significant growth potential in emerging markets.
Leading Markets & Segments in Risk-Based Monitoring Software Industry
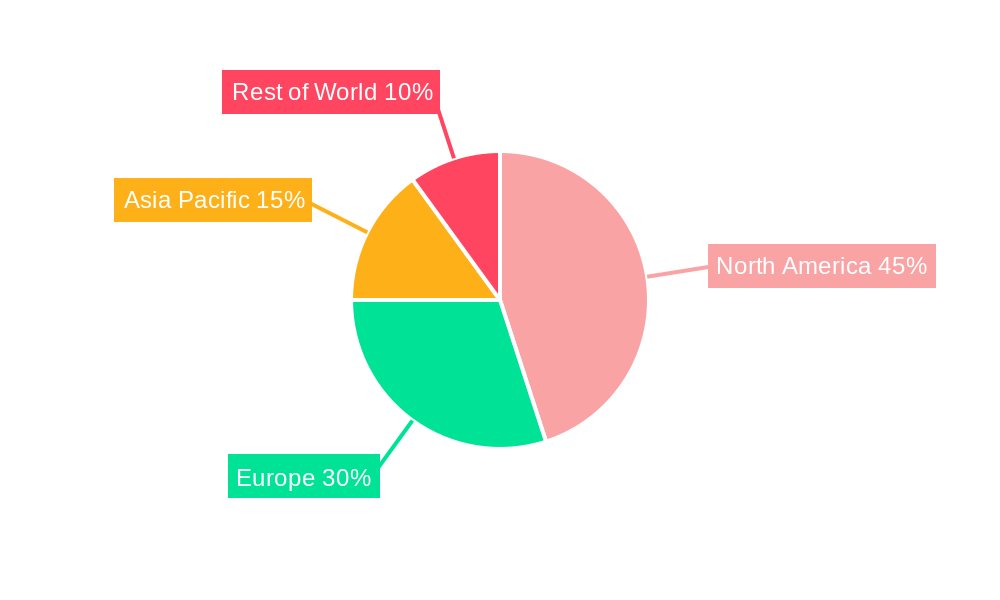
The North American region currently dominates the RBM Software market, accounting for approximately xx% of the global market share in 2024. This dominance is primarily attributed to the presence of major pharmaceutical companies, robust regulatory frameworks supporting technological adoption, and increased investment in research and development.
- Key Drivers in North America:
- Strong presence of major pharmaceutical and biotechnology companies.
- Well-established regulatory frameworks and infrastructure.
- High investment in research and development.
- Dominance Analysis: The high concentration of pharmaceutical companies and advanced healthcare infrastructure in North America fuels significant demand for sophisticated RBM software solutions. The region's early adoption of RBM methodologies further contributes to its market leadership.
Risk-Based Monitoring Software Industry Product Developments
Recent product innovations focus on integrating artificial intelligence (AI) and machine learning (ML) capabilities into RBM software. This allows for more sophisticated risk assessment, predictive modeling, and automated data analysis. These new features offer competitive advantages, enabling faster and more accurate identification of potential risks within clinical trials. This enhances trial efficiency and improves the quality of data collected. The market also sees a growing trend towards cloud-based solutions, promoting scalability and accessibility.
Key Drivers of Risk-Based Monitoring Software Industry Growth
The RBM Software market's growth is fueled by several key factors:
- Technological Advancements: AI, machine learning, and cloud computing are enhancing data analysis and risk identification.
- Economic Factors: The increasing cost of clinical trials incentivizes the adoption of cost-effective solutions like RBM software.
- Regulatory Changes: Regulatory bodies are increasingly encouraging the use of RBM to improve the quality and efficiency of clinical trials.
Challenges in the Risk-Based Monitoring Software Industry Market
The RBM Software market faces challenges, including:
- Regulatory Hurdles: Navigating complex data privacy regulations and ensuring compliance can be costly and time-consuming.
- Supply Chain Issues: The availability of skilled personnel to develop and implement RBM solutions can be a constraint.
- Competitive Pressures: The market's competitive nature necessitates continuous innovation and adaptation to maintain market share.
Emerging Opportunities in Risk-Based Monitoring Software Industry
Long-term growth is fueled by technological breakthroughs, strategic partnerships, and market expansion:
- AI/ML Integration: Further advancements in AI and ML will revolutionize data analysis and risk prediction, creating new market opportunities.
- Strategic Partnerships: Collaborations between RBM software providers and pharmaceutical companies will drive wider adoption.
- Market Expansion: Expanding into emerging markets with increasing healthcare expenditure presents significant potential.
Leading Players in the Risk-Based Monitoring Software Industry Sector
- Medidata Solutions Inc
- Parexel International Corporation
- IBM Corporation
- Veeva Systems
- DSG Inc
- MedNet Solutions Inc
- Signant Health
- OpenClinica LLC
- Oracle
- Anju Software
Key Milestones in Risk-Based Monitoring Software Industry Industry
- June 2024: Medidata launched Medidata Clinical Data Studio, enhancing data quality control and accelerating trial timelines, boosting RBM adoption.
- April 2024: Parexel and Palantir's alliance leveraged AI to improve clinical trial safety and efficiency, advancing RBM capabilities.
Strategic Outlook for Risk-Based Monitoring Software Industry Market
The future of the RBM Software market appears bright, driven by continuous technological advancements, expanding adoption rates, and the increasing focus on efficient and cost-effective clinical trials. Strategic partnerships and the development of innovative solutions will remain key factors in shaping the market's future trajectory. The market is projected to reach xx Million by 2033, presenting significant growth opportunities for established players and new entrants alike.
Risk-Based Monitoring Software Industry Segmentation
-
1. Component
- 1.1. Software
- 1.2. Services
-
2. Delivery Mode
- 2.1. Web Based
- 2.2. On-premise
- 2.3. Cloud-based
-
3. End User
- 3.1. Pharma and Biopharmaceutical Companies
- 3.2. Medical Device Companies
- 3.3. Contract Research Organizations (CRO)
- 3.4. Other End Users
Risk-Based Monitoring Software Industry Segmentation By Geography
-
1. North America
- 1.1. United States
- 1.2. Canada
- 1.3. Mexico
-
2. Europe
- 2.1. Germany
- 2.2. United Kingdom
- 2.3. France
- 2.4. Italy
- 2.5. Spain
- 2.6. Rest of Europe
-
3. Asia Pacific
- 3.1. China
- 3.2. Japan
- 3.3. India
- 3.4. Australia
- 3.5. South Korea
- 3.6. Rest of Asia Pacific
- 4. Rest of the World
Risk-Based Monitoring Software Industry REPORT HIGHLIGHTS
| Aspects | Details |
|---|---|
| Study Period | 2019-2033 |
| Base Year | 2024 |
| Estimated Year | 2025 |
| Forecast Period | 2025-2033 |
| Historical Period | 2019-2024 |
| Growth Rate | CAGR of 11.30% from 2019-2033 |
| Segmentation |
|
Table of Contents
- 1. Introduction
- 1.1. Research Scope
- 1.2. Market Segmentation
- 1.3. Research Methodology
- 1.4. Definitions and Assumptions
- 2. Executive Summary
- 2.1. Introduction
- 3. Market Dynamics
- 3.1. Introduction
- 3.2. Market Drivers
- 3.2.1. High Efficiency of Risk-Based Monitoring Software Coupled with Growing Government Funding and Support for Clinical Trials; Advancements in Technology
- 3.3. Market Restrains
- 3.3.1. High Efficiency of Risk-Based Monitoring Software Coupled with Growing Government Funding and Support for Clinical Trials; Advancements in Technology
- 3.4. Market Trends
- 3.4.1. The Service Segment is Expected to Hold a Significant Share in the Market During the Forecast Period
- 4. Market Factor Analysis
- 4.1. Porters Five Forces
- 4.2. Supply/Value Chain
- 4.3. PESTEL analysis
- 4.4. Market Entropy
- 4.5. Patent/Trademark Analysis
- 5. Global Risk-Based Monitoring Software Industry Analysis, Insights and Forecast, 2019-2031
- 5.1. Market Analysis, Insights and Forecast - by Component
- 5.1.1. Software
- 5.1.2. Services
- 5.2. Market Analysis, Insights and Forecast - by Delivery Mode
- 5.2.1. Web Based
- 5.2.2. On-premise
- 5.2.3. Cloud-based
- 5.3. Market Analysis, Insights and Forecast - by End User
- 5.3.1. Pharma and Biopharmaceutical Companies
- 5.3.2. Medical Device Companies
- 5.3.3. Contract Research Organizations (CRO)
- 5.3.4. Other End Users
- 5.4. Market Analysis, Insights and Forecast - by Region
- 5.4.1. North America
- 5.4.2. Europe
- 5.4.3. Asia Pacific
- 5.4.4. Rest of the World
- 5.1. Market Analysis, Insights and Forecast - by Component
- 6. North America Risk-Based Monitoring Software Industry Analysis, Insights and Forecast, 2019-2031
- 6.1. Market Analysis, Insights and Forecast - by Component
- 6.1.1. Software
- 6.1.2. Services
- 6.2. Market Analysis, Insights and Forecast - by Delivery Mode
- 6.2.1. Web Based
- 6.2.2. On-premise
- 6.2.3. Cloud-based
- 6.3. Market Analysis, Insights and Forecast - by End User
- 6.3.1. Pharma and Biopharmaceutical Companies
- 6.3.2. Medical Device Companies
- 6.3.3. Contract Research Organizations (CRO)
- 6.3.4. Other End Users
- 6.1. Market Analysis, Insights and Forecast - by Component
- 7. Europe Risk-Based Monitoring Software Industry Analysis, Insights and Forecast, 2019-2031
- 7.1. Market Analysis, Insights and Forecast - by Component
- 7.1.1. Software
- 7.1.2. Services
- 7.2. Market Analysis, Insights and Forecast - by Delivery Mode
- 7.2.1. Web Based
- 7.2.2. On-premise
- 7.2.3. Cloud-based
- 7.3. Market Analysis, Insights and Forecast - by End User
- 7.3.1. Pharma and Biopharmaceutical Companies
- 7.3.2. Medical Device Companies
- 7.3.3. Contract Research Organizations (CRO)
- 7.3.4. Other End Users
- 7.1. Market Analysis, Insights and Forecast - by Component
- 8. Asia Pacific Risk-Based Monitoring Software Industry Analysis, Insights and Forecast, 2019-2031
- 8.1. Market Analysis, Insights and Forecast - by Component
- 8.1.1. Software
- 8.1.2. Services
- 8.2. Market Analysis, Insights and Forecast - by Delivery Mode
- 8.2.1. Web Based
- 8.2.2. On-premise
- 8.2.3. Cloud-based
- 8.3. Market Analysis, Insights and Forecast - by End User
- 8.3.1. Pharma and Biopharmaceutical Companies
- 8.3.2. Medical Device Companies
- 8.3.3. Contract Research Organizations (CRO)
- 8.3.4. Other End Users
- 8.1. Market Analysis, Insights and Forecast - by Component
- 9. Rest of the World Risk-Based Monitoring Software Industry Analysis, Insights and Forecast, 2019-2031
- 9.1. Market Analysis, Insights and Forecast - by Component
- 9.1.1. Software
- 9.1.2. Services
- 9.2. Market Analysis, Insights and Forecast - by Delivery Mode
- 9.2.1. Web Based
- 9.2.2. On-premise
- 9.2.3. Cloud-based
- 9.3. Market Analysis, Insights and Forecast - by End User
- 9.3.1. Pharma and Biopharmaceutical Companies
- 9.3.2. Medical Device Companies
- 9.3.3. Contract Research Organizations (CRO)
- 9.3.4. Other End Users
- 9.1. Market Analysis, Insights and Forecast - by Component
- 10. Competitive Analysis
- 10.1. Global Market Share Analysis 2024
- 10.2. Company Profiles
- 10.2.1 Medidata Solutions Inc
- 10.2.1.1. Overview
- 10.2.1.2. Products
- 10.2.1.3. SWOT Analysis
- 10.2.1.4. Recent Developments
- 10.2.1.5. Financials (Based on Availability)
- 10.2.2 Parexel International Corporation
- 10.2.2.1. Overview
- 10.2.2.2. Products
- 10.2.2.3. SWOT Analysis
- 10.2.2.4. Recent Developments
- 10.2.2.5. Financials (Based on Availability)
- 10.2.3 IBM Corporation
- 10.2.3.1. Overview
- 10.2.3.2. Products
- 10.2.3.3. SWOT Analysis
- 10.2.3.4. Recent Developments
- 10.2.3.5. Financials (Based on Availability)
- 10.2.4 Veeva Systems
- 10.2.4.1. Overview
- 10.2.4.2. Products
- 10.2.4.3. SWOT Analysis
- 10.2.4.4. Recent Developments
- 10.2.4.5. Financials (Based on Availability)
- 10.2.5 DSG Inc
- 10.2.5.1. Overview
- 10.2.5.2. Products
- 10.2.5.3. SWOT Analysis
- 10.2.5.4. Recent Developments
- 10.2.5.5. Financials (Based on Availability)
- 10.2.6 MedNet Solutions Inc
- 10.2.6.1. Overview
- 10.2.6.2. Products
- 10.2.6.3. SWOT Analysis
- 10.2.6.4. Recent Developments
- 10.2.6.5. Financials (Based on Availability)
- 10.2.7 Signant Health
- 10.2.7.1. Overview
- 10.2.7.2. Products
- 10.2.7.3. SWOT Analysis
- 10.2.7.4. Recent Developments
- 10.2.7.5. Financials (Based on Availability)
- 10.2.8 OpenClinica LLC
- 10.2.8.1. Overview
- 10.2.8.2. Products
- 10.2.8.3. SWOT Analysis
- 10.2.8.4. Recent Developments
- 10.2.8.5. Financials (Based on Availability)
- 10.2.9 Oracle
- 10.2.9.1. Overview
- 10.2.9.2. Products
- 10.2.9.3. SWOT Analysis
- 10.2.9.4. Recent Developments
- 10.2.9.5. Financials (Based on Availability)
- 10.2.10 Anju Software*List Not Exhaustive
- 10.2.10.1. Overview
- 10.2.10.2. Products
- 10.2.10.3. SWOT Analysis
- 10.2.10.4. Recent Developments
- 10.2.10.5. Financials (Based on Availability)
- 10.2.1 Medidata Solutions Inc
List of Figures
- Figure 1: Global Risk-Based Monitoring Software Industry Revenue Breakdown (Million, %) by Region 2024 & 2032
- Figure 2: Global Risk-Based Monitoring Software Industry Volume Breakdown (Million, %) by Region 2024 & 2032
- Figure 3: North America Risk-Based Monitoring Software Industry Revenue (Million), by Component 2024 & 2032
- Figure 4: North America Risk-Based Monitoring Software Industry Volume (Million), by Component 2024 & 2032
- Figure 5: North America Risk-Based Monitoring Software Industry Revenue Share (%), by Component 2024 & 2032
- Figure 6: North America Risk-Based Monitoring Software Industry Volume Share (%), by Component 2024 & 2032
- Figure 7: North America Risk-Based Monitoring Software Industry Revenue (Million), by Delivery Mode 2024 & 2032
- Figure 8: North America Risk-Based Monitoring Software Industry Volume (Million), by Delivery Mode 2024 & 2032
- Figure 9: North America Risk-Based Monitoring Software Industry Revenue Share (%), by Delivery Mode 2024 & 2032
- Figure 10: North America Risk-Based Monitoring Software Industry Volume Share (%), by Delivery Mode 2024 & 2032
- Figure 11: North America Risk-Based Monitoring Software Industry Revenue (Million), by End User 2024 & 2032
- Figure 12: North America Risk-Based Monitoring Software Industry Volume (Million), by End User 2024 & 2032
- Figure 13: North America Risk-Based Monitoring Software Industry Revenue Share (%), by End User 2024 & 2032
- Figure 14: North America Risk-Based Monitoring Software Industry Volume Share (%), by End User 2024 & 2032
- Figure 15: North America Risk-Based Monitoring Software Industry Revenue (Million), by Country 2024 & 2032
- Figure 16: North America Risk-Based Monitoring Software Industry Volume (Million), by Country 2024 & 2032
- Figure 17: North America Risk-Based Monitoring Software Industry Revenue Share (%), by Country 2024 & 2032
- Figure 18: North America Risk-Based Monitoring Software Industry Volume Share (%), by Country 2024 & 2032
- Figure 19: Europe Risk-Based Monitoring Software Industry Revenue (Million), by Component 2024 & 2032
- Figure 20: Europe Risk-Based Monitoring Software Industry Volume (Million), by Component 2024 & 2032
- Figure 21: Europe Risk-Based Monitoring Software Industry Revenue Share (%), by Component 2024 & 2032
- Figure 22: Europe Risk-Based Monitoring Software Industry Volume Share (%), by Component 2024 & 2032
- Figure 23: Europe Risk-Based Monitoring Software Industry Revenue (Million), by Delivery Mode 2024 & 2032
- Figure 24: Europe Risk-Based Monitoring Software Industry Volume (Million), by Delivery Mode 2024 & 2032
- Figure 25: Europe Risk-Based Monitoring Software Industry Revenue Share (%), by Delivery Mode 2024 & 2032
- Figure 26: Europe Risk-Based Monitoring Software Industry Volume Share (%), by Delivery Mode 2024 & 2032
- Figure 27: Europe Risk-Based Monitoring Software Industry Revenue (Million), by End User 2024 & 2032
- Figure 28: Europe Risk-Based Monitoring Software Industry Volume (Million), by End User 2024 & 2032
- Figure 29: Europe Risk-Based Monitoring Software Industry Revenue Share (%), by End User 2024 & 2032
- Figure 30: Europe Risk-Based Monitoring Software Industry Volume Share (%), by End User 2024 & 2032
- Figure 31: Europe Risk-Based Monitoring Software Industry Revenue (Million), by Country 2024 & 2032
- Figure 32: Europe Risk-Based Monitoring Software Industry Volume (Million), by Country 2024 & 2032
- Figure 33: Europe Risk-Based Monitoring Software Industry Revenue Share (%), by Country 2024 & 2032
- Figure 34: Europe Risk-Based Monitoring Software Industry Volume Share (%), by Country 2024 & 2032
- Figure 35: Asia Pacific Risk-Based Monitoring Software Industry Revenue (Million), by Component 2024 & 2032
- Figure 36: Asia Pacific Risk-Based Monitoring Software Industry Volume (Million), by Component 2024 & 2032
- Figure 37: Asia Pacific Risk-Based Monitoring Software Industry Revenue Share (%), by Component 2024 & 2032
- Figure 38: Asia Pacific Risk-Based Monitoring Software Industry Volume Share (%), by Component 2024 & 2032
- Figure 39: Asia Pacific Risk-Based Monitoring Software Industry Revenue (Million), by Delivery Mode 2024 & 2032
- Figure 40: Asia Pacific Risk-Based Monitoring Software Industry Volume (Million), by Delivery Mode 2024 & 2032
- Figure 41: Asia Pacific Risk-Based Monitoring Software Industry Revenue Share (%), by Delivery Mode 2024 & 2032
- Figure 42: Asia Pacific Risk-Based Monitoring Software Industry Volume Share (%), by Delivery Mode 2024 & 2032
- Figure 43: Asia Pacific Risk-Based Monitoring Software Industry Revenue (Million), by End User 2024 & 2032
- Figure 44: Asia Pacific Risk-Based Monitoring Software Industry Volume (Million), by End User 2024 & 2032
- Figure 45: Asia Pacific Risk-Based Monitoring Software Industry Revenue Share (%), by End User 2024 & 2032
- Figure 46: Asia Pacific Risk-Based Monitoring Software Industry Volume Share (%), by End User 2024 & 2032
- Figure 47: Asia Pacific Risk-Based Monitoring Software Industry Revenue (Million), by Country 2024 & 2032
- Figure 48: Asia Pacific Risk-Based Monitoring Software Industry Volume (Million), by Country 2024 & 2032
- Figure 49: Asia Pacific Risk-Based Monitoring Software Industry Revenue Share (%), by Country 2024 & 2032
- Figure 50: Asia Pacific Risk-Based Monitoring Software Industry Volume Share (%), by Country 2024 & 2032
- Figure 51: Rest of the World Risk-Based Monitoring Software Industry Revenue (Million), by Component 2024 & 2032
- Figure 52: Rest of the World Risk-Based Monitoring Software Industry Volume (Million), by Component 2024 & 2032
- Figure 53: Rest of the World Risk-Based Monitoring Software Industry Revenue Share (%), by Component 2024 & 2032
- Figure 54: Rest of the World Risk-Based Monitoring Software Industry Volume Share (%), by Component 2024 & 2032
- Figure 55: Rest of the World Risk-Based Monitoring Software Industry Revenue (Million), by Delivery Mode 2024 & 2032
- Figure 56: Rest of the World Risk-Based Monitoring Software Industry Volume (Million), by Delivery Mode 2024 & 2032
- Figure 57: Rest of the World Risk-Based Monitoring Software Industry Revenue Share (%), by Delivery Mode 2024 & 2032
- Figure 58: Rest of the World Risk-Based Monitoring Software Industry Volume Share (%), by Delivery Mode 2024 & 2032
- Figure 59: Rest of the World Risk-Based Monitoring Software Industry Revenue (Million), by End User 2024 & 2032
- Figure 60: Rest of the World Risk-Based Monitoring Software Industry Volume (Million), by End User 2024 & 2032
- Figure 61: Rest of the World Risk-Based Monitoring Software Industry Revenue Share (%), by End User 2024 & 2032
- Figure 62: Rest of the World Risk-Based Monitoring Software Industry Volume Share (%), by End User 2024 & 2032
- Figure 63: Rest of the World Risk-Based Monitoring Software Industry Revenue (Million), by Country 2024 & 2032
- Figure 64: Rest of the World Risk-Based Monitoring Software Industry Volume (Million), by Country 2024 & 2032
- Figure 65: Rest of the World Risk-Based Monitoring Software Industry Revenue Share (%), by Country 2024 & 2032
- Figure 66: Rest of the World Risk-Based Monitoring Software Industry Volume Share (%), by Country 2024 & 2032
List of Tables
- Table 1: Global Risk-Based Monitoring Software Industry Revenue Million Forecast, by Region 2019 & 2032
- Table 2: Global Risk-Based Monitoring Software Industry Volume Million Forecast, by Region 2019 & 2032
- Table 3: Global Risk-Based Monitoring Software Industry Revenue Million Forecast, by Component 2019 & 2032
- Table 4: Global Risk-Based Monitoring Software Industry Volume Million Forecast, by Component 2019 & 2032
- Table 5: Global Risk-Based Monitoring Software Industry Revenue Million Forecast, by Delivery Mode 2019 & 2032
- Table 6: Global Risk-Based Monitoring Software Industry Volume Million Forecast, by Delivery Mode 2019 & 2032
- Table 7: Global Risk-Based Monitoring Software Industry Revenue Million Forecast, by End User 2019 & 2032
- Table 8: Global Risk-Based Monitoring Software Industry Volume Million Forecast, by End User 2019 & 2032
- Table 9: Global Risk-Based Monitoring Software Industry Revenue Million Forecast, by Region 2019 & 2032
- Table 10: Global Risk-Based Monitoring Software Industry Volume Million Forecast, by Region 2019 & 2032
- Table 11: Global Risk-Based Monitoring Software Industry Revenue Million Forecast, by Component 2019 & 2032
- Table 12: Global Risk-Based Monitoring Software Industry Volume Million Forecast, by Component 2019 & 2032
- Table 13: Global Risk-Based Monitoring Software Industry Revenue Million Forecast, by Delivery Mode 2019 & 2032
- Table 14: Global Risk-Based Monitoring Software Industry Volume Million Forecast, by Delivery Mode 2019 & 2032
- Table 15: Global Risk-Based Monitoring Software Industry Revenue Million Forecast, by End User 2019 & 2032
- Table 16: Global Risk-Based Monitoring Software Industry Volume Million Forecast, by End User 2019 & 2032
- Table 17: Global Risk-Based Monitoring Software Industry Revenue Million Forecast, by Country 2019 & 2032
- Table 18: Global Risk-Based Monitoring Software Industry Volume Million Forecast, by Country 2019 & 2032
- Table 19: United States Risk-Based Monitoring Software Industry Revenue (Million) Forecast, by Application 2019 & 2032
- Table 20: United States Risk-Based Monitoring Software Industry Volume (Million) Forecast, by Application 2019 & 2032
- Table 21: Canada Risk-Based Monitoring Software Industry Revenue (Million) Forecast, by Application 2019 & 2032
- Table 22: Canada Risk-Based Monitoring Software Industry Volume (Million) Forecast, by Application 2019 & 2032
- Table 23: Mexico Risk-Based Monitoring Software Industry Revenue (Million) Forecast, by Application 2019 & 2032
- Table 24: Mexico Risk-Based Monitoring Software Industry Volume (Million) Forecast, by Application 2019 & 2032
- Table 25: Global Risk-Based Monitoring Software Industry Revenue Million Forecast, by Component 2019 & 2032
- Table 26: Global Risk-Based Monitoring Software Industry Volume Million Forecast, by Component 2019 & 2032
- Table 27: Global Risk-Based Monitoring Software Industry Revenue Million Forecast, by Delivery Mode 2019 & 2032
- Table 28: Global Risk-Based Monitoring Software Industry Volume Million Forecast, by Delivery Mode 2019 & 2032
- Table 29: Global Risk-Based Monitoring Software Industry Revenue Million Forecast, by End User 2019 & 2032
- Table 30: Global Risk-Based Monitoring Software Industry Volume Million Forecast, by End User 2019 & 2032
- Table 31: Global Risk-Based Monitoring Software Industry Revenue Million Forecast, by Country 2019 & 2032
- Table 32: Global Risk-Based Monitoring Software Industry Volume Million Forecast, by Country 2019 & 2032
- Table 33: Germany Risk-Based Monitoring Software Industry Revenue (Million) Forecast, by Application 2019 & 2032
- Table 34: Germany Risk-Based Monitoring Software Industry Volume (Million) Forecast, by Application 2019 & 2032
- Table 35: United Kingdom Risk-Based Monitoring Software Industry Revenue (Million) Forecast, by Application 2019 & 2032
- Table 36: United Kingdom Risk-Based Monitoring Software Industry Volume (Million) Forecast, by Application 2019 & 2032
- Table 37: France Risk-Based Monitoring Software Industry Revenue (Million) Forecast, by Application 2019 & 2032
- Table 38: France Risk-Based Monitoring Software Industry Volume (Million) Forecast, by Application 2019 & 2032
- Table 39: Italy Risk-Based Monitoring Software Industry Revenue (Million) Forecast, by Application 2019 & 2032
- Table 40: Italy Risk-Based Monitoring Software Industry Volume (Million) Forecast, by Application 2019 & 2032
- Table 41: Spain Risk-Based Monitoring Software Industry Revenue (Million) Forecast, by Application 2019 & 2032
- Table 42: Spain Risk-Based Monitoring Software Industry Volume (Million) Forecast, by Application 2019 & 2032
- Table 43: Rest of Europe Risk-Based Monitoring Software Industry Revenue (Million) Forecast, by Application 2019 & 2032
- Table 44: Rest of Europe Risk-Based Monitoring Software Industry Volume (Million) Forecast, by Application 2019 & 2032
- Table 45: Global Risk-Based Monitoring Software Industry Revenue Million Forecast, by Component 2019 & 2032
- Table 46: Global Risk-Based Monitoring Software Industry Volume Million Forecast, by Component 2019 & 2032
- Table 47: Global Risk-Based Monitoring Software Industry Revenue Million Forecast, by Delivery Mode 2019 & 2032
- Table 48: Global Risk-Based Monitoring Software Industry Volume Million Forecast, by Delivery Mode 2019 & 2032
- Table 49: Global Risk-Based Monitoring Software Industry Revenue Million Forecast, by End User 2019 & 2032
- Table 50: Global Risk-Based Monitoring Software Industry Volume Million Forecast, by End User 2019 & 2032
- Table 51: Global Risk-Based Monitoring Software Industry Revenue Million Forecast, by Country 2019 & 2032
- Table 52: Global Risk-Based Monitoring Software Industry Volume Million Forecast, by Country 2019 & 2032
- Table 53: China Risk-Based Monitoring Software Industry Revenue (Million) Forecast, by Application 2019 & 2032
- Table 54: China Risk-Based Monitoring Software Industry Volume (Million) Forecast, by Application 2019 & 2032
- Table 55: Japan Risk-Based Monitoring Software Industry Revenue (Million) Forecast, by Application 2019 & 2032
- Table 56: Japan Risk-Based Monitoring Software Industry Volume (Million) Forecast, by Application 2019 & 2032
- Table 57: India Risk-Based Monitoring Software Industry Revenue (Million) Forecast, by Application 2019 & 2032
- Table 58: India Risk-Based Monitoring Software Industry Volume (Million) Forecast, by Application 2019 & 2032
- Table 59: Australia Risk-Based Monitoring Software Industry Revenue (Million) Forecast, by Application 2019 & 2032
- Table 60: Australia Risk-Based Monitoring Software Industry Volume (Million) Forecast, by Application 2019 & 2032
- Table 61: South Korea Risk-Based Monitoring Software Industry Revenue (Million) Forecast, by Application 2019 & 2032
- Table 62: South Korea Risk-Based Monitoring Software Industry Volume (Million) Forecast, by Application 2019 & 2032
- Table 63: Rest of Asia Pacific Risk-Based Monitoring Software Industry Revenue (Million) Forecast, by Application 2019 & 2032
- Table 64: Rest of Asia Pacific Risk-Based Monitoring Software Industry Volume (Million) Forecast, by Application 2019 & 2032
- Table 65: Global Risk-Based Monitoring Software Industry Revenue Million Forecast, by Component 2019 & 2032
- Table 66: Global Risk-Based Monitoring Software Industry Volume Million Forecast, by Component 2019 & 2032
- Table 67: Global Risk-Based Monitoring Software Industry Revenue Million Forecast, by Delivery Mode 2019 & 2032
- Table 68: Global Risk-Based Monitoring Software Industry Volume Million Forecast, by Delivery Mode 2019 & 2032
- Table 69: Global Risk-Based Monitoring Software Industry Revenue Million Forecast, by End User 2019 & 2032
- Table 70: Global Risk-Based Monitoring Software Industry Volume Million Forecast, by End User 2019 & 2032
- Table 71: Global Risk-Based Monitoring Software Industry Revenue Million Forecast, by Country 2019 & 2032
- Table 72: Global Risk-Based Monitoring Software Industry Volume Million Forecast, by Country 2019 & 2032
Frequently Asked Questions
1. What is the projected Compound Annual Growth Rate (CAGR) of the Risk-Based Monitoring Software Industry?
The projected CAGR is approximately 11.30%.
2. Which companies are prominent players in the Risk-Based Monitoring Software Industry?
Key companies in the market include Medidata Solutions Inc, Parexel International Corporation, IBM Corporation, Veeva Systems, DSG Inc, MedNet Solutions Inc, Signant Health, OpenClinica LLC, Oracle, Anju Software*List Not Exhaustive.
3. What are the main segments of the Risk-Based Monitoring Software Industry?
The market segments include Component, Delivery Mode, End User.
4. Can you provide details about the market size?
The market size is estimated to be USD 342 Million as of 2022.
5. What are some drivers contributing to market growth?
High Efficiency of Risk-Based Monitoring Software Coupled with Growing Government Funding and Support for Clinical Trials; Advancements in Technology.
6. What are the notable trends driving market growth?
The Service Segment is Expected to Hold a Significant Share in the Market During the Forecast Period.
7. Are there any restraints impacting market growth?
High Efficiency of Risk-Based Monitoring Software Coupled with Growing Government Funding and Support for Clinical Trials; Advancements in Technology.
8. Can you provide examples of recent developments in the market?
June 2024: Medidata unveiled its offering, the Medidata Clinical Data Studio. This innovative platform is designed to empower stakeholders, granting them enhanced control over data quality and, in turn, expediting the delivery of safer trials to patients. This Medidata Clinical Data Studio supports the principles of risk-based monitoring (RBM) by enhancing data quality control and accelerating trial timelines.
9. What pricing options are available for accessing the report?
Pricing options include single-user, multi-user, and enterprise licenses priced at USD 4750, USD 5250, and USD 8750 respectively.
10. Is the market size provided in terms of value or volume?
The market size is provided in terms of value, measured in Million and volume, measured in Million.
11. Are there any specific market keywords associated with the report?
Yes, the market keyword associated with the report is "Risk-Based Monitoring Software Industry," which aids in identifying and referencing the specific market segment covered.
12. How do I determine which pricing option suits my needs best?
The pricing options vary based on user requirements and access needs. Individual users may opt for single-user licenses, while businesses requiring broader access may choose multi-user or enterprise licenses for cost-effective access to the report.
13. Are there any additional resources or data provided in the Risk-Based Monitoring Software Industry report?
While the report offers comprehensive insights, it's advisable to review the specific contents or supplementary materials provided to ascertain if additional resources or data are available.
14. How can I stay updated on further developments or reports in the Risk-Based Monitoring Software Industry?
To stay informed about further developments, trends, and reports in the Risk-Based Monitoring Software Industry, consider subscribing to industry newsletters, following relevant companies and organizations, or regularly checking reputable industry news sources and publications.
Methodology
Step 1 - Identification of Relevant Samples Size from Population Database


Step 2 - Approaches for Defining Global Market Size (Value, Volume* & Price*)

Note*: In applicable scenarios
Step 3 - Data Sources
Primary Research
- Web Analytics
- Survey Reports
- Research Institute
- Latest Research Reports
- Opinion Leaders
Secondary Research
- Annual Reports
- White Paper
- Latest Press Release
- Industry Association
- Paid Database
- Investor Presentations

Step 4 - Data Triangulation
Involves using different sources of information in order to increase the validity of a study
These sources are likely to be stakeholders in a program - participants, other researchers, program staff, other community members, and so on.
Then we put all data in single framework & apply various statistical tools to find out the dynamic on the market.
During the analysis stage, feedback from the stakeholder groups would be compared to determine areas of agreement as well as areas of divergence
