

Key Insights
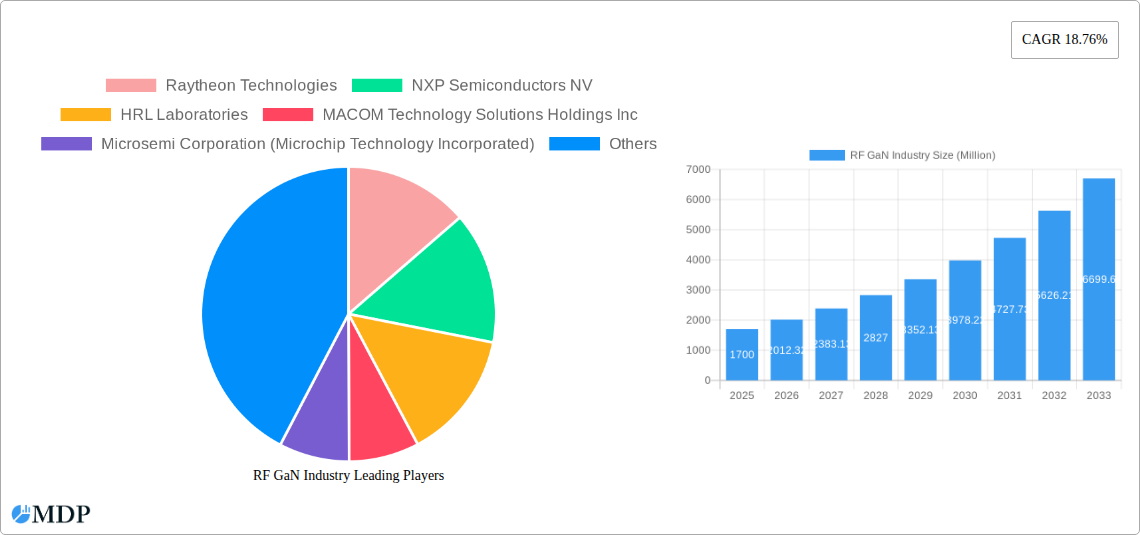
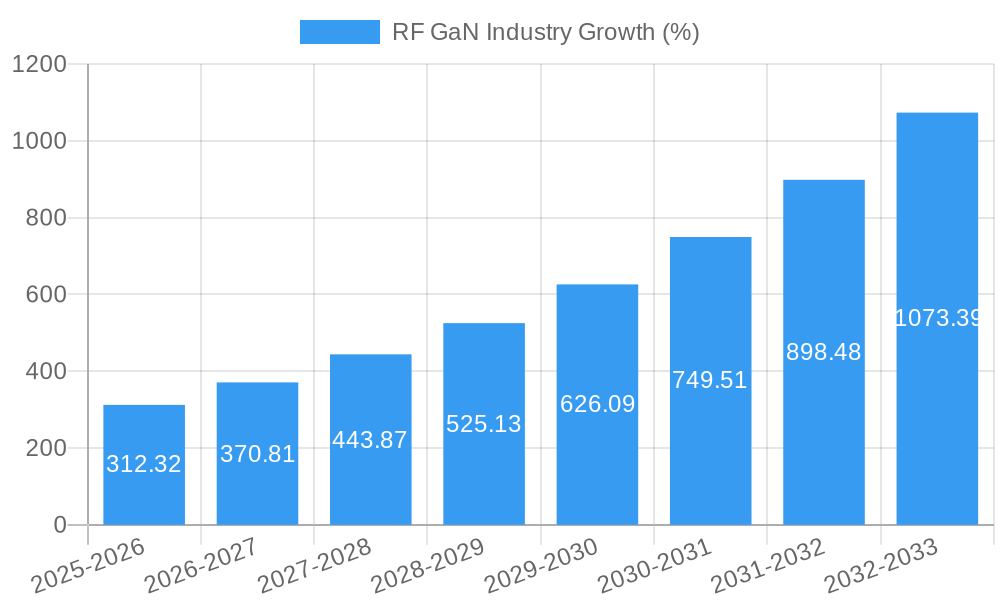
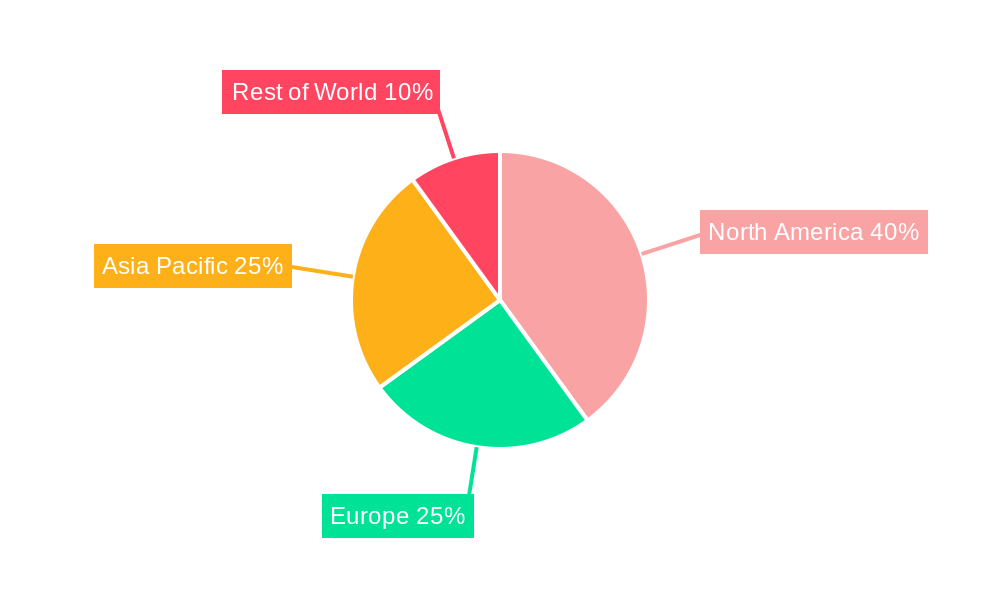
The RF GaN (Gallium Nitride) market is experiencing robust growth, driven by the increasing demand for higher power and efficiency in various applications. The market, valued at $1.70 billion in 2025, is projected to witness a Compound Annual Growth Rate (CAGR) of 18.76% from 2025 to 2033. This significant expansion is fueled by several key factors. The proliferation of 5G networks, demanding high-frequency and high-power amplifiers, is a major catalyst. Furthermore, the growing adoption of GaN technology in defense and aerospace applications, particularly radar systems and avionics, contributes significantly to market growth. The transition towards more energy-efficient solutions in commercial sectors like satellite communication and wired broadband also plays a crucial role. Segment-wise, the military and telecom infrastructure segments (including backhaul, RRH, Massive MIMO, and small cells) are currently the largest revenue generators, but the expansion of GaN applications into other segments like RF energy and commercial radar suggests a diversification of market revenue streams in the coming years. The adoption of different material types, particularly GaN-on-Si and GaN-on-SiC, is influencing market dynamics, with GaN-on-Si currently dominating due to its cost-effectiveness, although GaN-on-SiC is expected to gain traction due to its superior performance characteristics. Geographical distribution of market share is likely to be concentrated in North America and Asia Pacific initially, with Europe and other regions following a growth trajectory.
Several factors could influence the market trajectory. Technological advancements leading to improved GaN device performance and reduced manufacturing costs will continue to be key drivers. The increasing competition among leading players like Raytheon Technologies, NXP Semiconductors, and Wolfspeed will likely intensify, driving innovation and potentially impacting pricing. However, challenges remain, including the relatively high cost of GaN devices compared to traditional technologies and potential supply chain disruptions. Nevertheless, the long-term outlook remains positive, underpinned by the growing demand for higher performance and energy efficiency in various applications across diverse sectors. The market is poised for substantial expansion throughout the forecast period (2025-2033).
RF GaN Industry Market Report: 2019-2033 Forecast
This comprehensive report provides an in-depth analysis of the RF GaN industry, projecting robust growth from 2025 to 2033. The study covers market dynamics, leading players, technological advancements, and key market segments, providing valuable insights for stakeholders and investors. With a detailed examination of the historical period (2019-2024), base year (2025), and forecast period (2025-2033), this report offers actionable intelligence to navigate the complexities of this rapidly evolving market. The total market size is projected to reach xx Million by 2033.
RF GaN Industry Market Dynamics & Concentration
The RF GaN market is characterized by a dynamic interplay of factors influencing its concentration and growth trajectory. Market concentration is currently moderate, with several key players holding significant market share, though the exact figures vary by segment. Innovation is a crucial driver, with ongoing research and development leading to improvements in power efficiency, operating frequency, and thermal management of GaN devices. Stringent regulatory frameworks, particularly concerning electromagnetic interference (EMI) and safety standards, impact product design and market access. Product substitutes, such as LDMOS transistors, continue to compete, especially in cost-sensitive applications. However, GaN's superior performance characteristics are driving its adoption. End-user trends show a growing preference for higher power density, improved efficiency, and miniaturized solutions, directly benefitting GaN adoption. Furthermore, M&A activity is prevalent, with a total of xx M&A deals recorded in the last 5 years, reflecting consolidation within the industry and strategic acquisitions of promising technologies. The average market share of the top 5 players is approximately xx%.
RF GaN Industry Industry Trends & Analysis
The RF GaN industry exhibits a strong upward growth trajectory, fueled by several key trends. The market is experiencing a Compound Annual Growth Rate (CAGR) of xx% during the forecast period (2025-2033), driven by escalating demand across diverse applications. Technological disruptions, primarily stemming from advancements in GaN material synthesis and device fabrication, are continuously improving performance metrics and reducing costs. Consumer preference for high-performance, energy-efficient electronics significantly fuels market demand. Intense competitive dynamics exist among established players and emerging companies, leading to innovation and aggressive pricing strategies. Market penetration of GaN devices is steadily increasing, particularly in high-frequency applications where their performance advantages are most pronounced. This increase is fueled by the market’s shift away from traditional technologies due to the inherent superior performance of GaN. The projected market size in 2033 is expected to reach xx Million.
Leading Markets & Segments in RF GaN Industry
The RF GaN market is geographically diverse, with the North American region currently dominating due to strong military and aerospace spending, as well as robust innovation hubs. This dominance is reinforced by significant investments in 5G infrastructure and commercial applications. Asia Pacific is projected to experience the fastest growth rate during the forecast period, driven by the burgeoning telecom and consumer electronics industries.
- By Application: The Telecom Infrastructure segment, especially 5G related applications (Backhaul, RRH, Massive MIMO, Small Cells), holds the largest market share, owing to the high demand for high-power, energy-efficient amplifiers. The Military segment maintains a strong presence, benefiting from significant government spending on defense technologies. The Commercial Radar and Avionics segment is also witnessing considerable growth.
- By Material Type: GaN-on-Si dominates the current market due to its cost-effectiveness and established manufacturing processes. GaN-on-SiC is gradually gaining traction, driven by its enhanced performance characteristics, while Other Material Types are still niche markets with significant long-term potential.
Key drivers for regional growth include favorable government policies, robust infrastructure investments, and strong technological innovation ecosystems.
RF GaN Industry Product Developments
Recent product innovations focus on increasing power output, enhancing efficiency, and improving operating frequency ranges. New GaN devices are being designed for specific applications, such as high-power amplifiers for 5G base stations and highly integrated solutions for aerospace and defense systems. Competitive advantages are increasingly derived from technological breakthroughs in material science and device fabrication, leading to superior performance, smaller form factors, and reduced costs.
Key Drivers of RF GaN Industry Growth
The RF GaN industry's growth is propelled by several key factors. Technological advancements continuously improve GaN device performance and reduce costs, leading to wider adoption. The increasing demand for higher-power, energy-efficient RF solutions across various applications is a major driver. Government funding and support for research and development in GaN technology are further fueling growth. Stringent regulations pushing towards more energy-efficient technologies contribute positively to the industry growth.
Challenges in the RF GaN Industry Market
The RF GaN industry faces several challenges, including the high cost of GaN devices compared to alternative technologies. Supply chain disruptions can impact production and delivery times, causing potential delays and increased costs. Intense competition among established players and new entrants creates pressure on pricing and profitability. Regulatory hurdles and certification processes can also hinder market penetration.
Emerging Opportunities in RF GaN Industry
Significant opportunities exist in expanding GaN technology into new applications, such as electric vehicles, renewable energy systems, and industrial automation. Strategic partnerships and collaborations are enhancing technological advancements and market access. The ongoing development of advanced GaN materials and fabrication techniques unlocks even higher performance and lower costs.
Leading Players in the RF GaN Industry Sector
- Raytheon Technologies
- NXP Semiconductors NV
- HRL Laboratories
- MACOM Technology Solutions Holdings Inc
- Microsemi Corporation (Microchip Technology Incorporated)
- Wolfspeed Inc (Cree Inc )
- Integra Technologies Inc
- Mitsubishi Electric Corporation
- STMicroelectronics NV
- Aethercomm Inc
- Mercury Systems Inc
- Qorvo Inc
- Analog Devices Inc
- Sumitomo Electric Device Innovations Inc
Key Milestones in RF GaN Industry Industry
- September 2022: MaxLinear Inc. and RFHIC announced a collaboration to deliver a production-ready 400MHz Power Amplifier solution for 5G Macrocell radios, significantly improving efficiency and performance.
- June 2022: Integra announced seven new 100 V RF GaN devices with power levels up to 5 kW, expanding its product portfolio for high-power applications.
Strategic Outlook for RF GaN Industry Market
The RF GaN market is poised for significant long-term growth. Continuous technological advancements, coupled with increasing demand across diverse applications, will drive market expansion. Strategic partnerships and collaborations will play a critical role in accelerating innovation and market penetration. The focus on developing cost-effective and high-performance GaN solutions will be essential for maintaining a strong competitive edge.
RF GaN Industry Segmentation
-
1. Application
- 1.1. Military
- 1.2. Telecom
- 1.3. Satellite Communication
- 1.4. Wired Broadband
- 1.5. Commercial Radar and Avionics
- 1.6. RF Energy
-
2. Material Type
- 2.1. GaN-on-Si
- 2.2. GaN-on-SiC
- 2.3. Other Material Types (GaN-on-GaN, GaN-on-Diamond)
RF GaN Industry Segmentation By Geography
- 1. North America
- 2. Europe
- 3. Asia Pacific
- 4. Middle East and Africa
RF GaN Industry REPORT HIGHLIGHTS
| Aspects | Details |
|---|---|
| Study Period | 2019-2033 |
| Base Year | 2024 |
| Estimated Year | 2025 |
| Forecast Period | 2025-2033 |
| Historical Period | 2019-2024 |
| Growth Rate | CAGR of 18.76% from 2019-2033 |
| Segmentation |
|
Table of Contents
- 1. Introduction
- 1.1. Research Scope
- 1.2. Market Segmentation
- 1.3. Research Methodology
- 1.4. Definitions and Assumptions
- 2. Executive Summary
- 2.1. Introduction
- 3. Market Dynamics
- 3.1. Introduction
- 3.2. Market Drivers
- 3.2.1. Strong Demand from Telecom Infrastructure Segment Driven by Advancements in 5G Implementation; Favorable Attributes Such As High-performance and Small Form Factor to
- 3.3. Market Restrains
- 3.3.1. Cost & Operational Challenges
- 3.4. Market Trends
- 3.4.1. Strong Demand from Telecom Infrastructure Segment Driven by Advancements in 5G Implementation
- 4. Market Factor Analysis
- 4.1. Porters Five Forces
- 4.2. Supply/Value Chain
- 4.3. PESTEL analysis
- 4.4. Market Entropy
- 4.5. Patent/Trademark Analysis
- 5. Global RF GaN Industry Analysis, Insights and Forecast, 2019-2031
- 5.1. Market Analysis, Insights and Forecast - by Application
- 5.1.1. Military
- 5.1.2. Telecom
- 5.1.3. Satellite Communication
- 5.1.4. Wired Broadband
- 5.1.5. Commercial Radar and Avionics
- 5.1.6. RF Energy
- 5.2. Market Analysis, Insights and Forecast - by Material Type
- 5.2.1. GaN-on-Si
- 5.2.2. GaN-on-SiC
- 5.2.3. Other Material Types (GaN-on-GaN, GaN-on-Diamond)
- 5.3. Market Analysis, Insights and Forecast - by Region
- 5.3.1. North America
- 5.3.2. Europe
- 5.3.3. Asia Pacific
- 5.3.4. Middle East and Africa
- 5.1. Market Analysis, Insights and Forecast - by Application
- 6. North America RF GaN Industry Analysis, Insights and Forecast, 2019-2031
- 6.1. Market Analysis, Insights and Forecast - by Application
- 6.1.1. Military
- 6.1.2. Telecom
- 6.1.3. Satellite Communication
- 6.1.4. Wired Broadband
- 6.1.5. Commercial Radar and Avionics
- 6.1.6. RF Energy
- 6.2. Market Analysis, Insights and Forecast - by Material Type
- 6.2.1. GaN-on-Si
- 6.2.2. GaN-on-SiC
- 6.2.3. Other Material Types (GaN-on-GaN, GaN-on-Diamond)
- 6.1. Market Analysis, Insights and Forecast - by Application
- 7. Europe RF GaN Industry Analysis, Insights and Forecast, 2019-2031
- 7.1. Market Analysis, Insights and Forecast - by Application
- 7.1.1. Military
- 7.1.2. Telecom
- 7.1.3. Satellite Communication
- 7.1.4. Wired Broadband
- 7.1.5. Commercial Radar and Avionics
- 7.1.6. RF Energy
- 7.2. Market Analysis, Insights and Forecast - by Material Type
- 7.2.1. GaN-on-Si
- 7.2.2. GaN-on-SiC
- 7.2.3. Other Material Types (GaN-on-GaN, GaN-on-Diamond)
- 7.1. Market Analysis, Insights and Forecast - by Application
- 8. Asia Pacific RF GaN Industry Analysis, Insights and Forecast, 2019-2031
- 8.1. Market Analysis, Insights and Forecast - by Application
- 8.1.1. Military
- 8.1.2. Telecom
- 8.1.3. Satellite Communication
- 8.1.4. Wired Broadband
- 8.1.5. Commercial Radar and Avionics
- 8.1.6. RF Energy
- 8.2. Market Analysis, Insights and Forecast - by Material Type
- 8.2.1. GaN-on-Si
- 8.2.2. GaN-on-SiC
- 8.2.3. Other Material Types (GaN-on-GaN, GaN-on-Diamond)
- 8.1. Market Analysis, Insights and Forecast - by Application
- 9. Middle East and Africa RF GaN Industry Analysis, Insights and Forecast, 2019-2031
- 9.1. Market Analysis, Insights and Forecast - by Application
- 9.1.1. Military
- 9.1.2. Telecom
- 9.1.3. Satellite Communication
- 9.1.4. Wired Broadband
- 9.1.5. Commercial Radar and Avionics
- 9.1.6. RF Energy
- 9.2. Market Analysis, Insights and Forecast - by Material Type
- 9.2.1. GaN-on-Si
- 9.2.2. GaN-on-SiC
- 9.2.3. Other Material Types (GaN-on-GaN, GaN-on-Diamond)
- 9.1. Market Analysis, Insights and Forecast - by Application
- 10. North America RF GaN Industry Analysis, Insights and Forecast, 2019-2031
- 10.1. Market Analysis, Insights and Forecast - By Country/Sub-region
- 10.1.1 United States
- 10.1.2 Canada
- 10.1.3 Mexico
- 11. Europe RF GaN Industry Analysis, Insights and Forecast, 2019-2031
- 11.1. Market Analysis, Insights and Forecast - By Country/Sub-region
- 11.1.1 Germany
- 11.1.2 United Kingdom
- 11.1.3 France
- 11.1.4 Spain
- 11.1.5 Italy
- 11.1.6 Spain
- 11.1.7 Belgium
- 11.1.8 Netherland
- 11.1.9 Nordics
- 11.1.10 Rest of Europe
- 12. Asia Pacific RF GaN Industry Analysis, Insights and Forecast, 2019-2031
- 12.1. Market Analysis, Insights and Forecast - By Country/Sub-region
- 12.1.1 China
- 12.1.2 Japan
- 12.1.3 India
- 12.1.4 South Korea
- 12.1.5 Southeast Asia
- 12.1.6 Australia
- 12.1.7 Indonesia
- 12.1.8 Phillipes
- 12.1.9 Singapore
- 12.1.10 Thailandc
- 12.1.11 Rest of Asia Pacific
- 13. South America RF GaN Industry Analysis, Insights and Forecast, 2019-2031
- 13.1. Market Analysis, Insights and Forecast - By Country/Sub-region
- 13.1.1 Brazil
- 13.1.2 Argentina
- 13.1.3 Peru
- 13.1.4 Chile
- 13.1.5 Colombia
- 13.1.6 Ecuador
- 13.1.7 Venezuela
- 13.1.8 Rest of South America
- 14. North America RF GaN Industry Analysis, Insights and Forecast, 2019-2031
- 14.1. Market Analysis, Insights and Forecast - By Country/Sub-region
- 14.1.1 United States
- 14.1.2 Canada
- 14.1.3 Mexico
- 15. MEA RF GaN Industry Analysis, Insights and Forecast, 2019-2031
- 15.1. Market Analysis, Insights and Forecast - By Country/Sub-region
- 15.1.1 United Arab Emirates
- 15.1.2 Saudi Arabia
- 15.1.3 South Africa
- 15.1.4 Rest of Middle East and Africa
- 16. Competitive Analysis
- 16.1. Global Market Share Analysis 2024
- 16.2. Company Profiles
- 16.2.1 Raytheon Technologies
- 16.2.1.1. Overview
- 16.2.1.2. Products
- 16.2.1.3. SWOT Analysis
- 16.2.1.4. Recent Developments
- 16.2.1.5. Financials (Based on Availability)
- 16.2.2 NXP Semiconductors NV
- 16.2.2.1. Overview
- 16.2.2.2. Products
- 16.2.2.3. SWOT Analysis
- 16.2.2.4. Recent Developments
- 16.2.2.5. Financials (Based on Availability)
- 16.2.3 HRL Laboratories
- 16.2.3.1. Overview
- 16.2.3.2. Products
- 16.2.3.3. SWOT Analysis
- 16.2.3.4. Recent Developments
- 16.2.3.5. Financials (Based on Availability)
- 16.2.4 MACOM Technology Solutions Holdings Inc
- 16.2.4.1. Overview
- 16.2.4.2. Products
- 16.2.4.3. SWOT Analysis
- 16.2.4.4. Recent Developments
- 16.2.4.5. Financials (Based on Availability)
- 16.2.5 Microsemi Corporation (Microchip Technology Incorporated)
- 16.2.5.1. Overview
- 16.2.5.2. Products
- 16.2.5.3. SWOT Analysis
- 16.2.5.4. Recent Developments
- 16.2.5.5. Financials (Based on Availability)
- 16.2.6 Wolfspeed Inc (Cree Inc )
- 16.2.6.1. Overview
- 16.2.6.2. Products
- 16.2.6.3. SWOT Analysis
- 16.2.6.4. Recent Developments
- 16.2.6.5. Financials (Based on Availability)
- 16.2.7 Integra Technologies Inc
- 16.2.7.1. Overview
- 16.2.7.2. Products
- 16.2.7.3. SWOT Analysis
- 16.2.7.4. Recent Developments
- 16.2.7.5. Financials (Based on Availability)
- 16.2.8 Mitsubishi Electric Corporation
- 16.2.8.1. Overview
- 16.2.8.2. Products
- 16.2.8.3. SWOT Analysis
- 16.2.8.4. Recent Developments
- 16.2.8.5. Financials (Based on Availability)
- 16.2.9 STMicroelectronics NV
- 16.2.9.1. Overview
- 16.2.9.2. Products
- 16.2.9.3. SWOT Analysis
- 16.2.9.4. Recent Developments
- 16.2.9.5. Financials (Based on Availability)
- 16.2.10 Aethercomm Inc
- 16.2.10.1. Overview
- 16.2.10.2. Products
- 16.2.10.3. SWOT Analysis
- 16.2.10.4. Recent Developments
- 16.2.10.5. Financials (Based on Availability)
- 16.2.11 Mercury Systems Inc
- 16.2.11.1. Overview
- 16.2.11.2. Products
- 16.2.11.3. SWOT Analysis
- 16.2.11.4. Recent Developments
- 16.2.11.5. Financials (Based on Availability)
- 16.2.12 Qorvo Inc
- 16.2.12.1. Overview
- 16.2.12.2. Products
- 16.2.12.3. SWOT Analysis
- 16.2.12.4. Recent Developments
- 16.2.12.5. Financials (Based on Availability)
- 16.2.13 Analog Devices Inc
- 16.2.13.1. Overview
- 16.2.13.2. Products
- 16.2.13.3. SWOT Analysis
- 16.2.13.4. Recent Developments
- 16.2.13.5. Financials (Based on Availability)
- 16.2.14 Sumitomo Electric Device Innovations Inc
- 16.2.14.1. Overview
- 16.2.14.2. Products
- 16.2.14.3. SWOT Analysis
- 16.2.14.4. Recent Developments
- 16.2.14.5. Financials (Based on Availability)
- 16.2.1 Raytheon Technologies
List of Figures
- Figure 1: Global RF GaN Industry Revenue Breakdown (Million, %) by Region 2024 & 2032
- Figure 2: Global RF GaN Industry Volume Breakdown (K Unit, %) by Region 2024 & 2032
- Figure 3: North America RF GaN Industry Revenue (Million), by Country 2024 & 2032
- Figure 4: North America RF GaN Industry Volume (K Unit), by Country 2024 & 2032
- Figure 5: North America RF GaN Industry Revenue Share (%), by Country 2024 & 2032
- Figure 6: North America RF GaN Industry Volume Share (%), by Country 2024 & 2032
- Figure 7: Europe RF GaN Industry Revenue (Million), by Country 2024 & 2032
- Figure 8: Europe RF GaN Industry Volume (K Unit), by Country 2024 & 2032
- Figure 9: Europe RF GaN Industry Revenue Share (%), by Country 2024 & 2032
- Figure 10: Europe RF GaN Industry Volume Share (%), by Country 2024 & 2032
- Figure 11: Asia Pacific RF GaN Industry Revenue (Million), by Country 2024 & 2032
- Figure 12: Asia Pacific RF GaN Industry Volume (K Unit), by Country 2024 & 2032
- Figure 13: Asia Pacific RF GaN Industry Revenue Share (%), by Country 2024 & 2032
- Figure 14: Asia Pacific RF GaN Industry Volume Share (%), by Country 2024 & 2032
- Figure 15: South America RF GaN Industry Revenue (Million), by Country 2024 & 2032
- Figure 16: South America RF GaN Industry Volume (K Unit), by Country 2024 & 2032
- Figure 17: South America RF GaN Industry Revenue Share (%), by Country 2024 & 2032
- Figure 18: South America RF GaN Industry Volume Share (%), by Country 2024 & 2032
- Figure 19: North America RF GaN Industry Revenue (Million), by Country 2024 & 2032
- Figure 20: North America RF GaN Industry Volume (K Unit), by Country 2024 & 2032
- Figure 21: North America RF GaN Industry Revenue Share (%), by Country 2024 & 2032
- Figure 22: North America RF GaN Industry Volume Share (%), by Country 2024 & 2032
- Figure 23: MEA RF GaN Industry Revenue (Million), by Country 2024 & 2032
- Figure 24: MEA RF GaN Industry Volume (K Unit), by Country 2024 & 2032
- Figure 25: MEA RF GaN Industry Revenue Share (%), by Country 2024 & 2032
- Figure 26: MEA RF GaN Industry Volume Share (%), by Country 2024 & 2032
- Figure 27: North America RF GaN Industry Revenue (Million), by Application 2024 & 2032
- Figure 28: North America RF GaN Industry Volume (K Unit), by Application 2024 & 2032
- Figure 29: North America RF GaN Industry Revenue Share (%), by Application 2024 & 2032
- Figure 30: North America RF GaN Industry Volume Share (%), by Application 2024 & 2032
- Figure 31: North America RF GaN Industry Revenue (Million), by Material Type 2024 & 2032
- Figure 32: North America RF GaN Industry Volume (K Unit), by Material Type 2024 & 2032
- Figure 33: North America RF GaN Industry Revenue Share (%), by Material Type 2024 & 2032
- Figure 34: North America RF GaN Industry Volume Share (%), by Material Type 2024 & 2032
- Figure 35: North America RF GaN Industry Revenue (Million), by Country 2024 & 2032
- Figure 36: North America RF GaN Industry Volume (K Unit), by Country 2024 & 2032
- Figure 37: North America RF GaN Industry Revenue Share (%), by Country 2024 & 2032
- Figure 38: North America RF GaN Industry Volume Share (%), by Country 2024 & 2032
- Figure 39: Europe RF GaN Industry Revenue (Million), by Application 2024 & 2032
- Figure 40: Europe RF GaN Industry Volume (K Unit), by Application 2024 & 2032
- Figure 41: Europe RF GaN Industry Revenue Share (%), by Application 2024 & 2032
- Figure 42: Europe RF GaN Industry Volume Share (%), by Application 2024 & 2032
- Figure 43: Europe RF GaN Industry Revenue (Million), by Material Type 2024 & 2032
- Figure 44: Europe RF GaN Industry Volume (K Unit), by Material Type 2024 & 2032
- Figure 45: Europe RF GaN Industry Revenue Share (%), by Material Type 2024 & 2032
- Figure 46: Europe RF GaN Industry Volume Share (%), by Material Type 2024 & 2032
- Figure 47: Europe RF GaN Industry Revenue (Million), by Country 2024 & 2032
- Figure 48: Europe RF GaN Industry Volume (K Unit), by Country 2024 & 2032
- Figure 49: Europe RF GaN Industry Revenue Share (%), by Country 2024 & 2032
- Figure 50: Europe RF GaN Industry Volume Share (%), by Country 2024 & 2032
- Figure 51: Asia Pacific RF GaN Industry Revenue (Million), by Application 2024 & 2032
- Figure 52: Asia Pacific RF GaN Industry Volume (K Unit), by Application 2024 & 2032
- Figure 53: Asia Pacific RF GaN Industry Revenue Share (%), by Application 2024 & 2032
- Figure 54: Asia Pacific RF GaN Industry Volume Share (%), by Application 2024 & 2032
- Figure 55: Asia Pacific RF GaN Industry Revenue (Million), by Material Type 2024 & 2032
- Figure 56: Asia Pacific RF GaN Industry Volume (K Unit), by Material Type 2024 & 2032
- Figure 57: Asia Pacific RF GaN Industry Revenue Share (%), by Material Type 2024 & 2032
- Figure 58: Asia Pacific RF GaN Industry Volume Share (%), by Material Type 2024 & 2032
- Figure 59: Asia Pacific RF GaN Industry Revenue (Million), by Country 2024 & 2032
- Figure 60: Asia Pacific RF GaN Industry Volume (K Unit), by Country 2024 & 2032
- Figure 61: Asia Pacific RF GaN Industry Revenue Share (%), by Country 2024 & 2032
- Figure 62: Asia Pacific RF GaN Industry Volume Share (%), by Country 2024 & 2032
- Figure 63: Middle East and Africa RF GaN Industry Revenue (Million), by Application 2024 & 2032
- Figure 64: Middle East and Africa RF GaN Industry Volume (K Unit), by Application 2024 & 2032
- Figure 65: Middle East and Africa RF GaN Industry Revenue Share (%), by Application 2024 & 2032
- Figure 66: Middle East and Africa RF GaN Industry Volume Share (%), by Application 2024 & 2032
- Figure 67: Middle East and Africa RF GaN Industry Revenue (Million), by Material Type 2024 & 2032
- Figure 68: Middle East and Africa RF GaN Industry Volume (K Unit), by Material Type 2024 & 2032
- Figure 69: Middle East and Africa RF GaN Industry Revenue Share (%), by Material Type 2024 & 2032
- Figure 70: Middle East and Africa RF GaN Industry Volume Share (%), by Material Type 2024 & 2032
- Figure 71: Middle East and Africa RF GaN Industry Revenue (Million), by Country 2024 & 2032
- Figure 72: Middle East and Africa RF GaN Industry Volume (K Unit), by Country 2024 & 2032
- Figure 73: Middle East and Africa RF GaN Industry Revenue Share (%), by Country 2024 & 2032
- Figure 74: Middle East and Africa RF GaN Industry Volume Share (%), by Country 2024 & 2032
List of Tables
- Table 1: Global RF GaN Industry Revenue Million Forecast, by Region 2019 & 2032
- Table 2: Global RF GaN Industry Volume K Unit Forecast, by Region 2019 & 2032
- Table 3: Global RF GaN Industry Revenue Million Forecast, by Application 2019 & 2032
- Table 4: Global RF GaN Industry Volume K Unit Forecast, by Application 2019 & 2032
- Table 5: Global RF GaN Industry Revenue Million Forecast, by Material Type 2019 & 2032
- Table 6: Global RF GaN Industry Volume K Unit Forecast, by Material Type 2019 & 2032
- Table 7: Global RF GaN Industry Revenue Million Forecast, by Region 2019 & 2032
- Table 8: Global RF GaN Industry Volume K Unit Forecast, by Region 2019 & 2032
- Table 9: Global RF GaN Industry Revenue Million Forecast, by Country 2019 & 2032
- Table 10: Global RF GaN Industry Volume K Unit Forecast, by Country 2019 & 2032
- Table 11: United States RF GaN Industry Revenue (Million) Forecast, by Application 2019 & 2032
- Table 12: United States RF GaN Industry Volume (K Unit) Forecast, by Application 2019 & 2032
- Table 13: Canada RF GaN Industry Revenue (Million) Forecast, by Application 2019 & 2032
- Table 14: Canada RF GaN Industry Volume (K Unit) Forecast, by Application 2019 & 2032
- Table 15: Mexico RF GaN Industry Revenue (Million) Forecast, by Application 2019 & 2032
- Table 16: Mexico RF GaN Industry Volume (K Unit) Forecast, by Application 2019 & 2032
- Table 17: Global RF GaN Industry Revenue Million Forecast, by Country 2019 & 2032
- Table 18: Global RF GaN Industry Volume K Unit Forecast, by Country 2019 & 2032
- Table 19: Germany RF GaN Industry Revenue (Million) Forecast, by Application 2019 & 2032
- Table 20: Germany RF GaN Industry Volume (K Unit) Forecast, by Application 2019 & 2032
- Table 21: United Kingdom RF GaN Industry Revenue (Million) Forecast, by Application 2019 & 2032
- Table 22: United Kingdom RF GaN Industry Volume (K Unit) Forecast, by Application 2019 & 2032
- Table 23: France RF GaN Industry Revenue (Million) Forecast, by Application 2019 & 2032
- Table 24: France RF GaN Industry Volume (K Unit) Forecast, by Application 2019 & 2032
- Table 25: Spain RF GaN Industry Revenue (Million) Forecast, by Application 2019 & 2032
- Table 26: Spain RF GaN Industry Volume (K Unit) Forecast, by Application 2019 & 2032
- Table 27: Italy RF GaN Industry Revenue (Million) Forecast, by Application 2019 & 2032
- Table 28: Italy RF GaN Industry Volume (K Unit) Forecast, by Application 2019 & 2032
- Table 29: Spain RF GaN Industry Revenue (Million) Forecast, by Application 2019 & 2032
- Table 30: Spain RF GaN Industry Volume (K Unit) Forecast, by Application 2019 & 2032
- Table 31: Belgium RF GaN Industry Revenue (Million) Forecast, by Application 2019 & 2032
- Table 32: Belgium RF GaN Industry Volume (K Unit) Forecast, by Application 2019 & 2032
- Table 33: Netherland RF GaN Industry Revenue (Million) Forecast, by Application 2019 & 2032
- Table 34: Netherland RF GaN Industry Volume (K Unit) Forecast, by Application 2019 & 2032
- Table 35: Nordics RF GaN Industry Revenue (Million) Forecast, by Application 2019 & 2032
- Table 36: Nordics RF GaN Industry Volume (K Unit) Forecast, by Application 2019 & 2032
- Table 37: Rest of Europe RF GaN Industry Revenue (Million) Forecast, by Application 2019 & 2032
- Table 38: Rest of Europe RF GaN Industry Volume (K Unit) Forecast, by Application 2019 & 2032
- Table 39: Global RF GaN Industry Revenue Million Forecast, by Country 2019 & 2032
- Table 40: Global RF GaN Industry Volume K Unit Forecast, by Country 2019 & 2032
- Table 41: China RF GaN Industry Revenue (Million) Forecast, by Application 2019 & 2032
- Table 42: China RF GaN Industry Volume (K Unit) Forecast, by Application 2019 & 2032
- Table 43: Japan RF GaN Industry Revenue (Million) Forecast, by Application 2019 & 2032
- Table 44: Japan RF GaN Industry Volume (K Unit) Forecast, by Application 2019 & 2032
- Table 45: India RF GaN Industry Revenue (Million) Forecast, by Application 2019 & 2032
- Table 46: India RF GaN Industry Volume (K Unit) Forecast, by Application 2019 & 2032
- Table 47: South Korea RF GaN Industry Revenue (Million) Forecast, by Application 2019 & 2032
- Table 48: South Korea RF GaN Industry Volume (K Unit) Forecast, by Application 2019 & 2032
- Table 49: Southeast Asia RF GaN Industry Revenue (Million) Forecast, by Application 2019 & 2032
- Table 50: Southeast Asia RF GaN Industry Volume (K Unit) Forecast, by Application 2019 & 2032
- Table 51: Australia RF GaN Industry Revenue (Million) Forecast, by Application 2019 & 2032
- Table 52: Australia RF GaN Industry Volume (K Unit) Forecast, by Application 2019 & 2032
- Table 53: Indonesia RF GaN Industry Revenue (Million) Forecast, by Application 2019 & 2032
- Table 54: Indonesia RF GaN Industry Volume (K Unit) Forecast, by Application 2019 & 2032
- Table 55: Phillipes RF GaN Industry Revenue (Million) Forecast, by Application 2019 & 2032
- Table 56: Phillipes RF GaN Industry Volume (K Unit) Forecast, by Application 2019 & 2032
- Table 57: Singapore RF GaN Industry Revenue (Million) Forecast, by Application 2019 & 2032
- Table 58: Singapore RF GaN Industry Volume (K Unit) Forecast, by Application 2019 & 2032
- Table 59: Thailandc RF GaN Industry Revenue (Million) Forecast, by Application 2019 & 2032
- Table 60: Thailandc RF GaN Industry Volume (K Unit) Forecast, by Application 2019 & 2032
- Table 61: Rest of Asia Pacific RF GaN Industry Revenue (Million) Forecast, by Application 2019 & 2032
- Table 62: Rest of Asia Pacific RF GaN Industry Volume (K Unit) Forecast, by Application 2019 & 2032
- Table 63: Global RF GaN Industry Revenue Million Forecast, by Country 2019 & 2032
- Table 64: Global RF GaN Industry Volume K Unit Forecast, by Country 2019 & 2032
- Table 65: Brazil RF GaN Industry Revenue (Million) Forecast, by Application 2019 & 2032
- Table 66: Brazil RF GaN Industry Volume (K Unit) Forecast, by Application 2019 & 2032
- Table 67: Argentina RF GaN Industry Revenue (Million) Forecast, by Application 2019 & 2032
- Table 68: Argentina RF GaN Industry Volume (K Unit) Forecast, by Application 2019 & 2032
- Table 69: Peru RF GaN Industry Revenue (Million) Forecast, by Application 2019 & 2032
- Table 70: Peru RF GaN Industry Volume (K Unit) Forecast, by Application 2019 & 2032
- Table 71: Chile RF GaN Industry Revenue (Million) Forecast, by Application 2019 & 2032
- Table 72: Chile RF GaN Industry Volume (K Unit) Forecast, by Application 2019 & 2032
- Table 73: Colombia RF GaN Industry Revenue (Million) Forecast, by Application 2019 & 2032
- Table 74: Colombia RF GaN Industry Volume (K Unit) Forecast, by Application 2019 & 2032
- Table 75: Ecuador RF GaN Industry Revenue (Million) Forecast, by Application 2019 & 2032
- Table 76: Ecuador RF GaN Industry Volume (K Unit) Forecast, by Application 2019 & 2032
- Table 77: Venezuela RF GaN Industry Revenue (Million) Forecast, by Application 2019 & 2032
- Table 78: Venezuela RF GaN Industry Volume (K Unit) Forecast, by Application 2019 & 2032
- Table 79: Rest of South America RF GaN Industry Revenue (Million) Forecast, by Application 2019 & 2032
- Table 80: Rest of South America RF GaN Industry Volume (K Unit) Forecast, by Application 2019 & 2032
- Table 81: Global RF GaN Industry Revenue Million Forecast, by Country 2019 & 2032
- Table 82: Global RF GaN Industry Volume K Unit Forecast, by Country 2019 & 2032
- Table 83: United States RF GaN Industry Revenue (Million) Forecast, by Application 2019 & 2032
- Table 84: United States RF GaN Industry Volume (K Unit) Forecast, by Application 2019 & 2032
- Table 85: Canada RF GaN Industry Revenue (Million) Forecast, by Application 2019 & 2032
- Table 86: Canada RF GaN Industry Volume (K Unit) Forecast, by Application 2019 & 2032
- Table 87: Mexico RF GaN Industry Revenue (Million) Forecast, by Application 2019 & 2032
- Table 88: Mexico RF GaN Industry Volume (K Unit) Forecast, by Application 2019 & 2032
- Table 89: Global RF GaN Industry Revenue Million Forecast, by Country 2019 & 2032
- Table 90: Global RF GaN Industry Volume K Unit Forecast, by Country 2019 & 2032
- Table 91: United Arab Emirates RF GaN Industry Revenue (Million) Forecast, by Application 2019 & 2032
- Table 92: United Arab Emirates RF GaN Industry Volume (K Unit) Forecast, by Application 2019 & 2032
- Table 93: Saudi Arabia RF GaN Industry Revenue (Million) Forecast, by Application 2019 & 2032
- Table 94: Saudi Arabia RF GaN Industry Volume (K Unit) Forecast, by Application 2019 & 2032
- Table 95: South Africa RF GaN Industry Revenue (Million) Forecast, by Application 2019 & 2032
- Table 96: South Africa RF GaN Industry Volume (K Unit) Forecast, by Application 2019 & 2032
- Table 97: Rest of Middle East and Africa RF GaN Industry Revenue (Million) Forecast, by Application 2019 & 2032
- Table 98: Rest of Middle East and Africa RF GaN Industry Volume (K Unit) Forecast, by Application 2019 & 2032
- Table 99: Global RF GaN Industry Revenue Million Forecast, by Application 2019 & 2032
- Table 100: Global RF GaN Industry Volume K Unit Forecast, by Application 2019 & 2032
- Table 101: Global RF GaN Industry Revenue Million Forecast, by Material Type 2019 & 2032
- Table 102: Global RF GaN Industry Volume K Unit Forecast, by Material Type 2019 & 2032
- Table 103: Global RF GaN Industry Revenue Million Forecast, by Country 2019 & 2032
- Table 104: Global RF GaN Industry Volume K Unit Forecast, by Country 2019 & 2032
- Table 105: Global RF GaN Industry Revenue Million Forecast, by Application 2019 & 2032
- Table 106: Global RF GaN Industry Volume K Unit Forecast, by Application 2019 & 2032
- Table 107: Global RF GaN Industry Revenue Million Forecast, by Material Type 2019 & 2032
- Table 108: Global RF GaN Industry Volume K Unit Forecast, by Material Type 2019 & 2032
- Table 109: Global RF GaN Industry Revenue Million Forecast, by Country 2019 & 2032
- Table 110: Global RF GaN Industry Volume K Unit Forecast, by Country 2019 & 2032
- Table 111: Global RF GaN Industry Revenue Million Forecast, by Application 2019 & 2032
- Table 112: Global RF GaN Industry Volume K Unit Forecast, by Application 2019 & 2032
- Table 113: Global RF GaN Industry Revenue Million Forecast, by Material Type 2019 & 2032
- Table 114: Global RF GaN Industry Volume K Unit Forecast, by Material Type 2019 & 2032
- Table 115: Global RF GaN Industry Revenue Million Forecast, by Country 2019 & 2032
- Table 116: Global RF GaN Industry Volume K Unit Forecast, by Country 2019 & 2032
- Table 117: Global RF GaN Industry Revenue Million Forecast, by Application 2019 & 2032
- Table 118: Global RF GaN Industry Volume K Unit Forecast, by Application 2019 & 2032
- Table 119: Global RF GaN Industry Revenue Million Forecast, by Material Type 2019 & 2032
- Table 120: Global RF GaN Industry Volume K Unit Forecast, by Material Type 2019 & 2032
- Table 121: Global RF GaN Industry Revenue Million Forecast, by Country 2019 & 2032
- Table 122: Global RF GaN Industry Volume K Unit Forecast, by Country 2019 & 2032
Frequently Asked Questions
1. What is the projected Compound Annual Growth Rate (CAGR) of the RF GaN Industry?
The projected CAGR is approximately 18.76%.
2. Which companies are prominent players in the RF GaN Industry?
Key companies in the market include Raytheon Technologies, NXP Semiconductors NV, HRL Laboratories, MACOM Technology Solutions Holdings Inc, Microsemi Corporation (Microchip Technology Incorporated), Wolfspeed Inc (Cree Inc ), Integra Technologies Inc, Mitsubishi Electric Corporation, STMicroelectronics NV, Aethercomm Inc, Mercury Systems Inc, Qorvo Inc, Analog Devices Inc, Sumitomo Electric Device Innovations Inc.
3. What are the main segments of the RF GaN Industry?
The market segments include Application, Material Type.
4. Can you provide details about the market size?
The market size is estimated to be USD 1.70 Million as of 2022.
5. What are some drivers contributing to market growth?
Strong Demand from Telecom Infrastructure Segment Driven by Advancements in 5G Implementation; Favorable Attributes Such As High-performance and Small Form Factor to.
6. What are the notable trends driving market growth?
Strong Demand from Telecom Infrastructure Segment Driven by Advancements in 5G Implementation.
7. Are there any restraints impacting market growth?
Cost & Operational Challenges.
8. Can you provide examples of recent developments in the market?
September 2022: MaxLinear Inc. and RFHIC announced a collaboration to deliver a production-ready 400MHz Power Amplifier solution for 5G Macrocell radios, utilizing MaxLinear MaxLIN Digital Predistortion and Crest Factor Reduction technologies to optimize the performance of RFHIC's latest ID-400W series GaN RF Transistors. Combining RFHIC's dual-reverse GaN RF transistor ID41411DR with MaxLIN DPD and making it available as a pre-verified solution would allow Radio Access Network (RAN) product developers to quickly deliver ultra-wideband 400MHz Macro PAs for all global 5G mid-band deployments with high power efficiency and low emissions.
9. What pricing options are available for accessing the report?
Pricing options include single-user, multi-user, and enterprise licenses priced at USD 4750, USD 5250, and USD 8750 respectively.
10. Is the market size provided in terms of value or volume?
The market size is provided in terms of value, measured in Million and volume, measured in K Unit.
11. Are there any specific market keywords associated with the report?
Yes, the market keyword associated with the report is "RF GaN Industry," which aids in identifying and referencing the specific market segment covered.
12. How do I determine which pricing option suits my needs best?
The pricing options vary based on user requirements and access needs. Individual users may opt for single-user licenses, while businesses requiring broader access may choose multi-user or enterprise licenses for cost-effective access to the report.
13. Are there any additional resources or data provided in the RF GaN Industry report?
While the report offers comprehensive insights, it's advisable to review the specific contents or supplementary materials provided to ascertain if additional resources or data are available.
14. How can I stay updated on further developments or reports in the RF GaN Industry?
To stay informed about further developments, trends, and reports in the RF GaN Industry, consider subscribing to industry newsletters, following relevant companies and organizations, or regularly checking reputable industry news sources and publications.
Methodology
Step 1 - Identification of Relevant Samples Size from Population Database


Step 2 - Approaches for Defining Global Market Size (Value, Volume* & Price*)

Note*: In applicable scenarios
Step 3 - Data Sources
Primary Research
- Web Analytics
- Survey Reports
- Research Institute
- Latest Research Reports
- Opinion Leaders
Secondary Research
- Annual Reports
- White Paper
- Latest Press Release
- Industry Association
- Paid Database
- Investor Presentations

Step 4 - Data Triangulation
Involves using different sources of information in order to increase the validity of a study
These sources are likely to be stakeholders in a program - participants, other researchers, program staff, other community members, and so on.
Then we put all data in single framework & apply various statistical tools to find out the dynamic on the market.
During the analysis stage, feedback from the stakeholder groups would be compared to determine areas of agreement as well as areas of divergence
