

Key Insights
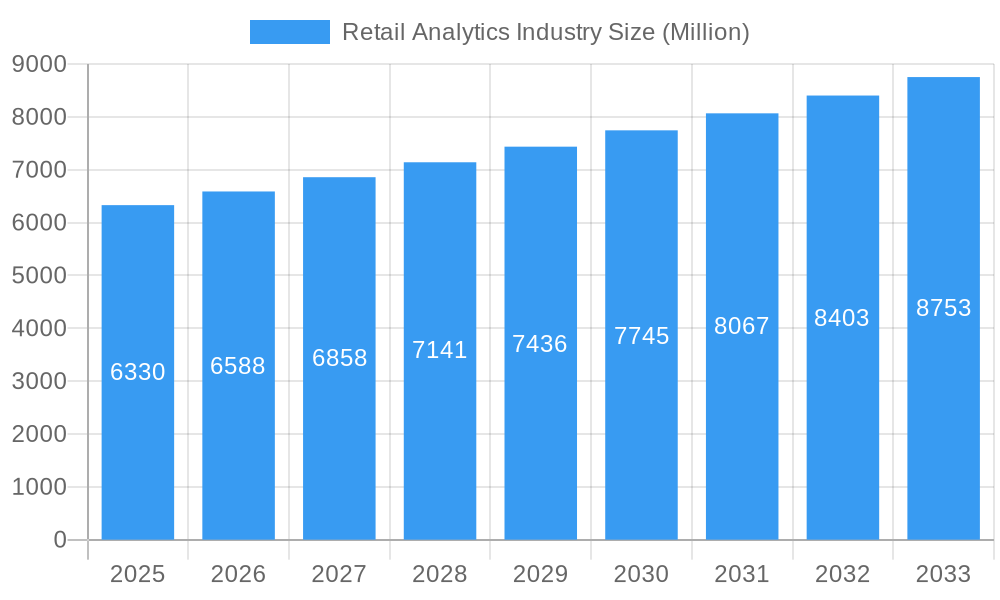
The retail analytics market, valued at $6.33 billion in 2025, is projected to experience robust growth, driven by the increasing need for data-driven decision-making within the retail sector. A Compound Annual Growth Rate (CAGR) of 4.23% from 2025 to 2033 indicates a significant expansion of this market. Key drivers include the proliferation of big data, the rise of e-commerce and omnichannel strategies, and the growing adoption of advanced analytics techniques like artificial intelligence (AI) and machine learning (ML) to optimize pricing, inventory management, and customer experience. The market is segmented by solution (software and services), deployment (cloud and on-premise), and function (customer management, in-store operations, supply chain management, marketing and merchandising, and other functions). The cloud deployment segment is expected to witness faster growth due to its scalability, cost-effectiveness, and accessibility. Software solutions are also anticipated to dominate the market, owing to their ability to integrate with existing retail systems and provide comprehensive analytical capabilities. Leading companies such as SAS Institute, IBM, and Salesforce are actively investing in developing advanced retail analytics solutions to cater to the growing demand. North America currently holds a significant market share, but Asia Pacific is poised for rapid growth due to increasing e-commerce adoption and digitalization of retail businesses in emerging economies.
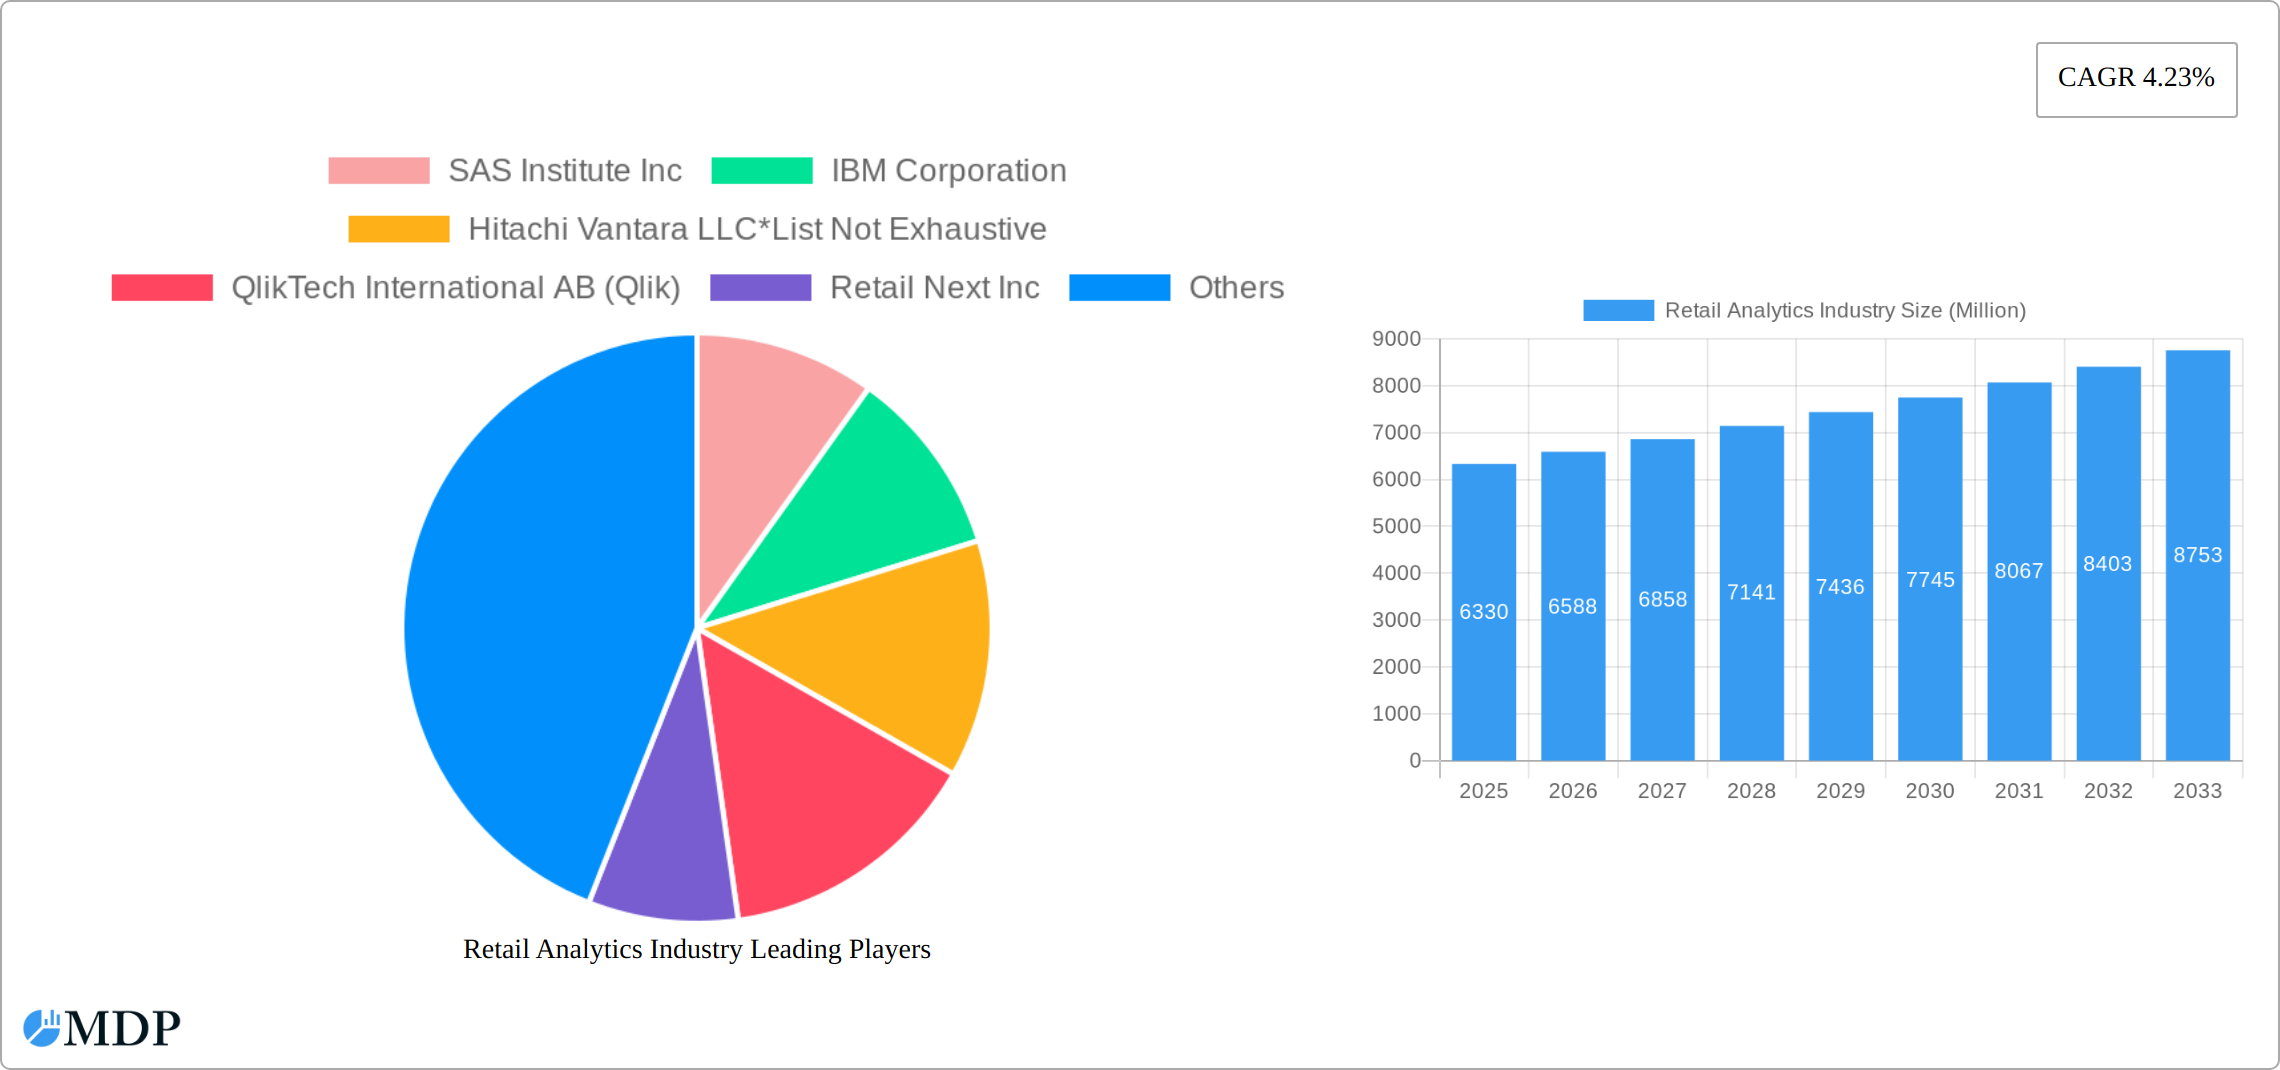
Retail Analytics Industry Market Size (In Billion)
The competitive landscape is characterized by both established players and emerging technology providers. While established players offer comprehensive suites of retail analytics solutions, emerging companies are focusing on niche areas like AI-powered predictive modeling and real-time customer insights. The increasing focus on personalized customer experiences and supply chain optimization is further fueling the growth of the market. However, challenges like data security concerns, high implementation costs, and the need for skilled analytical talent could potentially restrain market growth to some extent. Despite these challenges, the overall outlook for the retail analytics market remains positive, with substantial opportunities for growth across various segments and regions in the coming years. The ongoing digital transformation within the retail industry is a key catalyst for this sustained market expansion.
Retail Analytics Industry Company Market Share
Retail Analytics Industry Market Report: 2019-2033 Forecast
This comprehensive report provides an in-depth analysis of the Retail Analytics Industry, projecting a market value of $XX Million by 2033. The report covers market dynamics, leading players, key trends, and future opportunities, offering invaluable insights for stakeholders across the retail and technology sectors. The study period spans 2019-2033, with 2025 serving as the base and estimated year.
Retail Analytics Industry Market Dynamics & Concentration
The Retail Analytics market is experiencing robust growth, driven by the increasing adoption of data-driven decision-making within the retail sector. Market concentration is moderate, with several major players vying for market share. However, the market exhibits a dynamic landscape with frequent mergers and acquisitions (M&A) activities, signifying consolidation and the pursuit of technological advancements. In 2024, an estimated XX Million M&A deals were recorded, contributing significantly to market reshaping. The market share of the top 5 players is estimated at xx%.
- Innovation Drivers: Advancements in AI, machine learning, big data analytics, and cloud computing are revolutionizing retail analytics, providing more sophisticated insights into customer behavior, supply chain optimization, and inventory management.
- Regulatory Frameworks: Data privacy regulations (e.g., GDPR, CCPA) are shaping data handling practices within the industry, influencing product development and data security measures.
- Product Substitutes: While specific substitutes are limited, the increasing availability of readily accessible data visualization tools poses a threat to sophisticated enterprise-level solutions.
- End-User Trends: Retailers are increasingly demanding integrated solutions that combine multiple functionalities into a single platform, streamlining data analysis and operational efficiency.
- M&A Activities: Recent M&A activity, such as the Priority Software acquisition of Retailsoft (September 2023), reflects the consolidation trend and the pursuit of enhanced capabilities within the retail analytics space.
Retail Analytics Industry Industry Trends & Analysis
The Retail Analytics market is experiencing a significant expansion, projected to grow at a Compound Annual Growth Rate (CAGR) of **XX%** during the forecast period (2025-2033). This robust growth is underpinned by a confluence of transformative factors:
- Market Growth Drivers: The ever-increasing deluge of retail data, originating from diverse touchpoints like Point of Sale (POS) systems, e-commerce platforms, social media interactions, and loyalty programs, is creating an urgent need for sophisticated analytics solutions to unlock actionable insights. The market penetration of retail analytics solutions is steadily climbing, with an estimated **XX%** of retailers currently leveraging these technologies to gain a competitive edge.
- Technological Disruptions: The transformative influence of Artificial Intelligence (AI), the Internet of Things (IoT), and advanced cloud-based analytics platforms is revolutionizing retail operations. These technologies empower retailers with real-time insights, predictive capabilities, and automated decision-making processes, leading to greater efficiency and responsiveness.
- Evolving Consumer Preferences: In today's hyper-competitive landscape, delivering personalized shopping experiences is paramount for fostering customer retention and cultivating enduring loyalty. Sophisticated data analysis is the bedrock upon which these tailored experiences are built, allowing retailers to understand individual customer needs and preferences.
- Intensifying Competitive Dynamics: The retail analytics market is a vibrant arena characterized by fierce competition. A dynamic interplay between well-established industry giants and agile emerging startups is continuously driving innovation, fostering the development of more advanced solutions, and often leading to price competitiveness.
Leading Markets & Segments in Retail Analytics Industry
Currently, the North American market stands as the undisputed leader in the retail analytics landscape. This dominance is attributed to several synergistic factors: a high propensity for technology adoption, a well-established and robust digital infrastructure, and a flourishing e-commerce sector. However, the Asia-Pacific region is poised for remarkable growth in the coming years, fueled by its rapid economic expansion and the accelerating pace of digitalization across its diverse markets.
By Solution:
- Software: This segment commands the largest market share, propelled by the escalating demand for comprehensive analytics platforms equipped with a wide array of advanced functionalities, from data visualization to predictive modeling.
- Service: The services segment is experiencing substantial growth, driven by the increasing requirement for expert consulting, seamless implementation support, and ongoing maintenance for intricate retail analytics solutions.
By Deployment:
- Cloud: Cloud-based solutions are rapidly gaining favor due to their inherent scalability, cost-effectiveness, and the ease with which they can be deployed and managed, offering agility to retailers.
- On-premise: Despite the rise of cloud, on-premise deployments continue to hold relevance for organizations with exceptionally stringent data security and compliance requirements.
By Function:
- Customer Management: This segment is critically important, given the industry-wide focus on personalized marketing campaigns, enhanced customer relationship management (CRM), and predictive customer behavior analysis.
- In-store Operations: This is a pivotal segment dedicated to optimizing in-store experiences through real-time inventory management, performance monitoring, and in-depth data analysis to drive operational efficiency and boost sales.
- Supply Chain Management: The continuous drive to streamline and optimize supply chain operations remains a top priority for retailers, fueling demand for analytics solutions focused on accurate demand forecasting, efficient logistics, and proactive inventory management.
- Marketing and Merchandising: Analyzing sales data, customer purchase patterns, and market trends is indispensable for retailers seeking to optimize pricing strategies, design effective promotional campaigns, and curate compelling product assortments that resonate with consumers.
Key Drivers for Segment Dominance:
- The widespread availability of robust digital infrastructure and high internet penetration rates significantly facilitates data collection and analysis.
- Strong government initiatives and support for technological innovation are fostering an environment conducive to analytics adoption.
- High levels of consumer spending and a thriving e-commerce ecosystem in regions like North America are fundamental drivers of demand for data-driven retail strategies.
- The rapid economic growth and accelerating digitalization across the Asia-Pacific region are creating vast new opportunities for retail analytics.
Retail Analytics Industry Product Developments
Recent product innovations focus on integrating AI and machine learning capabilities into retail analytics platforms, enabling predictive analytics, personalized recommendations, and automated decision-making. These advancements improve the accuracy of sales forecasting, optimize inventory levels, and personalize customer experiences, thereby enhancing market fit and competitive advantages. The integration of IoT devices provides real-time data capture, allowing for immediate response to changing market conditions.
Key Drivers of Retail Analytics Industry Growth
The retail analytics industry is experiencing a surge in growth, primarily propelled by continuous technological advancements. Innovations in Artificial Intelligence (AI), Machine Learning (ML), and cloud computing are fundamental to this expansion, enabling more sophisticated data processing and insight generation. Economic factors, such as consistently increasing consumer spending and the exponential growth of the e-commerce sector, further bolster market expansion. Additionally, favorable regulatory environments that champion data-driven decision-making and promote ethical data usage contribute positively to the industry's trajectory. For instance, the widespread adoption of omnichannel retail strategies inherently creates a compelling need for integrated analytics solutions that can provide a unified view of the customer across all touchpoints.
Challenges in the Retail Analytics Industry Market
Data security and privacy concerns pose significant challenges, along with the high implementation costs of sophisticated analytics solutions. Integration complexities across disparate data sources and the need for skilled data scientists and analysts also represent hurdles. Competitive pressures and the emergence of disruptive technologies continually push companies to innovate and adapt, creating a challenging but dynamic environment. An estimated $XX Million is lost annually due to integration complexities alone.
Emerging Opportunities in Retail Analytics Industry
The convergence of AI and IoT devices within retail environments is unlocking unprecedented opportunities for real-time data analysis and enhanced decision-making capabilities. Strategic alliances and collaborations between retailers and leading technology providers are acting as powerful catalysts for innovation, giving rise to novel solutions and expanding market frontiers. The untapped potential of emerging markets, driven by increasing digitalization and a burgeoning middle class with growing disposable income, presents significant long-term growth prospects. Furthermore, the ongoing development of more intuitive, user-friendly interfaces for data analysis tools is poised to democratize access to these powerful technologies, thereby increasing market penetration and adoption across a wider spectrum of retail businesses.
Leading Players in the Retail Analytics Industry Sector
- SAS Institute Inc
- IBM Corporation
- Hitachi Vantara LLC
- QlikTech International AB (Qlik)
- Retail Next Inc
- Altair Engineering Inc
- Alteryx Inc
- Oracle Corporation
- Salesforce com Inc (Tableau Software Inc)
- SAP SE
Key Milestones in Retail Analytics Industry Industry
- September 2023: Priority Software acquired Retailsoft, significantly expanding its retail management product offerings and enhancing its capabilities in providing data-driven solutions for retailers. This acquisition reflects the ongoing consolidation within the market and the growing importance of integrated platforms.
- January 2023: AiFi's partnership with Microsoft to launch Smart Store Analytics highlights the increasing integration of AI-powered solutions into the retail analytics space, enabling retailers to gain real-time insights into shopper behavior and optimize store operations.
Strategic Outlook for Retail Analytics Industry Market
The Retail Analytics market is on a trajectory for substantial and sustained growth in the coming years. This positive outlook is underpinned by key trends: the rapid evolution of AI technologies, the increasing migration towards flexible and scalable cloud-based solutions, and the overarching demand for data-driven decision-making that permeates every facet of the retail sector. To effectively capitalize on future opportunities, industry players must prioritize strategic partnerships, invest heavily in research and development (R&D) to stay ahead of the innovation curve, and actively pursue expansion into high-growth emerging markets. Ultimately, the long-term success within this dynamic and competitive market will be determined by the ability of vendors to deliver integrated, user-friendly, and comprehensive solutions that precisely cater to the diverse and evolving needs of retailers worldwide.
Retail Analytics Industry Segmentation
-
1. Solution
- 1.1. Software
- 1.2. Service
-
2. Deployment
- 2.1. Cloud
- 2.2. On-premise
-
3. Function
- 3.1. Customer Management
- 3.2. In-store
- 3.3. Supply Chain Management
- 3.4. Marketin
- 3.5. Other Fu
Retail Analytics Industry Segmentation By Geography
-
1. North America
- 1.1. United States
- 1.2. Canada
-
2. Europe
- 2.1. Germany
- 2.2. United Kingdom
- 2.3. France
- 2.4. Russia
- 2.5. Rest of Europe
-
3. Asia Pacific
- 3.1. China
- 3.2. Japan
- 3.3. India
- 3.4. Rest of Asia Pacific
- 4. Latin America
- 5. Middle East and Africa
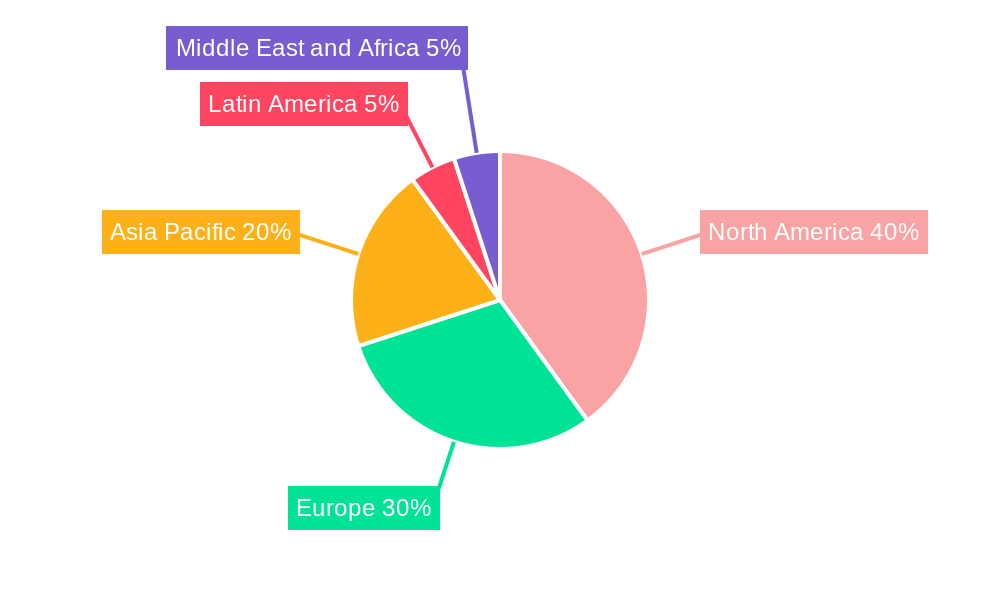
Retail Analytics Industry Regional Market Share
Geographic Coverage of Retail Analytics Industry
Retail Analytics Industry REPORT HIGHLIGHTS
| Aspects | Details |
|---|---|
| Study Period | 2020-2034 |
| Base Year | 2025 |
| Estimated Year | 2026 |
| Forecast Period | 2026-2034 |
| Historical Period | 2020-2025 |
| Growth Rate | CAGR of 4.23% from 2020-2034 |
| Segmentation |
|
Table of Contents
- 1. Introduction
- 1.1. Research Scope
- 1.2. Market Segmentation
- 1.3. Research Methodology
- 1.4. Definitions and Assumptions
- 2. Executive Summary
- 2.1. Introduction
- 3. Market Dynamics
- 3.1. Introduction
- 3.2. Market Drivers
- 3.2.1. Increasing Volumes of Data and Technological Advancements in AI and AR/VR; Increasing E-retail Sales
- 3.3. Market Restrains
- 3.3.1. Lack of General Awareness and Expertise in Emerging Regions; Standardization and Integration Issues
- 3.4. Market Trends
- 3.4.1. In-store Operation Hold Major Share
- 4. Market Factor Analysis
- 4.1. Porters Five Forces
- 4.2. Supply/Value Chain
- 4.3. PESTEL analysis
- 4.4. Market Entropy
- 4.5. Patent/Trademark Analysis
- 5. Global Retail Analytics Industry Analysis, Insights and Forecast, 2020-2032
- 5.1. Market Analysis, Insights and Forecast - by Solution
- 5.1.1. Software
- 5.1.2. Service
- 5.2. Market Analysis, Insights and Forecast - by Deployment
- 5.2.1. Cloud
- 5.2.2. On-premise
- 5.3. Market Analysis, Insights and Forecast - by Function
- 5.3.1. Customer Management
- 5.3.2. In-store
- 5.3.3. Supply Chain Management
- 5.3.4. Marketin
- 5.3.5. Other Fu
- 5.4. Market Analysis, Insights and Forecast - by Region
- 5.4.1. North America
- 5.4.2. Europe
- 5.4.3. Asia Pacific
- 5.4.4. Latin America
- 5.4.5. Middle East and Africa
- 5.1. Market Analysis, Insights and Forecast - by Solution
- 6. North America Retail Analytics Industry Analysis, Insights and Forecast, 2020-2032
- 6.1. Market Analysis, Insights and Forecast - by Solution
- 6.1.1. Software
- 6.1.2. Service
- 6.2. Market Analysis, Insights and Forecast - by Deployment
- 6.2.1. Cloud
- 6.2.2. On-premise
- 6.3. Market Analysis, Insights and Forecast - by Function
- 6.3.1. Customer Management
- 6.3.2. In-store
- 6.3.3. Supply Chain Management
- 6.3.4. Marketin
- 6.3.5. Other Fu
- 6.1. Market Analysis, Insights and Forecast - by Solution
- 7. Europe Retail Analytics Industry Analysis, Insights and Forecast, 2020-2032
- 7.1. Market Analysis, Insights and Forecast - by Solution
- 7.1.1. Software
- 7.1.2. Service
- 7.2. Market Analysis, Insights and Forecast - by Deployment
- 7.2.1. Cloud
- 7.2.2. On-premise
- 7.3. Market Analysis, Insights and Forecast - by Function
- 7.3.1. Customer Management
- 7.3.2. In-store
- 7.3.3. Supply Chain Management
- 7.3.4. Marketin
- 7.3.5. Other Fu
- 7.1. Market Analysis, Insights and Forecast - by Solution
- 8. Asia Pacific Retail Analytics Industry Analysis, Insights and Forecast, 2020-2032
- 8.1. Market Analysis, Insights and Forecast - by Solution
- 8.1.1. Software
- 8.1.2. Service
- 8.2. Market Analysis, Insights and Forecast - by Deployment
- 8.2.1. Cloud
- 8.2.2. On-premise
- 8.3. Market Analysis, Insights and Forecast - by Function
- 8.3.1. Customer Management
- 8.3.2. In-store
- 8.3.3. Supply Chain Management
- 8.3.4. Marketin
- 8.3.5. Other Fu
- 8.1. Market Analysis, Insights and Forecast - by Solution
- 9. Latin America Retail Analytics Industry Analysis, Insights and Forecast, 2020-2032
- 9.1. Market Analysis, Insights and Forecast - by Solution
- 9.1.1. Software
- 9.1.2. Service
- 9.2. Market Analysis, Insights and Forecast - by Deployment
- 9.2.1. Cloud
- 9.2.2. On-premise
- 9.3. Market Analysis, Insights and Forecast - by Function
- 9.3.1. Customer Management
- 9.3.2. In-store
- 9.3.3. Supply Chain Management
- 9.3.4. Marketin
- 9.3.5. Other Fu
- 9.1. Market Analysis, Insights and Forecast - by Solution
- 10. Middle East and Africa Retail Analytics Industry Analysis, Insights and Forecast, 2020-2032
- 10.1. Market Analysis, Insights and Forecast - by Solution
- 10.1.1. Software
- 10.1.2. Service
- 10.2. Market Analysis, Insights and Forecast - by Deployment
- 10.2.1. Cloud
- 10.2.2. On-premise
- 10.3. Market Analysis, Insights and Forecast - by Function
- 10.3.1. Customer Management
- 10.3.2. In-store
- 10.3.3. Supply Chain Management
- 10.3.4. Marketin
- 10.3.5. Other Fu
- 10.1. Market Analysis, Insights and Forecast - by Solution
- 11. Competitive Analysis
- 11.1. Global Market Share Analysis 2025
- 11.2. Company Profiles
- 11.2.1 SAS Institute Inc
- 11.2.1.1. Overview
- 11.2.1.2. Products
- 11.2.1.3. SWOT Analysis
- 11.2.1.4. Recent Developments
- 11.2.1.5. Financials (Based on Availability)
- 11.2.2 IBM Corporation
- 11.2.2.1. Overview
- 11.2.2.2. Products
- 11.2.2.3. SWOT Analysis
- 11.2.2.4. Recent Developments
- 11.2.2.5. Financials (Based on Availability)
- 11.2.3 Hitachi Vantara LLC*List Not Exhaustive
- 11.2.3.1. Overview
- 11.2.3.2. Products
- 11.2.3.3. SWOT Analysis
- 11.2.3.4. Recent Developments
- 11.2.3.5. Financials (Based on Availability)
- 11.2.4 QlikTech International AB (Qlik)
- 11.2.4.1. Overview
- 11.2.4.2. Products
- 11.2.4.3. SWOT Analysis
- 11.2.4.4. Recent Developments
- 11.2.4.5. Financials (Based on Availability)
- 11.2.5 Retail Next Inc
- 11.2.5.1. Overview
- 11.2.5.2. Products
- 11.2.5.3. SWOT Analysis
- 11.2.5.4. Recent Developments
- 11.2.5.5. Financials (Based on Availability)
- 11.2.6 Altair Engineering Inc
- 11.2.6.1. Overview
- 11.2.6.2. Products
- 11.2.6.3. SWOT Analysis
- 11.2.6.4. Recent Developments
- 11.2.6.5. Financials (Based on Availability)
- 11.2.7 Alteryx Inc
- 11.2.7.1. Overview
- 11.2.7.2. Products
- 11.2.7.3. SWOT Analysis
- 11.2.7.4. Recent Developments
- 11.2.7.5. Financials (Based on Availability)
- 11.2.8 Oracle Corporation
- 11.2.8.1. Overview
- 11.2.8.2. Products
- 11.2.8.3. SWOT Analysis
- 11.2.8.4. Recent Developments
- 11.2.8.5. Financials (Based on Availability)
- 11.2.9 Salesforce com Inc (Tableau Software Inc )
- 11.2.9.1. Overview
- 11.2.9.2. Products
- 11.2.9.3. SWOT Analysis
- 11.2.9.4. Recent Developments
- 11.2.9.5. Financials (Based on Availability)
- 11.2.10 SAP SE
- 11.2.10.1. Overview
- 11.2.10.2. Products
- 11.2.10.3. SWOT Analysis
- 11.2.10.4. Recent Developments
- 11.2.10.5. Financials (Based on Availability)
- 11.2.1 SAS Institute Inc
List of Figures
- Figure 1: Global Retail Analytics Industry Revenue Breakdown (Million, %) by Region 2025 & 2033
- Figure 2: North America Retail Analytics Industry Revenue (Million), by Solution 2025 & 2033
- Figure 3: North America Retail Analytics Industry Revenue Share (%), by Solution 2025 & 2033
- Figure 4: North America Retail Analytics Industry Revenue (Million), by Deployment 2025 & 2033
- Figure 5: North America Retail Analytics Industry Revenue Share (%), by Deployment 2025 & 2033
- Figure 6: North America Retail Analytics Industry Revenue (Million), by Function 2025 & 2033
- Figure 7: North America Retail Analytics Industry Revenue Share (%), by Function 2025 & 2033
- Figure 8: North America Retail Analytics Industry Revenue (Million), by Country 2025 & 2033
- Figure 9: North America Retail Analytics Industry Revenue Share (%), by Country 2025 & 2033
- Figure 10: Europe Retail Analytics Industry Revenue (Million), by Solution 2025 & 2033
- Figure 11: Europe Retail Analytics Industry Revenue Share (%), by Solution 2025 & 2033
- Figure 12: Europe Retail Analytics Industry Revenue (Million), by Deployment 2025 & 2033
- Figure 13: Europe Retail Analytics Industry Revenue Share (%), by Deployment 2025 & 2033
- Figure 14: Europe Retail Analytics Industry Revenue (Million), by Function 2025 & 2033
- Figure 15: Europe Retail Analytics Industry Revenue Share (%), by Function 2025 & 2033
- Figure 16: Europe Retail Analytics Industry Revenue (Million), by Country 2025 & 2033
- Figure 17: Europe Retail Analytics Industry Revenue Share (%), by Country 2025 & 2033
- Figure 18: Asia Pacific Retail Analytics Industry Revenue (Million), by Solution 2025 & 2033
- Figure 19: Asia Pacific Retail Analytics Industry Revenue Share (%), by Solution 2025 & 2033
- Figure 20: Asia Pacific Retail Analytics Industry Revenue (Million), by Deployment 2025 & 2033
- Figure 21: Asia Pacific Retail Analytics Industry Revenue Share (%), by Deployment 2025 & 2033
- Figure 22: Asia Pacific Retail Analytics Industry Revenue (Million), by Function 2025 & 2033
- Figure 23: Asia Pacific Retail Analytics Industry Revenue Share (%), by Function 2025 & 2033
- Figure 24: Asia Pacific Retail Analytics Industry Revenue (Million), by Country 2025 & 2033
- Figure 25: Asia Pacific Retail Analytics Industry Revenue Share (%), by Country 2025 & 2033
- Figure 26: Latin America Retail Analytics Industry Revenue (Million), by Solution 2025 & 2033
- Figure 27: Latin America Retail Analytics Industry Revenue Share (%), by Solution 2025 & 2033
- Figure 28: Latin America Retail Analytics Industry Revenue (Million), by Deployment 2025 & 2033
- Figure 29: Latin America Retail Analytics Industry Revenue Share (%), by Deployment 2025 & 2033
- Figure 30: Latin America Retail Analytics Industry Revenue (Million), by Function 2025 & 2033
- Figure 31: Latin America Retail Analytics Industry Revenue Share (%), by Function 2025 & 2033
- Figure 32: Latin America Retail Analytics Industry Revenue (Million), by Country 2025 & 2033
- Figure 33: Latin America Retail Analytics Industry Revenue Share (%), by Country 2025 & 2033
- Figure 34: Middle East and Africa Retail Analytics Industry Revenue (Million), by Solution 2025 & 2033
- Figure 35: Middle East and Africa Retail Analytics Industry Revenue Share (%), by Solution 2025 & 2033
- Figure 36: Middle East and Africa Retail Analytics Industry Revenue (Million), by Deployment 2025 & 2033
- Figure 37: Middle East and Africa Retail Analytics Industry Revenue Share (%), by Deployment 2025 & 2033
- Figure 38: Middle East and Africa Retail Analytics Industry Revenue (Million), by Function 2025 & 2033
- Figure 39: Middle East and Africa Retail Analytics Industry Revenue Share (%), by Function 2025 & 2033
- Figure 40: Middle East and Africa Retail Analytics Industry Revenue (Million), by Country 2025 & 2033
- Figure 41: Middle East and Africa Retail Analytics Industry Revenue Share (%), by Country 2025 & 2033
List of Tables
- Table 1: Global Retail Analytics Industry Revenue Million Forecast, by Solution 2020 & 2033
- Table 2: Global Retail Analytics Industry Revenue Million Forecast, by Deployment 2020 & 2033
- Table 3: Global Retail Analytics Industry Revenue Million Forecast, by Function 2020 & 2033
- Table 4: Global Retail Analytics Industry Revenue Million Forecast, by Region 2020 & 2033
- Table 5: Global Retail Analytics Industry Revenue Million Forecast, by Solution 2020 & 2033
- Table 6: Global Retail Analytics Industry Revenue Million Forecast, by Deployment 2020 & 2033
- Table 7: Global Retail Analytics Industry Revenue Million Forecast, by Function 2020 & 2033
- Table 8: Global Retail Analytics Industry Revenue Million Forecast, by Country 2020 & 2033
- Table 9: United States Retail Analytics Industry Revenue (Million) Forecast, by Application 2020 & 2033
- Table 10: Canada Retail Analytics Industry Revenue (Million) Forecast, by Application 2020 & 2033
- Table 11: Global Retail Analytics Industry Revenue Million Forecast, by Solution 2020 & 2033
- Table 12: Global Retail Analytics Industry Revenue Million Forecast, by Deployment 2020 & 2033
- Table 13: Global Retail Analytics Industry Revenue Million Forecast, by Function 2020 & 2033
- Table 14: Global Retail Analytics Industry Revenue Million Forecast, by Country 2020 & 2033
- Table 15: Germany Retail Analytics Industry Revenue (Million) Forecast, by Application 2020 & 2033
- Table 16: United Kingdom Retail Analytics Industry Revenue (Million) Forecast, by Application 2020 & 2033
- Table 17: France Retail Analytics Industry Revenue (Million) Forecast, by Application 2020 & 2033
- Table 18: Russia Retail Analytics Industry Revenue (Million) Forecast, by Application 2020 & 2033
- Table 19: Rest of Europe Retail Analytics Industry Revenue (Million) Forecast, by Application 2020 & 2033
- Table 20: Global Retail Analytics Industry Revenue Million Forecast, by Solution 2020 & 2033
- Table 21: Global Retail Analytics Industry Revenue Million Forecast, by Deployment 2020 & 2033
- Table 22: Global Retail Analytics Industry Revenue Million Forecast, by Function 2020 & 2033
- Table 23: Global Retail Analytics Industry Revenue Million Forecast, by Country 2020 & 2033
- Table 24: China Retail Analytics Industry Revenue (Million) Forecast, by Application 2020 & 2033
- Table 25: Japan Retail Analytics Industry Revenue (Million) Forecast, by Application 2020 & 2033
- Table 26: India Retail Analytics Industry Revenue (Million) Forecast, by Application 2020 & 2033
- Table 27: Rest of Asia Pacific Retail Analytics Industry Revenue (Million) Forecast, by Application 2020 & 2033
- Table 28: Global Retail Analytics Industry Revenue Million Forecast, by Solution 2020 & 2033
- Table 29: Global Retail Analytics Industry Revenue Million Forecast, by Deployment 2020 & 2033
- Table 30: Global Retail Analytics Industry Revenue Million Forecast, by Function 2020 & 2033
- Table 31: Global Retail Analytics Industry Revenue Million Forecast, by Country 2020 & 2033
- Table 32: Global Retail Analytics Industry Revenue Million Forecast, by Solution 2020 & 2033
- Table 33: Global Retail Analytics Industry Revenue Million Forecast, by Deployment 2020 & 2033
- Table 34: Global Retail Analytics Industry Revenue Million Forecast, by Function 2020 & 2033
- Table 35: Global Retail Analytics Industry Revenue Million Forecast, by Country 2020 & 2033
Frequently Asked Questions
1. What is the projected Compound Annual Growth Rate (CAGR) of the Retail Analytics Industry?
The projected CAGR is approximately 4.23%.
2. Which companies are prominent players in the Retail Analytics Industry?
Key companies in the market include SAS Institute Inc, IBM Corporation, Hitachi Vantara LLC*List Not Exhaustive, QlikTech International AB (Qlik), Retail Next Inc, Altair Engineering Inc, Alteryx Inc, Oracle Corporation, Salesforce com Inc (Tableau Software Inc ), SAP SE.
3. What are the main segments of the Retail Analytics Industry?
The market segments include Solution, Deployment, Function.
4. Can you provide details about the market size?
The market size is estimated to be USD 6.33 Million as of 2022.
5. What are some drivers contributing to market growth?
Increasing Volumes of Data and Technological Advancements in AI and AR/VR; Increasing E-retail Sales.
6. What are the notable trends driving market growth?
In-store Operation Hold Major Share.
7. Are there any restraints impacting market growth?
Lack of General Awareness and Expertise in Emerging Regions; Standardization and Integration Issues.
8. Can you provide examples of recent developments in the market?
September 2023 - Priority Software acquired Retailsoft, a developer of innovative technology solutions for optimizing retail business efficiency and enhancing revenue growth. In addition, Priority is expanding the scope of its Retail Management Products and delivering significant value to Retailers by integrating Retailsoft's solutions. Retailsoft provides a dynamic platform with operational modules tailored to each organization's needs. These modules comprise work scheduling, communication tools, objective setting, and real-time access to POS data across all locations. Such features empower businesses with trend analysis, monitoring, and strategy optimization, facilitating data-driven decisions, sales goal setting, and fostering competition among branches.
9. What pricing options are available for accessing the report?
Pricing options include single-user, multi-user, and enterprise licenses priced at USD 4750, USD 5250, and USD 8750 respectively.
10. Is the market size provided in terms of value or volume?
The market size is provided in terms of value, measured in Million.
11. Are there any specific market keywords associated with the report?
Yes, the market keyword associated with the report is "Retail Analytics Industry," which aids in identifying and referencing the specific market segment covered.
12. How do I determine which pricing option suits my needs best?
The pricing options vary based on user requirements and access needs. Individual users may opt for single-user licenses, while businesses requiring broader access may choose multi-user or enterprise licenses for cost-effective access to the report.
13. Are there any additional resources or data provided in the Retail Analytics Industry report?
While the report offers comprehensive insights, it's advisable to review the specific contents or supplementary materials provided to ascertain if additional resources or data are available.
14. How can I stay updated on further developments or reports in the Retail Analytics Industry?
To stay informed about further developments, trends, and reports in the Retail Analytics Industry, consider subscribing to industry newsletters, following relevant companies and organizations, or regularly checking reputable industry news sources and publications.
Methodology
Step 1 - Identification of Relevant Samples Size from Population Database


Step 2 - Approaches for Defining Global Market Size (Value, Volume* & Price*)

Note*: In applicable scenarios
Step 3 - Data Sources
Primary Research
- Web Analytics
- Survey Reports
- Research Institute
- Latest Research Reports
- Opinion Leaders
Secondary Research
- Annual Reports
- White Paper
- Latest Press Release
- Industry Association
- Paid Database
- Investor Presentations

Step 4 - Data Triangulation
Involves using different sources of information in order to increase the validity of a study
These sources are likely to be stakeholders in a program - participants, other researchers, program staff, other community members, and so on.
Then we put all data in single framework & apply various statistical tools to find out the dynamic on the market.
During the analysis stage, feedback from the stakeholder groups would be compared to determine areas of agreement as well as areas of divergence