

Key Insights
The Ready-to-Drink (RTD) beverages market, valued at $361.01 million in 2025, is projected to experience robust growth, driven by several key factors. The increasing consumer preference for convenient and on-the-go consumption options fuels demand across diverse product categories. The rising popularity of health-conscious beverages, such as flavored and fortified water, yogurt drinks, and dairy alternatives, is significantly impacting market expansion. Furthermore, innovative product launches featuring functional ingredients and unique flavor profiles are attracting a wider consumer base. The market's segmentation reflects this diversification, with supermarkets/hypermarkets maintaining a dominant distribution channel, while online stores are witnessing rapid growth, indicating a shift towards e-commerce. Key players, including Nestle SA, PepsiCo Inc., and Coca-Cola Company, are strategically investing in product development, brand building, and expanding their distribution networks to capitalize on this growth potential. Competitive pricing strategies and targeted marketing campaigns further contribute to the market's dynamism.
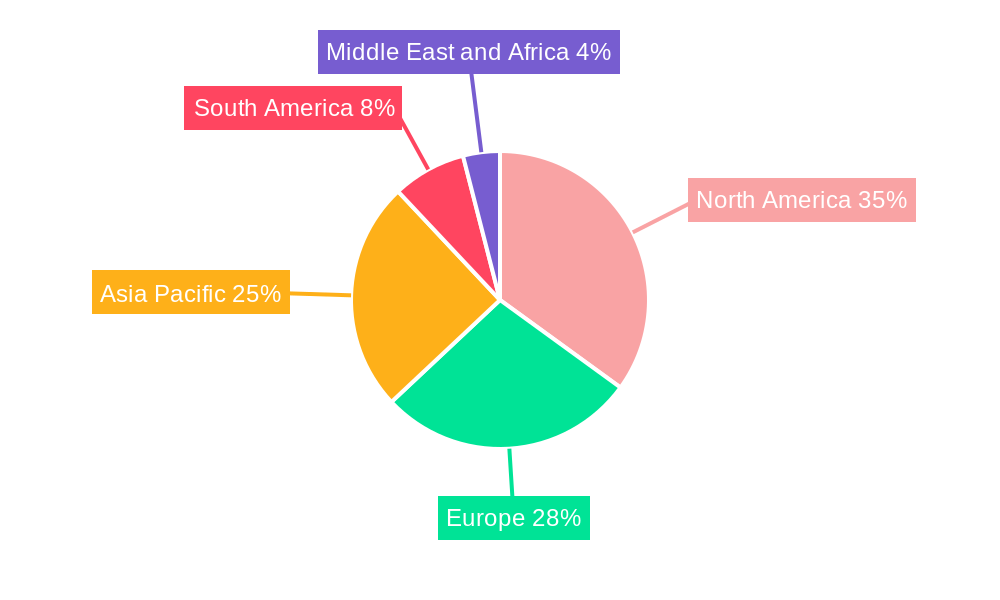
Growth within specific segments, such as energy drinks and tea, is anticipated to outpace the overall market average. This is attributed to the growing awareness of health and wellness among consumers, and their demand for healthier alternatives to traditional sugary drinks. However, fluctuating raw material prices and stringent regulatory frameworks could pose challenges. Geographical expansion, particularly in emerging markets with a growing middle class and increased disposable income, presents significant opportunities. The Asia Pacific region, with its large population and rising consumption, is expected to be a key driver of future growth, followed by North America due to its established market and consumer preference for premium and innovative products. The forecast period of 2025-2033 promises sustained expansion, with continued innovation and strategic market penetration by major players.

Ready-to-Drink Beverages Market: A Comprehensive Market Report (2019-2033)
This in-depth report provides a comprehensive analysis of the Ready-to-Drink Beverages market, offering actionable insights for industry stakeholders. Covering the period from 2019 to 2033, with a focus on 2025, this report details market dynamics, trends, leading players, and future opportunities. The global Ready-to-Drink Beverages market is expected to reach xx Million by 2033, exhibiting a CAGR of xx% during the forecast period (2025-2033).
Ready to Drink Beverages Market Market Dynamics & Concentration
The Ready-to-Drink Beverages market is characterized by a high degree of concentration, with a few major players holding significant market share. Nestle SA, PepsiCo Inc., The Coca-Cola Company, and Monster Beverage Corporation are among the leading players, driving innovation and shaping market trends. Market concentration is further influenced by factors such as brand loyalty, distribution networks, and marketing strategies. The market is witnessing continuous innovation, with new product launches, flavor variations, and functional beverage introductions driving growth. Stringent regulatory frameworks concerning labeling, ingredients, and health claims also impact market dynamics. Substitutes like freshly squeezed juices and homemade beverages exert some competitive pressure. Consumer preferences towards healthier, functional, and convenient beverages significantly influence market trends. M&A activities, while not frequent, play a role in consolidating market share and driving innovation. For example, in the past 5 years, there have been approximately xx M&A deals in the industry, resulting in a xx% change in market share among the top 5 players.
- Market Concentration: High, with top 5 players holding approximately xx% market share.
- Innovation Drivers: New product launches, functional beverages, and health-focused offerings.
- Regulatory Frameworks: Stringent regulations on labeling, ingredients, and health claims.
- Product Substitutes: Freshly squeezed juices, homemade beverages.
- End-User Trends: Growing demand for healthier, convenient, and functional beverages.
- M&A Activities: Approximately xx deals in the last 5 years, resulting in a xx% shift in market share.
Ready to Drink Beverages Market Industry Trends & Analysis
The Ready-to-Drink Beverages market is experiencing robust growth, driven by several key factors. Changing lifestyles, increased disposable incomes, and the rising demand for convenient and on-the-go consumption options are major contributors. Technological advancements in packaging, preservation, and flavor enhancement further fuel market expansion. Consumer preferences are shifting towards healthier alternatives, including functional beverages enriched with vitamins, minerals, and antioxidants. The market witnesses intense competitive dynamics, with companies constantly innovating to capture market share. Premiumization and customization are also emerging trends, with consumers willing to pay more for high-quality, unique products. The market penetration of ready-to-drink beverages is high in developed economies and is rapidly increasing in developing countries. The global CAGR for the period 2019-2024 is estimated to be xx%, indicating robust growth.

Leading Markets & Segments in Ready to Drink Beverages Market
The Ready-to-Drink Beverages market is geographically diverse, with significant regional variations in consumption patterns and market dynamics. North America and Europe currently dominate the market, while Asia-Pacific is expected to witness significant growth in the coming years. Within product types, energy drinks and flavored waters show strong growth. Supermarkets/hypermarkets remain the leading distribution channel, although online stores are gaining traction.
Key Drivers:
- North America: High per capita consumption, strong brand presence, and advanced distribution networks.
- Europe: Well-established market with diverse product offerings and strong consumer preferences.
- Asia-Pacific: Rapidly growing economies, increasing disposable incomes, and changing lifestyles.
Dominant Segments:
- Distribution Channel: Supermarkets/Hypermarkets (xx% market share), followed by Convenience/Grocery Stores. Online stores are experiencing rapid growth (xx% CAGR).
- Product Type: Energy Drinks and Flavored & Fortified Water currently dominate, showcasing high growth potential. Tea and Coffee segments also exhibit significant market share.
Ready to Drink Beverages Market Product Developments
Recent product developments in the ready-to-drink beverages market focus on health and wellness. This includes incorporating functional ingredients like probiotics, vitamins, and antioxidants, and using natural and organic ingredients. The focus on sustainability and eco-friendly packaging is also gaining momentum. Innovations in flavor profiles and unique product formats further cater to evolving consumer preferences. Companies are leveraging technological advancements in packaging and preservation to enhance product shelf life and quality. This drive towards healthier options contributes to the market’s expanding appeal.
Key Drivers of Ready to Drink Beverages Market Growth
Several factors contribute to the growth of the Ready-to-Drink Beverages market. Technological advancements in packaging and production enhance efficiency and product quality. The increasing disposable incomes in emerging economies drive demand. Favorable government policies and regulations support market expansion. For instance, the promotion of healthier beverage options through tax incentives or labeling regulations influences consumer choices.
Challenges in the Ready to Drink Beverages Market Market
The Ready-to-Drink Beverages market faces several challenges. Stringent regulatory compliance regarding ingredients and labeling adds complexity and cost. Fluctuations in raw material prices impact profitability. Intense competition among established players and the emergence of new brands necessitate constant innovation and marketing efforts. Supply chain disruptions can significantly affect production and distribution. These factors contribute to market volatility and require effective strategies for mitigation.
Emerging Opportunities in Ready to Drink Beverages Market
The Ready-to-Drink Beverages market presents substantial long-term growth opportunities. Technological breakthroughs in personalized nutrition and functional beverages offer exciting possibilities. Strategic partnerships and collaborations among companies can lead to market expansion and innovation. Expansion into untapped markets in developing countries presents significant potential for growth. The focus on sustainability and eco-friendly practices further opens doors for innovative products and packaging solutions.
Leading Players in the Ready to Drink Beverages Market Sector
- Nestle SA
- Dabur India Limited
- Monster Beverage Corporation
- Yakult Honsha Co Ltd
- Pepsico Inc
- Danone SA
- Suntory Holdings Limited
- Red Bull GmbH
- Blue Diamond Growers
- The Coca-Cola Company
Key Milestones in Ready to Drink Beverages Market Industry
- February 2023: PepsiCo launched a marshmallow-flavored cola in partnership with Peeps, expanding into novelty flavors and leveraging brand collaborations.
- September 2022: Honest Tea launched Just Iced Tea, highlighting the growing consumer preference for organic and ethically sourced products.
- March 2022: Nirvana Water Sciences Inc. introduced a functional water product with immune-boosting and muscle recovery properties, reflecting the trend towards functional beverages.
Strategic Outlook for Ready to Drink Beverages Market Market
The Ready-to-Drink Beverages market is poised for sustained growth, driven by evolving consumer preferences and technological innovations. Companies must focus on product differentiation, health and wellness attributes, sustainable packaging, and strategic partnerships to maintain a competitive edge. Expanding into new markets and exploring emerging beverage categories presents significant growth opportunities. Adopting a data-driven approach and leveraging digital marketing strategies will be crucial for future success.
Ready to Drink Beverages Market Segmentation
-
1. Product Type
- 1.1. Tea
- 1.2. Coffee
- 1.3. Energy Drinks
- 1.4. Yogurt Drinks
- 1.5. Dairy and Dairy Alternative Beverages
- 1.6. Flavored and Fortified Water
- 1.7. Other Product Types
-
2. Distribution Channel
- 2.1. Supermarkets/Hypermarkets
- 2.2. Convenience/Grocery Stores
- 2.3. Online Stores
- 2.4. Specialty Retail Stores
- 2.5. Other Distribution Channels
Ready to Drink Beverages Market Segmentation By Geography
-
1. North America
- 1.1. United States
- 1.2. Canada
- 1.3. Mexico
- 1.4. Rest of North America
-
2. Europe
- 2.1. Germany
- 2.2. United Kingdom
- 2.3. Italy
- 2.4. Spain
- 2.5. France
- 2.6. Russia
- 2.7. Rest of Europe
-
3. Asia Pacific
- 3.1. China
- 3.2. Japan
- 3.3. India
- 3.4. Australia
- 3.5. Rest of Asia Pacific
-
4. South America
- 4.1. Brazil
- 4.2. Argentina
- 4.3. Rest of South America
-
5. Middle East and Africa
- 5.1. South Africa
- 5.2. Saudi Arabia
- 5.3. Rest of Middle East and Africa
Ready to Drink Beverages Market REPORT HIGHLIGHTS
| Aspects | Details |
|---|---|
| Study Period | 2019-2033 |
| Base Year | 2024 |
| Estimated Year | 2025 |
| Forecast Period | 2025-2033 |
| Historical Period | 2019-2024 |
| Growth Rate | CAGR of 4.81% from 2019-2033 |
| Segmentation |
|
Table of Contents
- 1. Introduction
- 1.1. Research Scope
- 1.2. Market Segmentation
- 1.3. Research Methodology
- 1.4. Definitions and Assumptions
- 2. Executive Summary
- 2.1. Introduction
- 3. Market Dynamics
- 3.1. Introduction
- 3.2. Market Drivers
- 3.2.1. Inclination Toward Low-Sugar/Sugar-free Beverages
- 3.3. Market Restrains
- 3.3.1. Concerns Over Health Issues Associated with Functional Beverages
- 3.4. Market Trends
- 3.4.1. Augmented Expenditure on Advertisement and Promotional Activities Impel Market Growth
- 4. Market Factor Analysis
- 4.1. Porters Five Forces
- 4.2. Supply/Value Chain
- 4.3. PESTEL analysis
- 4.4. Market Entropy
- 4.5. Patent/Trademark Analysis
- 5. Global Ready to Drink Beverages Market Analysis, Insights and Forecast, 2019-2031
- 5.1. Market Analysis, Insights and Forecast - by Product Type
- 5.1.1. Tea
- 5.1.2. Coffee
- 5.1.3. Energy Drinks
- 5.1.4. Yogurt Drinks
- 5.1.5. Dairy and Dairy Alternative Beverages
- 5.1.6. Flavored and Fortified Water
- 5.1.7. Other Product Types
- 5.2. Market Analysis, Insights and Forecast - by Distribution Channel
- 5.2.1. Supermarkets/Hypermarkets
- 5.2.2. Convenience/Grocery Stores
- 5.2.3. Online Stores
- 5.2.4. Specialty Retail Stores
- 5.2.5. Other Distribution Channels
- 5.3. Market Analysis, Insights and Forecast - by Region
- 5.3.1. North America
- 5.3.2. Europe
- 5.3.3. Asia Pacific
- 5.3.4. South America
- 5.3.5. Middle East and Africa
- 5.1. Market Analysis, Insights and Forecast - by Product Type
- 6. North America Ready to Drink Beverages Market Analysis, Insights and Forecast, 2019-2031
- 6.1. Market Analysis, Insights and Forecast - by Product Type
- 6.1.1. Tea
- 6.1.2. Coffee
- 6.1.3. Energy Drinks
- 6.1.4. Yogurt Drinks
- 6.1.5. Dairy and Dairy Alternative Beverages
- 6.1.6. Flavored and Fortified Water
- 6.1.7. Other Product Types
- 6.2. Market Analysis, Insights and Forecast - by Distribution Channel
- 6.2.1. Supermarkets/Hypermarkets
- 6.2.2. Convenience/Grocery Stores
- 6.2.3. Online Stores
- 6.2.4. Specialty Retail Stores
- 6.2.5. Other Distribution Channels
- 6.1. Market Analysis, Insights and Forecast - by Product Type
- 7. Europe Ready to Drink Beverages Market Analysis, Insights and Forecast, 2019-2031
- 7.1. Market Analysis, Insights and Forecast - by Product Type
- 7.1.1. Tea
- 7.1.2. Coffee
- 7.1.3. Energy Drinks
- 7.1.4. Yogurt Drinks
- 7.1.5. Dairy and Dairy Alternative Beverages
- 7.1.6. Flavored and Fortified Water
- 7.1.7. Other Product Types
- 7.2. Market Analysis, Insights and Forecast - by Distribution Channel
- 7.2.1. Supermarkets/Hypermarkets
- 7.2.2. Convenience/Grocery Stores
- 7.2.3. Online Stores
- 7.2.4. Specialty Retail Stores
- 7.2.5. Other Distribution Channels
- 7.1. Market Analysis, Insights and Forecast - by Product Type
- 8. Asia Pacific Ready to Drink Beverages Market Analysis, Insights and Forecast, 2019-2031
- 8.1. Market Analysis, Insights and Forecast - by Product Type
- 8.1.1. Tea
- 8.1.2. Coffee
- 8.1.3. Energy Drinks
- 8.1.4. Yogurt Drinks
- 8.1.5. Dairy and Dairy Alternative Beverages
- 8.1.6. Flavored and Fortified Water
- 8.1.7. Other Product Types
- 8.2. Market Analysis, Insights and Forecast - by Distribution Channel
- 8.2.1. Supermarkets/Hypermarkets
- 8.2.2. Convenience/Grocery Stores
- 8.2.3. Online Stores
- 8.2.4. Specialty Retail Stores
- 8.2.5. Other Distribution Channels
- 8.1. Market Analysis, Insights and Forecast - by Product Type
- 9. South America Ready to Drink Beverages Market Analysis, Insights and Forecast, 2019-2031
- 9.1. Market Analysis, Insights and Forecast - by Product Type
- 9.1.1. Tea
- 9.1.2. Coffee
- 9.1.3. Energy Drinks
- 9.1.4. Yogurt Drinks
- 9.1.5. Dairy and Dairy Alternative Beverages
- 9.1.6. Flavored and Fortified Water
- 9.1.7. Other Product Types
- 9.2. Market Analysis, Insights and Forecast - by Distribution Channel
- 9.2.1. Supermarkets/Hypermarkets
- 9.2.2. Convenience/Grocery Stores
- 9.2.3. Online Stores
- 9.2.4. Specialty Retail Stores
- 9.2.5. Other Distribution Channels
- 9.1. Market Analysis, Insights and Forecast - by Product Type
- 10. Middle East and Africa Ready to Drink Beverages Market Analysis, Insights and Forecast, 2019-2031
- 10.1. Market Analysis, Insights and Forecast - by Product Type
- 10.1.1. Tea
- 10.1.2. Coffee
- 10.1.3. Energy Drinks
- 10.1.4. Yogurt Drinks
- 10.1.5. Dairy and Dairy Alternative Beverages
- 10.1.6. Flavored and Fortified Water
- 10.1.7. Other Product Types
- 10.2. Market Analysis, Insights and Forecast - by Distribution Channel
- 10.2.1. Supermarkets/Hypermarkets
- 10.2.2. Convenience/Grocery Stores
- 10.2.3. Online Stores
- 10.2.4. Specialty Retail Stores
- 10.2.5. Other Distribution Channels
- 10.1. Market Analysis, Insights and Forecast - by Product Type
- 11. North America Ready to Drink Beverages Market Analysis, Insights and Forecast, 2019-2031
- 11.1. Market Analysis, Insights and Forecast - By Country/Sub-region
- 11.1.1 United States
- 11.1.2 Canada
- 11.1.3 Mexico
- 11.1.4 Rest of North America
- 12. Europe Ready to Drink Beverages Market Analysis, Insights and Forecast, 2019-2031
- 12.1. Market Analysis, Insights and Forecast - By Country/Sub-region
- 12.1.1 Germany
- 12.1.2 United Kingdom
- 12.1.3 Italy
- 12.1.4 Spain
- 12.1.5 France
- 12.1.6 Russia
- 12.1.7 Rest of Europe
- 13. Asia Pacific Ready to Drink Beverages Market Analysis, Insights and Forecast, 2019-2031
- 13.1. Market Analysis, Insights and Forecast - By Country/Sub-region
- 13.1.1 China
- 13.1.2 Japan
- 13.1.3 India
- 13.1.4 Australia
- 13.1.5 Rest of Asia Pacific
- 14. South America Ready to Drink Beverages Market Analysis, Insights and Forecast, 2019-2031
- 14.1. Market Analysis, Insights and Forecast - By Country/Sub-region
- 14.1.1 Brazil
- 14.1.2 Argentina
- 14.1.3 Rest of South America
- 15. Middle East and Africa Ready to Drink Beverages Market Analysis, Insights and Forecast, 2019-2031
- 15.1. Market Analysis, Insights and Forecast - By Country/Sub-region
- 15.1.1 South Africa
- 15.1.2 Saudi Arabia
- 15.1.3 Rest of Middle East and Africa
- 16. Competitive Analysis
- 16.1. Global Market Share Analysis 2024
- 16.2. Company Profiles
- 16.2.1 Nestle SA
- 16.2.1.1. Overview
- 16.2.1.2. Products
- 16.2.1.3. SWOT Analysis
- 16.2.1.4. Recent Developments
- 16.2.1.5. Financials (Based on Availability)
- 16.2.2 Dabur India Limited*List Not Exhaustive
- 16.2.2.1. Overview
- 16.2.2.2. Products
- 16.2.2.3. SWOT Analysis
- 16.2.2.4. Recent Developments
- 16.2.2.5. Financials (Based on Availability)
- 16.2.3 Monster Beverage Corporation
- 16.2.3.1. Overview
- 16.2.3.2. Products
- 16.2.3.3. SWOT Analysis
- 16.2.3.4. Recent Developments
- 16.2.3.5. Financials (Based on Availability)
- 16.2.4 Yakult Honsha Co Ltd
- 16.2.4.1. Overview
- 16.2.4.2. Products
- 16.2.4.3. SWOT Analysis
- 16.2.4.4. Recent Developments
- 16.2.4.5. Financials (Based on Availability)
- 16.2.5 Pepsico Inc
- 16.2.5.1. Overview
- 16.2.5.2. Products
- 16.2.5.3. SWOT Analysis
- 16.2.5.4. Recent Developments
- 16.2.5.5. Financials (Based on Availability)
- 16.2.6 Danone SA
- 16.2.6.1. Overview
- 16.2.6.2. Products
- 16.2.6.3. SWOT Analysis
- 16.2.6.4. Recent Developments
- 16.2.6.5. Financials (Based on Availability)
- 16.2.7 Suntory Holdings Limited
- 16.2.7.1. Overview
- 16.2.7.2. Products
- 16.2.7.3. SWOT Analysis
- 16.2.7.4. Recent Developments
- 16.2.7.5. Financials (Based on Availability)
- 16.2.8 Red Bull GmbH
- 16.2.8.1. Overview
- 16.2.8.2. Products
- 16.2.8.3. SWOT Analysis
- 16.2.8.4. Recent Developments
- 16.2.8.5. Financials (Based on Availability)
- 16.2.9 Blue Diamond Growers
- 16.2.9.1. Overview
- 16.2.9.2. Products
- 16.2.9.3. SWOT Analysis
- 16.2.9.4. Recent Developments
- 16.2.9.5. Financials (Based on Availability)
- 16.2.10 The Coca-Cola Company
- 16.2.10.1. Overview
- 16.2.10.2. Products
- 16.2.10.3. SWOT Analysis
- 16.2.10.4. Recent Developments
- 16.2.10.5. Financials (Based on Availability)
- 16.2.1 Nestle SA
List of Figures
- Figure 1: Global Ready to Drink Beverages Market Revenue Breakdown (Million, %) by Region 2024 & 2032
- Figure 2: North America Ready to Drink Beverages Market Revenue (Million), by Country 2024 & 2032
- Figure 3: North America Ready to Drink Beverages Market Revenue Share (%), by Country 2024 & 2032
- Figure 4: Europe Ready to Drink Beverages Market Revenue (Million), by Country 2024 & 2032
- Figure 5: Europe Ready to Drink Beverages Market Revenue Share (%), by Country 2024 & 2032
- Figure 6: Asia Pacific Ready to Drink Beverages Market Revenue (Million), by Country 2024 & 2032
- Figure 7: Asia Pacific Ready to Drink Beverages Market Revenue Share (%), by Country 2024 & 2032
- Figure 8: South America Ready to Drink Beverages Market Revenue (Million), by Country 2024 & 2032
- Figure 9: South America Ready to Drink Beverages Market Revenue Share (%), by Country 2024 & 2032
- Figure 10: Middle East and Africa Ready to Drink Beverages Market Revenue (Million), by Country 2024 & 2032
- Figure 11: Middle East and Africa Ready to Drink Beverages Market Revenue Share (%), by Country 2024 & 2032
- Figure 12: North America Ready to Drink Beverages Market Revenue (Million), by Product Type 2024 & 2032
- Figure 13: North America Ready to Drink Beverages Market Revenue Share (%), by Product Type 2024 & 2032
- Figure 14: North America Ready to Drink Beverages Market Revenue (Million), by Distribution Channel 2024 & 2032
- Figure 15: North America Ready to Drink Beverages Market Revenue Share (%), by Distribution Channel 2024 & 2032
- Figure 16: North America Ready to Drink Beverages Market Revenue (Million), by Country 2024 & 2032
- Figure 17: North America Ready to Drink Beverages Market Revenue Share (%), by Country 2024 & 2032
- Figure 18: Europe Ready to Drink Beverages Market Revenue (Million), by Product Type 2024 & 2032
- Figure 19: Europe Ready to Drink Beverages Market Revenue Share (%), by Product Type 2024 & 2032
- Figure 20: Europe Ready to Drink Beverages Market Revenue (Million), by Distribution Channel 2024 & 2032
- Figure 21: Europe Ready to Drink Beverages Market Revenue Share (%), by Distribution Channel 2024 & 2032
- Figure 22: Europe Ready to Drink Beverages Market Revenue (Million), by Country 2024 & 2032
- Figure 23: Europe Ready to Drink Beverages Market Revenue Share (%), by Country 2024 & 2032
- Figure 24: Asia Pacific Ready to Drink Beverages Market Revenue (Million), by Product Type 2024 & 2032
- Figure 25: Asia Pacific Ready to Drink Beverages Market Revenue Share (%), by Product Type 2024 & 2032
- Figure 26: Asia Pacific Ready to Drink Beverages Market Revenue (Million), by Distribution Channel 2024 & 2032
- Figure 27: Asia Pacific Ready to Drink Beverages Market Revenue Share (%), by Distribution Channel 2024 & 2032
- Figure 28: Asia Pacific Ready to Drink Beverages Market Revenue (Million), by Country 2024 & 2032
- Figure 29: Asia Pacific Ready to Drink Beverages Market Revenue Share (%), by Country 2024 & 2032
- Figure 30: South America Ready to Drink Beverages Market Revenue (Million), by Product Type 2024 & 2032
- Figure 31: South America Ready to Drink Beverages Market Revenue Share (%), by Product Type 2024 & 2032
- Figure 32: South America Ready to Drink Beverages Market Revenue (Million), by Distribution Channel 2024 & 2032
- Figure 33: South America Ready to Drink Beverages Market Revenue Share (%), by Distribution Channel 2024 & 2032
- Figure 34: South America Ready to Drink Beverages Market Revenue (Million), by Country 2024 & 2032
- Figure 35: South America Ready to Drink Beverages Market Revenue Share (%), by Country 2024 & 2032
- Figure 36: Middle East and Africa Ready to Drink Beverages Market Revenue (Million), by Product Type 2024 & 2032
- Figure 37: Middle East and Africa Ready to Drink Beverages Market Revenue Share (%), by Product Type 2024 & 2032
- Figure 38: Middle East and Africa Ready to Drink Beverages Market Revenue (Million), by Distribution Channel 2024 & 2032
- Figure 39: Middle East and Africa Ready to Drink Beverages Market Revenue Share (%), by Distribution Channel 2024 & 2032
- Figure 40: Middle East and Africa Ready to Drink Beverages Market Revenue (Million), by Country 2024 & 2032
- Figure 41: Middle East and Africa Ready to Drink Beverages Market Revenue Share (%), by Country 2024 & 2032
List of Tables
- Table 1: Global Ready to Drink Beverages Market Revenue Million Forecast, by Region 2019 & 2032
- Table 2: Global Ready to Drink Beverages Market Revenue Million Forecast, by Product Type 2019 & 2032
- Table 3: Global Ready to Drink Beverages Market Revenue Million Forecast, by Distribution Channel 2019 & 2032
- Table 4: Global Ready to Drink Beverages Market Revenue Million Forecast, by Region 2019 & 2032
- Table 5: Global Ready to Drink Beverages Market Revenue Million Forecast, by Country 2019 & 2032
- Table 6: United States Ready to Drink Beverages Market Revenue (Million) Forecast, by Application 2019 & 2032
- Table 7: Canada Ready to Drink Beverages Market Revenue (Million) Forecast, by Application 2019 & 2032
- Table 8: Mexico Ready to Drink Beverages Market Revenue (Million) Forecast, by Application 2019 & 2032
- Table 9: Rest of North America Ready to Drink Beverages Market Revenue (Million) Forecast, by Application 2019 & 2032
- Table 10: Global Ready to Drink Beverages Market Revenue Million Forecast, by Country 2019 & 2032
- Table 11: Germany Ready to Drink Beverages Market Revenue (Million) Forecast, by Application 2019 & 2032
- Table 12: United Kingdom Ready to Drink Beverages Market Revenue (Million) Forecast, by Application 2019 & 2032
- Table 13: Italy Ready to Drink Beverages Market Revenue (Million) Forecast, by Application 2019 & 2032
- Table 14: Spain Ready to Drink Beverages Market Revenue (Million) Forecast, by Application 2019 & 2032
- Table 15: France Ready to Drink Beverages Market Revenue (Million) Forecast, by Application 2019 & 2032
- Table 16: Russia Ready to Drink Beverages Market Revenue (Million) Forecast, by Application 2019 & 2032
- Table 17: Rest of Europe Ready to Drink Beverages Market Revenue (Million) Forecast, by Application 2019 & 2032
- Table 18: Global Ready to Drink Beverages Market Revenue Million Forecast, by Country 2019 & 2032
- Table 19: China Ready to Drink Beverages Market Revenue (Million) Forecast, by Application 2019 & 2032
- Table 20: Japan Ready to Drink Beverages Market Revenue (Million) Forecast, by Application 2019 & 2032
- Table 21: India Ready to Drink Beverages Market Revenue (Million) Forecast, by Application 2019 & 2032
- Table 22: Australia Ready to Drink Beverages Market Revenue (Million) Forecast, by Application 2019 & 2032
- Table 23: Rest of Asia Pacific Ready to Drink Beverages Market Revenue (Million) Forecast, by Application 2019 & 2032
- Table 24: Global Ready to Drink Beverages Market Revenue Million Forecast, by Country 2019 & 2032
- Table 25: Brazil Ready to Drink Beverages Market Revenue (Million) Forecast, by Application 2019 & 2032
- Table 26: Argentina Ready to Drink Beverages Market Revenue (Million) Forecast, by Application 2019 & 2032
- Table 27: Rest of South America Ready to Drink Beverages Market Revenue (Million) Forecast, by Application 2019 & 2032
- Table 28: Global Ready to Drink Beverages Market Revenue Million Forecast, by Country 2019 & 2032
- Table 29: South Africa Ready to Drink Beverages Market Revenue (Million) Forecast, by Application 2019 & 2032
- Table 30: Saudi Arabia Ready to Drink Beverages Market Revenue (Million) Forecast, by Application 2019 & 2032
- Table 31: Rest of Middle East and Africa Ready to Drink Beverages Market Revenue (Million) Forecast, by Application 2019 & 2032
- Table 32: Global Ready to Drink Beverages Market Revenue Million Forecast, by Product Type 2019 & 2032
- Table 33: Global Ready to Drink Beverages Market Revenue Million Forecast, by Distribution Channel 2019 & 2032
- Table 34: Global Ready to Drink Beverages Market Revenue Million Forecast, by Country 2019 & 2032
- Table 35: United States Ready to Drink Beverages Market Revenue (Million) Forecast, by Application 2019 & 2032
- Table 36: Canada Ready to Drink Beverages Market Revenue (Million) Forecast, by Application 2019 & 2032
- Table 37: Mexico Ready to Drink Beverages Market Revenue (Million) Forecast, by Application 2019 & 2032
- Table 38: Rest of North America Ready to Drink Beverages Market Revenue (Million) Forecast, by Application 2019 & 2032
- Table 39: Global Ready to Drink Beverages Market Revenue Million Forecast, by Product Type 2019 & 2032
- Table 40: Global Ready to Drink Beverages Market Revenue Million Forecast, by Distribution Channel 2019 & 2032
- Table 41: Global Ready to Drink Beverages Market Revenue Million Forecast, by Country 2019 & 2032
- Table 42: Germany Ready to Drink Beverages Market Revenue (Million) Forecast, by Application 2019 & 2032
- Table 43: United Kingdom Ready to Drink Beverages Market Revenue (Million) Forecast, by Application 2019 & 2032
- Table 44: Italy Ready to Drink Beverages Market Revenue (Million) Forecast, by Application 2019 & 2032
- Table 45: Spain Ready to Drink Beverages Market Revenue (Million) Forecast, by Application 2019 & 2032
- Table 46: France Ready to Drink Beverages Market Revenue (Million) Forecast, by Application 2019 & 2032
- Table 47: Russia Ready to Drink Beverages Market Revenue (Million) Forecast, by Application 2019 & 2032
- Table 48: Rest of Europe Ready to Drink Beverages Market Revenue (Million) Forecast, by Application 2019 & 2032
- Table 49: Global Ready to Drink Beverages Market Revenue Million Forecast, by Product Type 2019 & 2032
- Table 50: Global Ready to Drink Beverages Market Revenue Million Forecast, by Distribution Channel 2019 & 2032
- Table 51: Global Ready to Drink Beverages Market Revenue Million Forecast, by Country 2019 & 2032
- Table 52: China Ready to Drink Beverages Market Revenue (Million) Forecast, by Application 2019 & 2032
- Table 53: Japan Ready to Drink Beverages Market Revenue (Million) Forecast, by Application 2019 & 2032
- Table 54: India Ready to Drink Beverages Market Revenue (Million) Forecast, by Application 2019 & 2032
- Table 55: Australia Ready to Drink Beverages Market Revenue (Million) Forecast, by Application 2019 & 2032
- Table 56: Rest of Asia Pacific Ready to Drink Beverages Market Revenue (Million) Forecast, by Application 2019 & 2032
- Table 57: Global Ready to Drink Beverages Market Revenue Million Forecast, by Product Type 2019 & 2032
- Table 58: Global Ready to Drink Beverages Market Revenue Million Forecast, by Distribution Channel 2019 & 2032
- Table 59: Global Ready to Drink Beverages Market Revenue Million Forecast, by Country 2019 & 2032
- Table 60: Brazil Ready to Drink Beverages Market Revenue (Million) Forecast, by Application 2019 & 2032
- Table 61: Argentina Ready to Drink Beverages Market Revenue (Million) Forecast, by Application 2019 & 2032
- Table 62: Rest of South America Ready to Drink Beverages Market Revenue (Million) Forecast, by Application 2019 & 2032
- Table 63: Global Ready to Drink Beverages Market Revenue Million Forecast, by Product Type 2019 & 2032
- Table 64: Global Ready to Drink Beverages Market Revenue Million Forecast, by Distribution Channel 2019 & 2032
- Table 65: Global Ready to Drink Beverages Market Revenue Million Forecast, by Country 2019 & 2032
- Table 66: South Africa Ready to Drink Beverages Market Revenue (Million) Forecast, by Application 2019 & 2032
- Table 67: Saudi Arabia Ready to Drink Beverages Market Revenue (Million) Forecast, by Application 2019 & 2032
- Table 68: Rest of Middle East and Africa Ready to Drink Beverages Market Revenue (Million) Forecast, by Application 2019 & 2032
Frequently Asked Questions
1. What is the projected Compound Annual Growth Rate (CAGR) of the Ready to Drink Beverages Market?
The projected CAGR is approximately 4.81%.
2. Which companies are prominent players in the Ready to Drink Beverages Market?
Key companies in the market include Nestle SA, Dabur India Limited*List Not Exhaustive, Monster Beverage Corporation, Yakult Honsha Co Ltd, Pepsico Inc, Danone SA, Suntory Holdings Limited, Red Bull GmbH, Blue Diamond Growers, The Coca-Cola Company.
3. What are the main segments of the Ready to Drink Beverages Market?
The market segments include Product Type, Distribution Channel.
4. Can you provide details about the market size?
The market size is estimated to be USD 361.01 Million as of 2022.
5. What are some drivers contributing to market growth?
Inclination Toward Low-Sugar/Sugar-free Beverages.
6. What are the notable trends driving market growth?
Augmented Expenditure on Advertisement and Promotional Activities Impel Market Growth.
7. Are there any restraints impacting market growth?
Concerns Over Health Issues Associated with Functional Beverages.
8. Can you provide examples of recent developments in the market?
February 2023: Pepsi Co. launched marshmallow-flavored Cola in partnership with Peeps. The pillowy-soft marshmallow cola flavor, paired with the instantly recognizable PEEPS®, comes in vibrant yellow packaging.
9. What pricing options are available for accessing the report?
Pricing options include single-user, multi-user, and enterprise licenses priced at USD 4750, USD 5250, and USD 8750 respectively.
10. Is the market size provided in terms of value or volume?
The market size is provided in terms of value, measured in Million.
11. Are there any specific market keywords associated with the report?
Yes, the market keyword associated with the report is "Ready to Drink Beverages Market," which aids in identifying and referencing the specific market segment covered.
12. How do I determine which pricing option suits my needs best?
The pricing options vary based on user requirements and access needs. Individual users may opt for single-user licenses, while businesses requiring broader access may choose multi-user or enterprise licenses for cost-effective access to the report.
13. Are there any additional resources or data provided in the Ready to Drink Beverages Market report?
While the report offers comprehensive insights, it's advisable to review the specific contents or supplementary materials provided to ascertain if additional resources or data are available.
14. How can I stay updated on further developments or reports in the Ready to Drink Beverages Market?
To stay informed about further developments, trends, and reports in the Ready to Drink Beverages Market, consider subscribing to industry newsletters, following relevant companies and organizations, or regularly checking reputable industry news sources and publications.
Methodology
Step 1 - Identification of Relevant Samples Size from Population Database


Step 2 - Approaches for Defining Global Market Size (Value, Volume* & Price*)

Note*: In applicable scenarios
Step 3 - Data Sources
Primary Research
- Web Analytics
- Survey Reports
- Research Institute
- Latest Research Reports
- Opinion Leaders
Secondary Research
- Annual Reports
- White Paper
- Latest Press Release
- Industry Association
- Paid Database
- Investor Presentations

Step 4 - Data Triangulation
Involves using different sources of information in order to increase the validity of a study
These sources are likely to be stakeholders in a program - participants, other researchers, program staff, other community members, and so on.
Then we put all data in single framework & apply various statistical tools to find out the dynamic on the market.
During the analysis stage, feedback from the stakeholder groups would be compared to determine areas of agreement as well as areas of divergence
