

Key Insights
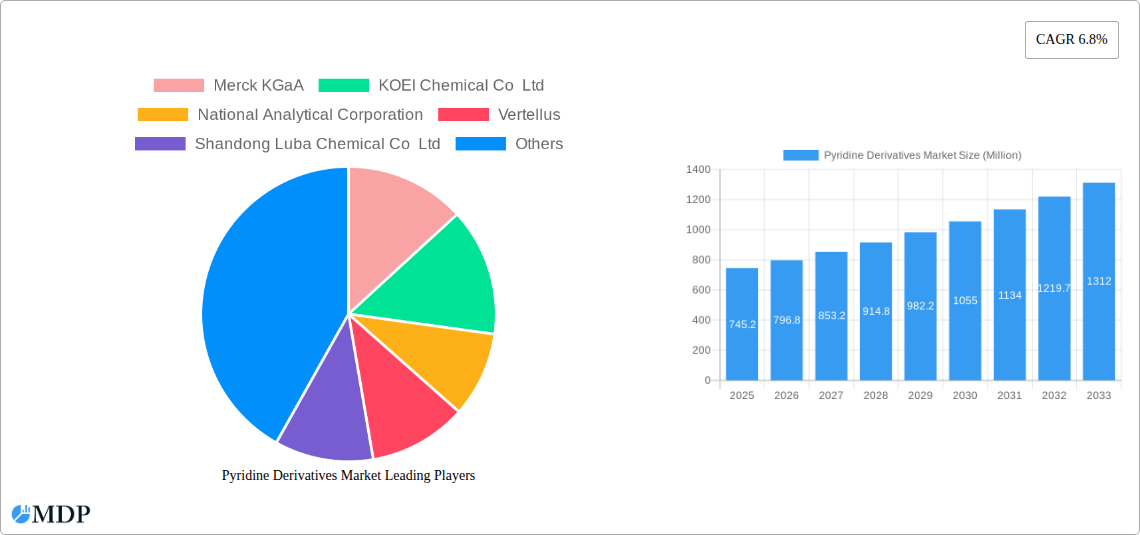
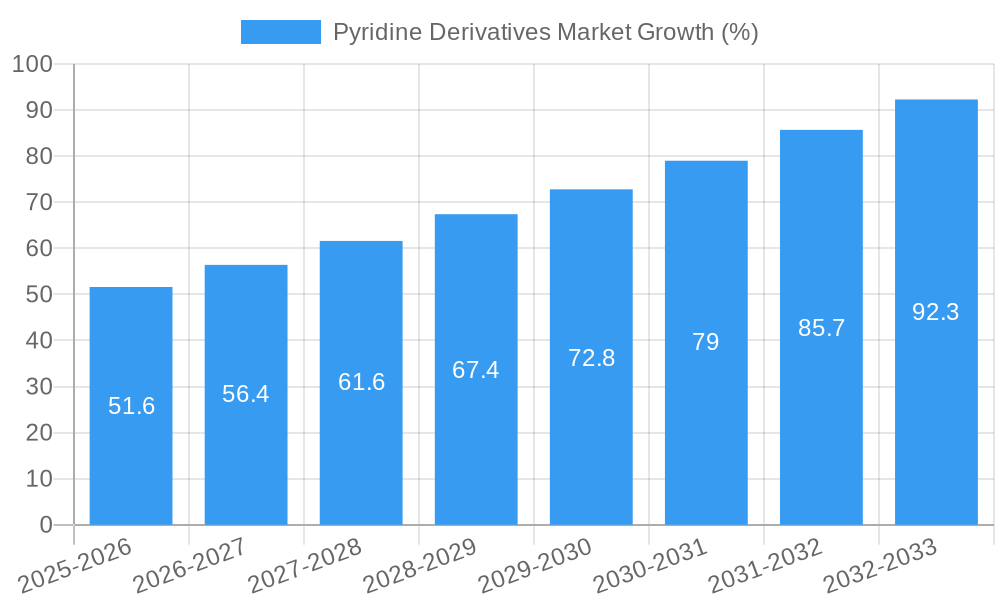
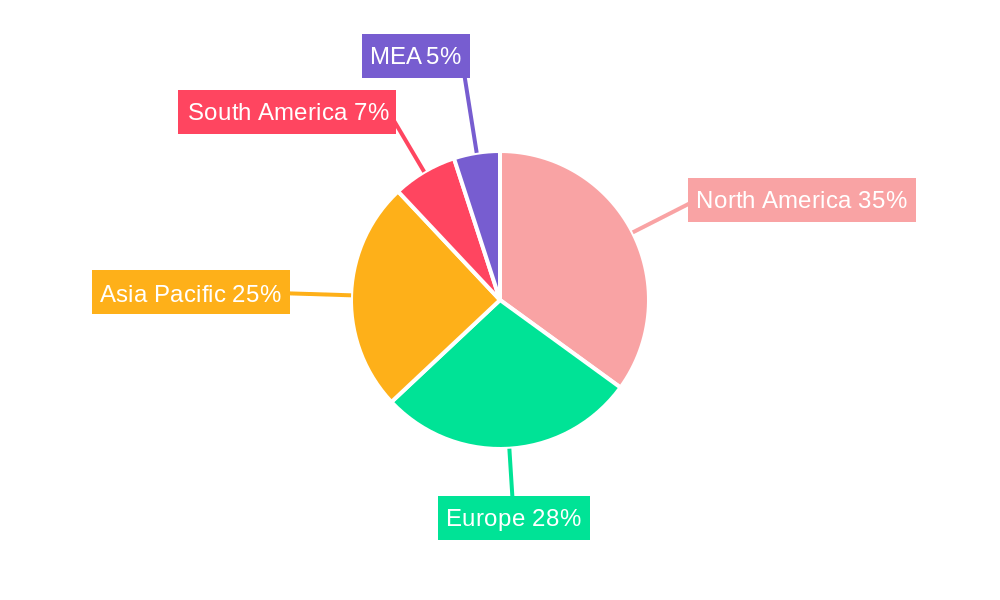
The Pyridine Derivatives market, valued at $745.2 million in 2025, is projected to experience robust growth, driven by increasing demand from key end-use industries. A Compound Annual Growth Rate (CAGR) of 6.8% from 2025 to 2033 indicates a significant expansion, reaching an estimated $1,300 million by 2033. This growth is fueled by several factors. The agrochemical sector's reliance on pyridine derivatives as herbicides and pesticides is a major contributor. Pharmaceutical applications, utilizing these compounds in drug synthesis, further bolster market demand. The electronics industry's use in specialized materials and the textile industry's application in dyes and coatings also contribute to market expansion. While specific restraints aren't detailed, potential challenges could include stringent environmental regulations on chemical usage and the development of alternative, more sustainable compounds. Market segmentation reveals that Beta Picoline, Alpha Picoline, and Gamma Picoline are the dominant types, with their individual market shares influenced by specific application needs within each end-use industry. Geographic distribution shows a strong presence in North America and Asia-Pacific, driven by established manufacturing bases and substantial end-user industries in these regions. Growth in emerging economies within Asia-Pacific, particularly India and China, is expected to further drive market expansion in the coming years. Competition is moderate, with key players such as Merck KGaA, KOEI Chemical Co Ltd, and Vertellus actively involved in production and innovation. Future growth will likely be shaped by technological advancements leading to more efficient and sustainable production methods, as well as the development of novel pyridine derivative applications in emerging sectors.
The diverse applications of pyridine derivatives across various sectors, coupled with the consistent demand from established industries, makes this market attractive for both existing and new players. Strategic partnerships, research and development initiatives, and expansion into new geographical markets will be crucial factors in determining market share and overall success. The focus on sustainability and the development of eco-friendly alternatives will also play a crucial role in shaping the future trajectory of the Pyridine Derivatives market. Understanding the specific regional dynamics and regulatory landscape will be critical for companies seeking to capitalize on this growth opportunity. Continuous innovation and adaptation to evolving industry needs will be key to maintaining a competitive edge within this dynamic market.
Pyridine Derivatives Market: A Comprehensive Report (2019-2033)
This comprehensive report offers a detailed analysis of the Pyridine Derivatives market, providing invaluable insights for industry stakeholders, investors, and strategic decision-makers. Covering the period from 2019 to 2033, with a base year of 2025 and a forecast period from 2025 to 2033, this report meticulously examines market dynamics, trends, leading players, and future growth potential. The market is segmented by Type (Beta Picoline, Alpha Picoline, Gamma Picoline, Other Types) and End-user Industry (Agrochemicals, Pharmaceuticals, Electronics, Textiles, Other End-user Industries). The estimated market value in 2025 is expected to reach XX Million.
Pyridine Derivatives Market Market Dynamics & Concentration
The Pyridine Derivatives market exhibits a moderately concentrated landscape, with key players holding significant market share. Market concentration is influenced by factors such as economies of scale in production, strong R&D capabilities, and established distribution networks. Innovation plays a crucial role, driving the development of new applications and improved product performance. Stringent regulatory frameworks related to chemical safety and environmental protection significantly impact market dynamics, requiring companies to adhere to specific standards. Product substitutes, while limited, pose a potential challenge, necessitating continuous innovation to maintain competitiveness. End-user trends, particularly in the pharmaceutical and agrochemical sectors, significantly drive demand for pyridine derivatives. Mergers and acquisitions (M&A) activities have played a role in shaping the market landscape, with an estimated XX M&A deals occurring between 2019 and 2024. Major players have focused on strategic acquisitions to expand their product portfolios and market reach. For example, the market share of Merck KGaA is estimated at xx% in 2025.
- Market Concentration: Moderately concentrated
- Innovation Drivers: New applications, improved performance
- Regulatory Frameworks: Stringent safety and environmental standards
- Product Substitutes: Limited, but emerging
- End-user Trends: Growing demand from pharmaceuticals and agrochemicals
- M&A Activities: XX deals (2019-2024)
Pyridine Derivatives Market Industry Trends & Analysis
The Pyridine Derivatives market is projected to witness a Compound Annual Growth Rate (CAGR) of XX% during the forecast period (2025-2033). Several factors contribute to this growth, including the increasing demand for pyridine derivatives in various applications. Technological advancements in synthesis methods and purification techniques are improving product quality and efficiency. Changing consumer preferences, particularly a growing emphasis on sustainable and eco-friendly products, are influencing market demand. Intense competition among established players necessitates continuous innovation and cost optimization. Market penetration in emerging economies presents significant growth opportunities. The increasing adoption of pyridine derivatives in the agrochemical industry, driven by the need for high-yield crops and pest control, is a major growth driver.
Leading Markets & Segments in Pyridine Derivatives Market
The Pharmaceutical segment is projected to be the leading end-user industry for pyridine derivatives, driven by its extensive use in the production of various pharmaceuticals. Geographically, the Asia-Pacific region is expected to dominate the market due to rapid economic growth, increasing industrialization, and expanding pharmaceutical and agrochemical sectors. Within the types of pyridine derivatives, Alpha Picoline is anticipated to hold the largest market share owing to its wide range of applications.
- Key Drivers of Pharmaceutical Dominance: High demand for pharmaceuticals, increasing research and development activity.
- Key Drivers of Asia-Pacific Regional Dominance: Rapid economic growth, expanding industrial sector, rising disposable incomes.
- Key Drivers of Alpha Picoline Segment Dominance: Versatility in applications, cost-effectiveness, availability.
Pyridine Derivatives Market Product Developments
Recent years have witnessed significant advancements in the production and application of pyridine derivatives. New synthesis methods offer improved efficiency and reduced environmental impact. Innovations focus on developing specialized pyridine derivatives with enhanced properties for specific applications, such as higher efficacy in agrochemicals or improved biocompatibility in pharmaceuticals. The market is witnessing an increasing focus on biodegradable and sustainable pyridine derivatives to meet growing environmental concerns.
Key Drivers of Pyridine Derivatives Market Growth
The Pyridine Derivatives market's growth is driven by several factors, including:
- Technological advancements: Improved synthesis methods and purification techniques.
- Rising demand from pharmaceuticals and agrochemicals: Increased production of medicines and crop protection products.
- Expanding applications: Growth in electronics, textiles, and other end-user industries.
Challenges in the Pyridine Derivatives Market Market
The market faces certain challenges, including:
- Stringent regulatory compliance: Meeting safety and environmental standards.
- Fluctuations in raw material prices: Affecting production costs.
- Intense competition: Pressure on pricing and margins.
Emerging Opportunities in Pyridine Derivatives Market
Emerging opportunities lie in developing specialized pyridine derivatives for niche applications, such as in advanced materials and nanotechnology. Strategic partnerships and collaborations between manufacturers and end-user industries can unlock new growth avenues. Expansion into new markets, particularly in developing economies, presents significant potential. Furthermore, research into sustainable and biodegradable pyridine derivatives will drive future growth.
Leading Players in the Pyridine Derivatives Market Sector
- Merck KGaA
- KOEI Chemical Co Ltd
- National Analytical Corporation
- Vertellus
- Shandong Luba Chemical Co Ltd
- Alfa Aesar
- Lonza
- Resonance Specialties Limited
- Jubilant Life Sciences Limited
Key Milestones in Pyridine Derivatives Market Industry
- May 2020: Trineso acquired the vinyl pyridine latex business from Synthomer PLC, expanding its product portfolio.
Strategic Outlook for Pyridine Derivatives Market Market
The Pyridine Derivatives market is poised for continued growth, driven by technological advancements, expanding applications, and increasing demand from key end-user industries. Strategic partnerships, investments in R&D, and a focus on sustainable practices will be crucial for success in this dynamic market. Companies that can effectively adapt to evolving regulations and consumer preferences will be best positioned to capitalize on future opportunities.
Pyridine Derivatives Market Segmentation
-
1. Type
- 1.1. Beta Picoline
- 1.2. Alpha Picoline
- 1.3. Gamma Picoline
- 1.4. Other Types
-
2. End-user Industry
- 2.1. Agrochemicals
- 2.2. Pharmaceuticals
- 2.3. Electronics
- 2.4. Textiles
- 2.5. Other End-user Industries
Pyridine Derivatives Market Segmentation By Geography
-
1. Asia Pacific
- 1.1. China
- 1.2. India
- 1.3. Japan
- 1.4. South Korea
- 1.5. Rest of Asia Pacific
-
2. North America
- 2.1. United States
- 2.2. Canada
- 2.3. Mexico
-
3. Europe
- 3.1. Germany
- 3.2. United Kingdom
- 3.3. France
- 3.4. Italy
- 3.5. Rest of Europe
-
4. South America
- 4.1. Brazil
- 4.2. Argentina
- 4.3. Rest of South America
-
5. Middle East and Africa
- 5.1. Saudi Arabia
- 5.2. South Africa
- 5.3. Rest of Middle East and Africa
Pyridine Derivatives Market REPORT HIGHLIGHTS
| Aspects | Details |
|---|---|
| Study Period | 2019-2033 |
| Base Year | 2024 |
| Estimated Year | 2025 |
| Forecast Period | 2025-2033 |
| Historical Period | 2019-2024 |
| Growth Rate | CAGR of 6.8% from 2019-2033 |
| Segmentation |
|
Table of Contents
- 1. Introduction
- 1.1. Research Scope
- 1.2. Market Segmentation
- 1.3. Research Methodology
- 1.4. Definitions and Assumptions
- 2. Executive Summary
- 2.1. Introduction
- 3. Market Dynamics
- 3.1. Introduction
- 3.2. Market Drivers
- 3.2.1. Increasing Demand for Beta Picoline in Various Applications; Other Drivers
- 3.3. Market Restrains
- 3.3.1. Adverse Impact on Market Due to the COVID-19 Pandemic; Other Restraints
- 3.4. Market Trends
- 3.4.1. Increasing Demand for Beta Picoline
- 4. Market Factor Analysis
- 4.1. Porters Five Forces
- 4.2. Supply/Value Chain
- 4.3. PESTEL analysis
- 4.4. Market Entropy
- 4.5. Patent/Trademark Analysis
- 5. Global Pyridine Derivatives Market Analysis, Insights and Forecast, 2019-2031
- 5.1. Market Analysis, Insights and Forecast - by Type
- 5.1.1. Beta Picoline
- 5.1.2. Alpha Picoline
- 5.1.3. Gamma Picoline
- 5.1.4. Other Types
- 5.2. Market Analysis, Insights and Forecast - by End-user Industry
- 5.2.1. Agrochemicals
- 5.2.2. Pharmaceuticals
- 5.2.3. Electronics
- 5.2.4. Textiles
- 5.2.5. Other End-user Industries
- 5.3. Market Analysis, Insights and Forecast - by Region
- 5.3.1. Asia Pacific
- 5.3.2. North America
- 5.3.3. Europe
- 5.3.4. South America
- 5.3.5. Middle East and Africa
- 5.1. Market Analysis, Insights and Forecast - by Type
- 6. Asia Pacific Pyridine Derivatives Market Analysis, Insights and Forecast, 2019-2031
- 6.1. Market Analysis, Insights and Forecast - by Type
- 6.1.1. Beta Picoline
- 6.1.2. Alpha Picoline
- 6.1.3. Gamma Picoline
- 6.1.4. Other Types
- 6.2. Market Analysis, Insights and Forecast - by End-user Industry
- 6.2.1. Agrochemicals
- 6.2.2. Pharmaceuticals
- 6.2.3. Electronics
- 6.2.4. Textiles
- 6.2.5. Other End-user Industries
- 6.1. Market Analysis, Insights and Forecast - by Type
- 7. North America Pyridine Derivatives Market Analysis, Insights and Forecast, 2019-2031
- 7.1. Market Analysis, Insights and Forecast - by Type
- 7.1.1. Beta Picoline
- 7.1.2. Alpha Picoline
- 7.1.3. Gamma Picoline
- 7.1.4. Other Types
- 7.2. Market Analysis, Insights and Forecast - by End-user Industry
- 7.2.1. Agrochemicals
- 7.2.2. Pharmaceuticals
- 7.2.3. Electronics
- 7.2.4. Textiles
- 7.2.5. Other End-user Industries
- 7.1. Market Analysis, Insights and Forecast - by Type
- 8. Europe Pyridine Derivatives Market Analysis, Insights and Forecast, 2019-2031
- 8.1. Market Analysis, Insights and Forecast - by Type
- 8.1.1. Beta Picoline
- 8.1.2. Alpha Picoline
- 8.1.3. Gamma Picoline
- 8.1.4. Other Types
- 8.2. Market Analysis, Insights and Forecast - by End-user Industry
- 8.2.1. Agrochemicals
- 8.2.2. Pharmaceuticals
- 8.2.3. Electronics
- 8.2.4. Textiles
- 8.2.5. Other End-user Industries
- 8.1. Market Analysis, Insights and Forecast - by Type
- 9. South America Pyridine Derivatives Market Analysis, Insights and Forecast, 2019-2031
- 9.1. Market Analysis, Insights and Forecast - by Type
- 9.1.1. Beta Picoline
- 9.1.2. Alpha Picoline
- 9.1.3. Gamma Picoline
- 9.1.4. Other Types
- 9.2. Market Analysis, Insights and Forecast - by End-user Industry
- 9.2.1. Agrochemicals
- 9.2.2. Pharmaceuticals
- 9.2.3. Electronics
- 9.2.4. Textiles
- 9.2.5. Other End-user Industries
- 9.1. Market Analysis, Insights and Forecast - by Type
- 10. Middle East and Africa Pyridine Derivatives Market Analysis, Insights and Forecast, 2019-2031
- 10.1. Market Analysis, Insights and Forecast - by Type
- 10.1.1. Beta Picoline
- 10.1.2. Alpha Picoline
- 10.1.3. Gamma Picoline
- 10.1.4. Other Types
- 10.2. Market Analysis, Insights and Forecast - by End-user Industry
- 10.2.1. Agrochemicals
- 10.2.2. Pharmaceuticals
- 10.2.3. Electronics
- 10.2.4. Textiles
- 10.2.5. Other End-user Industries
- 10.1. Market Analysis, Insights and Forecast - by Type
- 11. North America Pyridine Derivatives Market Analysis, Insights and Forecast, 2019-2031
- 11.1. Market Analysis, Insights and Forecast - By Country/Sub-region
- 11.1.1 United States
- 11.1.2 Canada
- 11.1.3 Mexico
- 12. Europe Pyridine Derivatives Market Analysis, Insights and Forecast, 2019-2031
- 12.1. Market Analysis, Insights and Forecast - By Country/Sub-region
- 12.1.1 Germany
- 12.1.2 France
- 12.1.3 Italy
- 12.1.4 United Kingdom
- 12.1.5 Netherlands
- 12.1.6 Rest of Europe
- 13. Asia Pacific Pyridine Derivatives Market Analysis, Insights and Forecast, 2019-2031
- 13.1. Market Analysis, Insights and Forecast - By Country/Sub-region
- 13.1.1 China
- 13.1.2 Japan
- 13.1.3 India
- 13.1.4 South Korea
- 13.1.5 Taiwan
- 13.1.6 Australia
- 13.1.7 Rest of Asia-Pacific
- 14. South America Pyridine Derivatives Market Analysis, Insights and Forecast, 2019-2031
- 14.1. Market Analysis, Insights and Forecast - By Country/Sub-region
- 14.1.1 Brazil
- 14.1.2 Argentina
- 14.1.3 Rest of South America
- 15. MEA Pyridine Derivatives Market Analysis, Insights and Forecast, 2019-2031
- 15.1. Market Analysis, Insights and Forecast - By Country/Sub-region
- 15.1.1 Middle East
- 15.1.2 Africa
- 16. Competitive Analysis
- 16.1. Global Market Share Analysis 2024
- 16.2. Company Profiles
- 16.2.1 Merck KGaA
- 16.2.1.1. Overview
- 16.2.1.2. Products
- 16.2.1.3. SWOT Analysis
- 16.2.1.4. Recent Developments
- 16.2.1.5. Financials (Based on Availability)
- 16.2.2 KOEI Chemical Co Ltd
- 16.2.2.1. Overview
- 16.2.2.2. Products
- 16.2.2.3. SWOT Analysis
- 16.2.2.4. Recent Developments
- 16.2.2.5. Financials (Based on Availability)
- 16.2.3 National Analytical Corporation
- 16.2.3.1. Overview
- 16.2.3.2. Products
- 16.2.3.3. SWOT Analysis
- 16.2.3.4. Recent Developments
- 16.2.3.5. Financials (Based on Availability)
- 16.2.4 Vertellus
- 16.2.4.1. Overview
- 16.2.4.2. Products
- 16.2.4.3. SWOT Analysis
- 16.2.4.4. Recent Developments
- 16.2.4.5. Financials (Based on Availability)
- 16.2.5 Shandong Luba Chemical Co Ltd
- 16.2.5.1. Overview
- 16.2.5.2. Products
- 16.2.5.3. SWOT Analysis
- 16.2.5.4. Recent Developments
- 16.2.5.5. Financials (Based on Availability)
- 16.2.6 Alfa Aesar
- 16.2.6.1. Overview
- 16.2.6.2. Products
- 16.2.6.3. SWOT Analysis
- 16.2.6.4. Recent Developments
- 16.2.6.5. Financials (Based on Availability)
- 16.2.7 Lonza
- 16.2.7.1. Overview
- 16.2.7.2. Products
- 16.2.7.3. SWOT Analysis
- 16.2.7.4. Recent Developments
- 16.2.7.5. Financials (Based on Availability)
- 16.2.8 Resonance Specialties Limited
- 16.2.8.1. Overview
- 16.2.8.2. Products
- 16.2.8.3. SWOT Analysis
- 16.2.8.4. Recent Developments
- 16.2.8.5. Financials (Based on Availability)
- 16.2.9 Jubilant Life Sciences Limited
- 16.2.9.1. Overview
- 16.2.9.2. Products
- 16.2.9.3. SWOT Analysis
- 16.2.9.4. Recent Developments
- 16.2.9.5. Financials (Based on Availability)
- 16.2.1 Merck KGaA
List of Figures
- Figure 1: Global Pyridine Derivatives Market Revenue Breakdown (Million, %) by Region 2024 & 2032
- Figure 2: Global Pyridine Derivatives Market Volume Breakdown (K Tons, %) by Region 2024 & 2032
- Figure 3: North America Pyridine Derivatives Market Revenue (Million), by Country 2024 & 2032
- Figure 4: North America Pyridine Derivatives Market Volume (K Tons), by Country 2024 & 2032
- Figure 5: North America Pyridine Derivatives Market Revenue Share (%), by Country 2024 & 2032
- Figure 6: North America Pyridine Derivatives Market Volume Share (%), by Country 2024 & 2032
- Figure 7: Europe Pyridine Derivatives Market Revenue (Million), by Country 2024 & 2032
- Figure 8: Europe Pyridine Derivatives Market Volume (K Tons), by Country 2024 & 2032
- Figure 9: Europe Pyridine Derivatives Market Revenue Share (%), by Country 2024 & 2032
- Figure 10: Europe Pyridine Derivatives Market Volume Share (%), by Country 2024 & 2032
- Figure 11: Asia Pacific Pyridine Derivatives Market Revenue (Million), by Country 2024 & 2032
- Figure 12: Asia Pacific Pyridine Derivatives Market Volume (K Tons), by Country 2024 & 2032
- Figure 13: Asia Pacific Pyridine Derivatives Market Revenue Share (%), by Country 2024 & 2032
- Figure 14: Asia Pacific Pyridine Derivatives Market Volume Share (%), by Country 2024 & 2032
- Figure 15: South America Pyridine Derivatives Market Revenue (Million), by Country 2024 & 2032
- Figure 16: South America Pyridine Derivatives Market Volume (K Tons), by Country 2024 & 2032
- Figure 17: South America Pyridine Derivatives Market Revenue Share (%), by Country 2024 & 2032
- Figure 18: South America Pyridine Derivatives Market Volume Share (%), by Country 2024 & 2032
- Figure 19: MEA Pyridine Derivatives Market Revenue (Million), by Country 2024 & 2032
- Figure 20: MEA Pyridine Derivatives Market Volume (K Tons), by Country 2024 & 2032
- Figure 21: MEA Pyridine Derivatives Market Revenue Share (%), by Country 2024 & 2032
- Figure 22: MEA Pyridine Derivatives Market Volume Share (%), by Country 2024 & 2032
- Figure 23: Asia Pacific Pyridine Derivatives Market Revenue (Million), by Type 2024 & 2032
- Figure 24: Asia Pacific Pyridine Derivatives Market Volume (K Tons), by Type 2024 & 2032
- Figure 25: Asia Pacific Pyridine Derivatives Market Revenue Share (%), by Type 2024 & 2032
- Figure 26: Asia Pacific Pyridine Derivatives Market Volume Share (%), by Type 2024 & 2032
- Figure 27: Asia Pacific Pyridine Derivatives Market Revenue (Million), by End-user Industry 2024 & 2032
- Figure 28: Asia Pacific Pyridine Derivatives Market Volume (K Tons), by End-user Industry 2024 & 2032
- Figure 29: Asia Pacific Pyridine Derivatives Market Revenue Share (%), by End-user Industry 2024 & 2032
- Figure 30: Asia Pacific Pyridine Derivatives Market Volume Share (%), by End-user Industry 2024 & 2032
- Figure 31: Asia Pacific Pyridine Derivatives Market Revenue (Million), by Country 2024 & 2032
- Figure 32: Asia Pacific Pyridine Derivatives Market Volume (K Tons), by Country 2024 & 2032
- Figure 33: Asia Pacific Pyridine Derivatives Market Revenue Share (%), by Country 2024 & 2032
- Figure 34: Asia Pacific Pyridine Derivatives Market Volume Share (%), by Country 2024 & 2032
- Figure 35: North America Pyridine Derivatives Market Revenue (Million), by Type 2024 & 2032
- Figure 36: North America Pyridine Derivatives Market Volume (K Tons), by Type 2024 & 2032
- Figure 37: North America Pyridine Derivatives Market Revenue Share (%), by Type 2024 & 2032
- Figure 38: North America Pyridine Derivatives Market Volume Share (%), by Type 2024 & 2032
- Figure 39: North America Pyridine Derivatives Market Revenue (Million), by End-user Industry 2024 & 2032
- Figure 40: North America Pyridine Derivatives Market Volume (K Tons), by End-user Industry 2024 & 2032
- Figure 41: North America Pyridine Derivatives Market Revenue Share (%), by End-user Industry 2024 & 2032
- Figure 42: North America Pyridine Derivatives Market Volume Share (%), by End-user Industry 2024 & 2032
- Figure 43: North America Pyridine Derivatives Market Revenue (Million), by Country 2024 & 2032
- Figure 44: North America Pyridine Derivatives Market Volume (K Tons), by Country 2024 & 2032
- Figure 45: North America Pyridine Derivatives Market Revenue Share (%), by Country 2024 & 2032
- Figure 46: North America Pyridine Derivatives Market Volume Share (%), by Country 2024 & 2032
- Figure 47: Europe Pyridine Derivatives Market Revenue (Million), by Type 2024 & 2032
- Figure 48: Europe Pyridine Derivatives Market Volume (K Tons), by Type 2024 & 2032
- Figure 49: Europe Pyridine Derivatives Market Revenue Share (%), by Type 2024 & 2032
- Figure 50: Europe Pyridine Derivatives Market Volume Share (%), by Type 2024 & 2032
- Figure 51: Europe Pyridine Derivatives Market Revenue (Million), by End-user Industry 2024 & 2032
- Figure 52: Europe Pyridine Derivatives Market Volume (K Tons), by End-user Industry 2024 & 2032
- Figure 53: Europe Pyridine Derivatives Market Revenue Share (%), by End-user Industry 2024 & 2032
- Figure 54: Europe Pyridine Derivatives Market Volume Share (%), by End-user Industry 2024 & 2032
- Figure 55: Europe Pyridine Derivatives Market Revenue (Million), by Country 2024 & 2032
- Figure 56: Europe Pyridine Derivatives Market Volume (K Tons), by Country 2024 & 2032
- Figure 57: Europe Pyridine Derivatives Market Revenue Share (%), by Country 2024 & 2032
- Figure 58: Europe Pyridine Derivatives Market Volume Share (%), by Country 2024 & 2032
- Figure 59: South America Pyridine Derivatives Market Revenue (Million), by Type 2024 & 2032
- Figure 60: South America Pyridine Derivatives Market Volume (K Tons), by Type 2024 & 2032
- Figure 61: South America Pyridine Derivatives Market Revenue Share (%), by Type 2024 & 2032
- Figure 62: South America Pyridine Derivatives Market Volume Share (%), by Type 2024 & 2032
- Figure 63: South America Pyridine Derivatives Market Revenue (Million), by End-user Industry 2024 & 2032
- Figure 64: South America Pyridine Derivatives Market Volume (K Tons), by End-user Industry 2024 & 2032
- Figure 65: South America Pyridine Derivatives Market Revenue Share (%), by End-user Industry 2024 & 2032
- Figure 66: South America Pyridine Derivatives Market Volume Share (%), by End-user Industry 2024 & 2032
- Figure 67: South America Pyridine Derivatives Market Revenue (Million), by Country 2024 & 2032
- Figure 68: South America Pyridine Derivatives Market Volume (K Tons), by Country 2024 & 2032
- Figure 69: South America Pyridine Derivatives Market Revenue Share (%), by Country 2024 & 2032
- Figure 70: South America Pyridine Derivatives Market Volume Share (%), by Country 2024 & 2032
- Figure 71: Middle East and Africa Pyridine Derivatives Market Revenue (Million), by Type 2024 & 2032
- Figure 72: Middle East and Africa Pyridine Derivatives Market Volume (K Tons), by Type 2024 & 2032
- Figure 73: Middle East and Africa Pyridine Derivatives Market Revenue Share (%), by Type 2024 & 2032
- Figure 74: Middle East and Africa Pyridine Derivatives Market Volume Share (%), by Type 2024 & 2032
- Figure 75: Middle East and Africa Pyridine Derivatives Market Revenue (Million), by End-user Industry 2024 & 2032
- Figure 76: Middle East and Africa Pyridine Derivatives Market Volume (K Tons), by End-user Industry 2024 & 2032
- Figure 77: Middle East and Africa Pyridine Derivatives Market Revenue Share (%), by End-user Industry 2024 & 2032
- Figure 78: Middle East and Africa Pyridine Derivatives Market Volume Share (%), by End-user Industry 2024 & 2032
- Figure 79: Middle East and Africa Pyridine Derivatives Market Revenue (Million), by Country 2024 & 2032
- Figure 80: Middle East and Africa Pyridine Derivatives Market Volume (K Tons), by Country 2024 & 2032
- Figure 81: Middle East and Africa Pyridine Derivatives Market Revenue Share (%), by Country 2024 & 2032
- Figure 82: Middle East and Africa Pyridine Derivatives Market Volume Share (%), by Country 2024 & 2032
List of Tables
- Table 1: Global Pyridine Derivatives Market Revenue Million Forecast, by Region 2019 & 2032
- Table 2: Global Pyridine Derivatives Market Volume K Tons Forecast, by Region 2019 & 2032
- Table 3: Global Pyridine Derivatives Market Revenue Million Forecast, by Type 2019 & 2032
- Table 4: Global Pyridine Derivatives Market Volume K Tons Forecast, by Type 2019 & 2032
- Table 5: Global Pyridine Derivatives Market Revenue Million Forecast, by End-user Industry 2019 & 2032
- Table 6: Global Pyridine Derivatives Market Volume K Tons Forecast, by End-user Industry 2019 & 2032
- Table 7: Global Pyridine Derivatives Market Revenue Million Forecast, by Region 2019 & 2032
- Table 8: Global Pyridine Derivatives Market Volume K Tons Forecast, by Region 2019 & 2032
- Table 9: Global Pyridine Derivatives Market Revenue Million Forecast, by Country 2019 & 2032
- Table 10: Global Pyridine Derivatives Market Volume K Tons Forecast, by Country 2019 & 2032
- Table 11: United States Pyridine Derivatives Market Revenue (Million) Forecast, by Application 2019 & 2032
- Table 12: United States Pyridine Derivatives Market Volume (K Tons) Forecast, by Application 2019 & 2032
- Table 13: Canada Pyridine Derivatives Market Revenue (Million) Forecast, by Application 2019 & 2032
- Table 14: Canada Pyridine Derivatives Market Volume (K Tons) Forecast, by Application 2019 & 2032
- Table 15: Mexico Pyridine Derivatives Market Revenue (Million) Forecast, by Application 2019 & 2032
- Table 16: Mexico Pyridine Derivatives Market Volume (K Tons) Forecast, by Application 2019 & 2032
- Table 17: Global Pyridine Derivatives Market Revenue Million Forecast, by Country 2019 & 2032
- Table 18: Global Pyridine Derivatives Market Volume K Tons Forecast, by Country 2019 & 2032
- Table 19: Germany Pyridine Derivatives Market Revenue (Million) Forecast, by Application 2019 & 2032
- Table 20: Germany Pyridine Derivatives Market Volume (K Tons) Forecast, by Application 2019 & 2032
- Table 21: France Pyridine Derivatives Market Revenue (Million) Forecast, by Application 2019 & 2032
- Table 22: France Pyridine Derivatives Market Volume (K Tons) Forecast, by Application 2019 & 2032
- Table 23: Italy Pyridine Derivatives Market Revenue (Million) Forecast, by Application 2019 & 2032
- Table 24: Italy Pyridine Derivatives Market Volume (K Tons) Forecast, by Application 2019 & 2032
- Table 25: United Kingdom Pyridine Derivatives Market Revenue (Million) Forecast, by Application 2019 & 2032
- Table 26: United Kingdom Pyridine Derivatives Market Volume (K Tons) Forecast, by Application 2019 & 2032
- Table 27: Netherlands Pyridine Derivatives Market Revenue (Million) Forecast, by Application 2019 & 2032
- Table 28: Netherlands Pyridine Derivatives Market Volume (K Tons) Forecast, by Application 2019 & 2032
- Table 29: Rest of Europe Pyridine Derivatives Market Revenue (Million) Forecast, by Application 2019 & 2032
- Table 30: Rest of Europe Pyridine Derivatives Market Volume (K Tons) Forecast, by Application 2019 & 2032
- Table 31: Global Pyridine Derivatives Market Revenue Million Forecast, by Country 2019 & 2032
- Table 32: Global Pyridine Derivatives Market Volume K Tons Forecast, by Country 2019 & 2032
- Table 33: China Pyridine Derivatives Market Revenue (Million) Forecast, by Application 2019 & 2032
- Table 34: China Pyridine Derivatives Market Volume (K Tons) Forecast, by Application 2019 & 2032
- Table 35: Japan Pyridine Derivatives Market Revenue (Million) Forecast, by Application 2019 & 2032
- Table 36: Japan Pyridine Derivatives Market Volume (K Tons) Forecast, by Application 2019 & 2032
- Table 37: India Pyridine Derivatives Market Revenue (Million) Forecast, by Application 2019 & 2032
- Table 38: India Pyridine Derivatives Market Volume (K Tons) Forecast, by Application 2019 & 2032
- Table 39: South Korea Pyridine Derivatives Market Revenue (Million) Forecast, by Application 2019 & 2032
- Table 40: South Korea Pyridine Derivatives Market Volume (K Tons) Forecast, by Application 2019 & 2032
- Table 41: Taiwan Pyridine Derivatives Market Revenue (Million) Forecast, by Application 2019 & 2032
- Table 42: Taiwan Pyridine Derivatives Market Volume (K Tons) Forecast, by Application 2019 & 2032
- Table 43: Australia Pyridine Derivatives Market Revenue (Million) Forecast, by Application 2019 & 2032
- Table 44: Australia Pyridine Derivatives Market Volume (K Tons) Forecast, by Application 2019 & 2032
- Table 45: Rest of Asia-Pacific Pyridine Derivatives Market Revenue (Million) Forecast, by Application 2019 & 2032
- Table 46: Rest of Asia-Pacific Pyridine Derivatives Market Volume (K Tons) Forecast, by Application 2019 & 2032
- Table 47: Global Pyridine Derivatives Market Revenue Million Forecast, by Country 2019 & 2032
- Table 48: Global Pyridine Derivatives Market Volume K Tons Forecast, by Country 2019 & 2032
- Table 49: Brazil Pyridine Derivatives Market Revenue (Million) Forecast, by Application 2019 & 2032
- Table 50: Brazil Pyridine Derivatives Market Volume (K Tons) Forecast, by Application 2019 & 2032
- Table 51: Argentina Pyridine Derivatives Market Revenue (Million) Forecast, by Application 2019 & 2032
- Table 52: Argentina Pyridine Derivatives Market Volume (K Tons) Forecast, by Application 2019 & 2032
- Table 53: Rest of South America Pyridine Derivatives Market Revenue (Million) Forecast, by Application 2019 & 2032
- Table 54: Rest of South America Pyridine Derivatives Market Volume (K Tons) Forecast, by Application 2019 & 2032
- Table 55: Global Pyridine Derivatives Market Revenue Million Forecast, by Country 2019 & 2032
- Table 56: Global Pyridine Derivatives Market Volume K Tons Forecast, by Country 2019 & 2032
- Table 57: Middle East Pyridine Derivatives Market Revenue (Million) Forecast, by Application 2019 & 2032
- Table 58: Middle East Pyridine Derivatives Market Volume (K Tons) Forecast, by Application 2019 & 2032
- Table 59: Africa Pyridine Derivatives Market Revenue (Million) Forecast, by Application 2019 & 2032
- Table 60: Africa Pyridine Derivatives Market Volume (K Tons) Forecast, by Application 2019 & 2032
- Table 61: Global Pyridine Derivatives Market Revenue Million Forecast, by Type 2019 & 2032
- Table 62: Global Pyridine Derivatives Market Volume K Tons Forecast, by Type 2019 & 2032
- Table 63: Global Pyridine Derivatives Market Revenue Million Forecast, by End-user Industry 2019 & 2032
- Table 64: Global Pyridine Derivatives Market Volume K Tons Forecast, by End-user Industry 2019 & 2032
- Table 65: Global Pyridine Derivatives Market Revenue Million Forecast, by Country 2019 & 2032
- Table 66: Global Pyridine Derivatives Market Volume K Tons Forecast, by Country 2019 & 2032
- Table 67: China Pyridine Derivatives Market Revenue (Million) Forecast, by Application 2019 & 2032
- Table 68: China Pyridine Derivatives Market Volume (K Tons) Forecast, by Application 2019 & 2032
- Table 69: India Pyridine Derivatives Market Revenue (Million) Forecast, by Application 2019 & 2032
- Table 70: India Pyridine Derivatives Market Volume (K Tons) Forecast, by Application 2019 & 2032
- Table 71: Japan Pyridine Derivatives Market Revenue (Million) Forecast, by Application 2019 & 2032
- Table 72: Japan Pyridine Derivatives Market Volume (K Tons) Forecast, by Application 2019 & 2032
- Table 73: South Korea Pyridine Derivatives Market Revenue (Million) Forecast, by Application 2019 & 2032
- Table 74: South Korea Pyridine Derivatives Market Volume (K Tons) Forecast, by Application 2019 & 2032
- Table 75: Rest of Asia Pacific Pyridine Derivatives Market Revenue (Million) Forecast, by Application 2019 & 2032
- Table 76: Rest of Asia Pacific Pyridine Derivatives Market Volume (K Tons) Forecast, by Application 2019 & 2032
- Table 77: Global Pyridine Derivatives Market Revenue Million Forecast, by Type 2019 & 2032
- Table 78: Global Pyridine Derivatives Market Volume K Tons Forecast, by Type 2019 & 2032
- Table 79: Global Pyridine Derivatives Market Revenue Million Forecast, by End-user Industry 2019 & 2032
- Table 80: Global Pyridine Derivatives Market Volume K Tons Forecast, by End-user Industry 2019 & 2032
- Table 81: Global Pyridine Derivatives Market Revenue Million Forecast, by Country 2019 & 2032
- Table 82: Global Pyridine Derivatives Market Volume K Tons Forecast, by Country 2019 & 2032
- Table 83: United States Pyridine Derivatives Market Revenue (Million) Forecast, by Application 2019 & 2032
- Table 84: United States Pyridine Derivatives Market Volume (K Tons) Forecast, by Application 2019 & 2032
- Table 85: Canada Pyridine Derivatives Market Revenue (Million) Forecast, by Application 2019 & 2032
- Table 86: Canada Pyridine Derivatives Market Volume (K Tons) Forecast, by Application 2019 & 2032
- Table 87: Mexico Pyridine Derivatives Market Revenue (Million) Forecast, by Application 2019 & 2032
- Table 88: Mexico Pyridine Derivatives Market Volume (K Tons) Forecast, by Application 2019 & 2032
- Table 89: Global Pyridine Derivatives Market Revenue Million Forecast, by Type 2019 & 2032
- Table 90: Global Pyridine Derivatives Market Volume K Tons Forecast, by Type 2019 & 2032
- Table 91: Global Pyridine Derivatives Market Revenue Million Forecast, by End-user Industry 2019 & 2032
- Table 92: Global Pyridine Derivatives Market Volume K Tons Forecast, by End-user Industry 2019 & 2032
- Table 93: Global Pyridine Derivatives Market Revenue Million Forecast, by Country 2019 & 2032
- Table 94: Global Pyridine Derivatives Market Volume K Tons Forecast, by Country 2019 & 2032
- Table 95: Germany Pyridine Derivatives Market Revenue (Million) Forecast, by Application 2019 & 2032
- Table 96: Germany Pyridine Derivatives Market Volume (K Tons) Forecast, by Application 2019 & 2032
- Table 97: United Kingdom Pyridine Derivatives Market Revenue (Million) Forecast, by Application 2019 & 2032
- Table 98: United Kingdom Pyridine Derivatives Market Volume (K Tons) Forecast, by Application 2019 & 2032
- Table 99: France Pyridine Derivatives Market Revenue (Million) Forecast, by Application 2019 & 2032
- Table 100: France Pyridine Derivatives Market Volume (K Tons) Forecast, by Application 2019 & 2032
- Table 101: Italy Pyridine Derivatives Market Revenue (Million) Forecast, by Application 2019 & 2032
- Table 102: Italy Pyridine Derivatives Market Volume (K Tons) Forecast, by Application 2019 & 2032
- Table 103: Rest of Europe Pyridine Derivatives Market Revenue (Million) Forecast, by Application 2019 & 2032
- Table 104: Rest of Europe Pyridine Derivatives Market Volume (K Tons) Forecast, by Application 2019 & 2032
- Table 105: Global Pyridine Derivatives Market Revenue Million Forecast, by Type 2019 & 2032
- Table 106: Global Pyridine Derivatives Market Volume K Tons Forecast, by Type 2019 & 2032
- Table 107: Global Pyridine Derivatives Market Revenue Million Forecast, by End-user Industry 2019 & 2032
- Table 108: Global Pyridine Derivatives Market Volume K Tons Forecast, by End-user Industry 2019 & 2032
- Table 109: Global Pyridine Derivatives Market Revenue Million Forecast, by Country 2019 & 2032
- Table 110: Global Pyridine Derivatives Market Volume K Tons Forecast, by Country 2019 & 2032
- Table 111: Brazil Pyridine Derivatives Market Revenue (Million) Forecast, by Application 2019 & 2032
- Table 112: Brazil Pyridine Derivatives Market Volume (K Tons) Forecast, by Application 2019 & 2032
- Table 113: Argentina Pyridine Derivatives Market Revenue (Million) Forecast, by Application 2019 & 2032
- Table 114: Argentina Pyridine Derivatives Market Volume (K Tons) Forecast, by Application 2019 & 2032
- Table 115: Rest of South America Pyridine Derivatives Market Revenue (Million) Forecast, by Application 2019 & 2032
- Table 116: Rest of South America Pyridine Derivatives Market Volume (K Tons) Forecast, by Application 2019 & 2032
- Table 117: Global Pyridine Derivatives Market Revenue Million Forecast, by Type 2019 & 2032
- Table 118: Global Pyridine Derivatives Market Volume K Tons Forecast, by Type 2019 & 2032
- Table 119: Global Pyridine Derivatives Market Revenue Million Forecast, by End-user Industry 2019 & 2032
- Table 120: Global Pyridine Derivatives Market Volume K Tons Forecast, by End-user Industry 2019 & 2032
- Table 121: Global Pyridine Derivatives Market Revenue Million Forecast, by Country 2019 & 2032
- Table 122: Global Pyridine Derivatives Market Volume K Tons Forecast, by Country 2019 & 2032
- Table 123: Saudi Arabia Pyridine Derivatives Market Revenue (Million) Forecast, by Application 2019 & 2032
- Table 124: Saudi Arabia Pyridine Derivatives Market Volume (K Tons) Forecast, by Application 2019 & 2032
- Table 125: South Africa Pyridine Derivatives Market Revenue (Million) Forecast, by Application 2019 & 2032
- Table 126: South Africa Pyridine Derivatives Market Volume (K Tons) Forecast, by Application 2019 & 2032
- Table 127: Rest of Middle East and Africa Pyridine Derivatives Market Revenue (Million) Forecast, by Application 2019 & 2032
- Table 128: Rest of Middle East and Africa Pyridine Derivatives Market Volume (K Tons) Forecast, by Application 2019 & 2032
Frequently Asked Questions
1. What is the projected Compound Annual Growth Rate (CAGR) of the Pyridine Derivatives Market?
The projected CAGR is approximately 6.8%.
2. Which companies are prominent players in the Pyridine Derivatives Market?
Key companies in the market include Merck KGaA, KOEI Chemical Co Ltd, National Analytical Corporation, Vertellus, Shandong Luba Chemical Co Ltd, Alfa Aesar, Lonza, Resonance Specialties Limited, Jubilant Life Sciences Limited.
3. What are the main segments of the Pyridine Derivatives Market?
The market segments include Type, End-user Industry.
4. Can you provide details about the market size?
The market size is estimated to be USD 745.2 Million as of 2022.
5. What are some drivers contributing to market growth?
Increasing Demand for Beta Picoline in Various Applications; Other Drivers.
6. What are the notable trends driving market growth?
Increasing Demand for Beta Picoline.
7. Are there any restraints impacting market growth?
Adverse Impact on Market Due to the COVID-19 Pandemic; Other Restraints.
8. Can you provide examples of recent developments in the market?
In May 2020, Trineso announced the acquisition of the vinyl pyridine latex business from Synthomer PLC, which, in turn, enhanced the company's product portfolio.
9. What pricing options are available for accessing the report?
Pricing options include single-user, multi-user, and enterprise licenses priced at USD 4750, USD 5250, and USD 8750 respectively.
10. Is the market size provided in terms of value or volume?
The market size is provided in terms of value, measured in Million and volume, measured in K Tons.
11. Are there any specific market keywords associated with the report?
Yes, the market keyword associated with the report is "Pyridine Derivatives Market," which aids in identifying and referencing the specific market segment covered.
12. How do I determine which pricing option suits my needs best?
The pricing options vary based on user requirements and access needs. Individual users may opt for single-user licenses, while businesses requiring broader access may choose multi-user or enterprise licenses for cost-effective access to the report.
13. Are there any additional resources or data provided in the Pyridine Derivatives Market report?
While the report offers comprehensive insights, it's advisable to review the specific contents or supplementary materials provided to ascertain if additional resources or data are available.
14. How can I stay updated on further developments or reports in the Pyridine Derivatives Market?
To stay informed about further developments, trends, and reports in the Pyridine Derivatives Market, consider subscribing to industry newsletters, following relevant companies and organizations, or regularly checking reputable industry news sources and publications.
Methodology
Step 1 - Identification of Relevant Samples Size from Population Database


Step 2 - Approaches for Defining Global Market Size (Value, Volume* & Price*)

Note*: In applicable scenarios
Step 3 - Data Sources
Primary Research
- Web Analytics
- Survey Reports
- Research Institute
- Latest Research Reports
- Opinion Leaders
Secondary Research
- Annual Reports
- White Paper
- Latest Press Release
- Industry Association
- Paid Database
- Investor Presentations

Step 4 - Data Triangulation
Involves using different sources of information in order to increase the validity of a study
These sources are likely to be stakeholders in a program - participants, other researchers, program staff, other community members, and so on.
Then we put all data in single framework & apply various statistical tools to find out the dynamic on the market.
During the analysis stage, feedback from the stakeholder groups would be compared to determine areas of agreement as well as areas of divergence
