

Key Insights
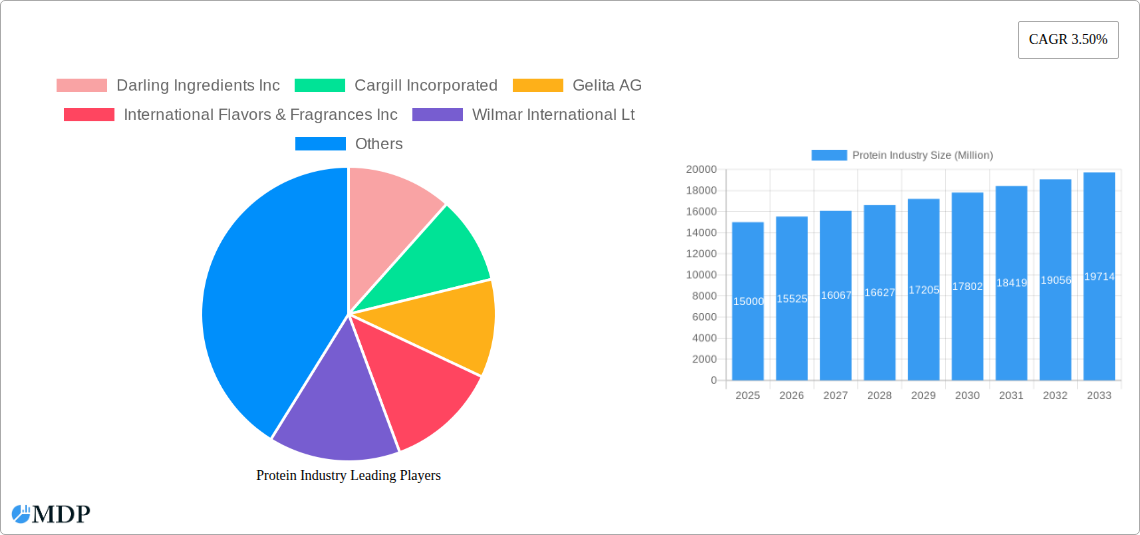
The global protein market, valued at approximately $XX million in 2025, is projected to experience steady growth, exhibiting a compound annual growth rate (CAGR) of 3.50% from 2025 to 2033. This expansion is fueled by several key drivers. The increasing global population and rising demand for nutritious food sources are significantly boosting protein consumption. Further propelling growth is the expanding health and wellness sector, with consumers increasingly prioritizing high-protein diets for weight management, muscle building, and overall health improvement. The rise of plant-based protein alternatives, catering to both ethical and dietary preferences, adds another layer to market dynamism. The food and beverage industry's increasing incorporation of protein into diverse product offerings, from protein bars and shakes to enhanced beverages and meat alternatives, further contributes to market expansion. However, challenges exist, such as price volatility in raw materials and concerns regarding the sustainability of certain protein sources. Furthermore, stringent regulations surrounding food safety and labeling can create hurdles for market players.
Segmentation reveals a diverse market landscape. Animal-derived proteins, including dairy and meat products, remain dominant, though the plant-based segment is rapidly gaining traction. The sport/performance nutrition sector shows strong growth, driven by rising fitness consciousness. Key market players, such as Darling Ingredients Inc, Cargill Incorporated, and Glanbia PLC, are strategically navigating these dynamics through innovation, acquisitions, and expansion into new product categories and geographical markets. Regional analysis indicates a strong presence across North America, Europe, and the Asia-Pacific region, with each exhibiting unique growth trajectories influenced by factors such as consumer preferences, dietary habits, and economic conditions. The forecast period (2025-2033) indicates continued growth, with specific regional shares potentially shifting based on evolving consumer trends and economic performance.
Protein Industry Market Report: 2019-2033
This comprehensive report provides a detailed analysis of the global protein industry, encompassing market dynamics, leading players, emerging trends, and future growth prospects. The report covers the period 2019-2033, with a focus on the 2025-2033 forecast period. Key segments analyzed include animal-sourced protein, sport/performance nutrition, and end-users in animal feed and food & beverage sectors. The report leverages data from the historical period (2019-2024) and uses 2025 as the base year for projections. Expect insightful analysis and actionable data driving informed decisions within this dynamic market projected to reach xx Million by 2033.
Protein Industry Market Dynamics & Concentration
The global protein market is characterized by a moderately concentrated structure with several major players holding significant market share. Darling Ingredients Inc., Cargill Incorporated, and Archer Daniels Midland Company are among the key players, each commanding a substantial portion of the market estimated at xx Million in 2025. Market concentration is influenced by factors including economies of scale, strong brand recognition, and extensive distribution networks. The CAGR from 2025 to 2033 is estimated at xx%.
- Market Share: Darling Ingredients Inc. (xx%), Cargill Incorporated (xx%), Archer Daniels Midland Company (xx%), Others (xx%).
- Innovation Drivers: Growing consumer demand for healthier and functional foods drives innovation in protein sources and processing technologies.
- Regulatory Frameworks: Government regulations regarding food safety, labeling, and sustainability influence industry practices and product development.
- Product Substitutes: Plant-based protein alternatives and synthetic protein products are emerging as substitutes impacting the market share of traditional protein sources.
- End-User Trends: The increasing consumption of protein-rich foods and beverages across various demographics, particularly within the health-conscious consumer base, fuels market growth. The animal feed segment remains a significant end-user due to the substantial demand for protein in animal diets.
- M&A Activities: The protein industry witnesses consistent M&A activity. The number of deals completed between 2019 and 2024 totaled approximately xx, driven by strategies to expand market reach, gain access to new technologies, and consolidate market share. This trend is expected to continue with xx deals projected between 2025 and 2033.
Protein Industry Industry Trends & Analysis
The protein industry is experiencing robust growth driven by several key factors. Rising health consciousness among consumers, increased disposable incomes, and the expanding global population contribute significantly to market expansion. Technological advancements in protein extraction, processing, and formulation are creating innovative products with enhanced functionalities and improved nutritional profiles. The market is witnessing a shift towards plant-based protein alternatives, driven by consumer interest in sustainability and ethical concerns. This trend, however, does not threaten traditional protein sources, with both animal and plant-based protein markets exhibiting strong growth. Competitive dynamics are characterized by intense rivalry among established players and emerging companies aiming to capture market share through product differentiation, innovation, and strategic partnerships. The market penetration of plant-based proteins in the food & beverage sector is projected to reach xx% by 2033, indicating a substantial shift in consumer preference.

Leading Markets & Segments in Protein Industry
The dominant region in the protein industry is North America, followed by Europe and Asia-Pacific. Within these regions, specific countries like the United States, China, and Germany hold significant market positions. The animal-sourced protein segment constitutes the largest share of the market, driven by established consumption patterns and the versatile applications of animal proteins. However, the sport/performance nutrition segment exhibits substantial growth potential, due to rising consumer interest in fitness and athletic performance enhancement. The animal feed industry remains a crucial end-user, largely fueled by the increasing demand for meat and dairy products globally.
- Key Drivers:
- North America: Strong consumer demand, robust infrastructure, and established processing capabilities.
- Europe: High levels of consumer awareness about health and nutrition, stringent regulations promoting product quality.
- Asia-Pacific: Rapid economic growth, rising disposable incomes, and changing dietary habits.
- Segment Dominance Analysis: The animal-sourced protein segment’s dominance stems from deep-rooted consumer preferences and diverse applications across food and non-food sectors. The significant role of animal protein in animal feed also significantly contributes to its market leadership. The sport/performance nutrition segment’s growth is attributed to rising consumer interest in fitness and healthy lifestyles.
Protein Industry Product Developments
Recent innovations in the protein industry focus on developing convenient, functional, and value-added products. This includes the development of ready-to-drink (RTD) protein shakes, high-protein snacks, and functional food and beverage products incorporating protein-rich ingredients. Technological advances in protein extraction, purification, and formulation are enabling the creation of novel protein sources and products with improved nutritional profiles and enhanced functional attributes. Companies are emphasizing clean labels and sustainable sourcing practices, meeting growing consumer demand for transparency and ethical sourcing.
Key Drivers of Protein Industry Growth
The protein industry's growth is fueled by several key factors:
- Technological Advancements: Innovations in protein extraction, processing, and formulation are leading to the development of novel products with improved functionalities and nutritional values.
- Economic Growth: Rising disposable incomes globally, particularly in emerging economies, are increasing consumer spending on protein-rich foods and beverages.
- Health and Wellness Trends: Growing awareness of the importance of protein in maintaining health and well-being fuels increased consumption of protein-rich products.
- Regulatory Support: Government policies and regulations promoting food safety and sustainable food production support industry growth.
Challenges in the Protein Industry Market
Several challenges hinder protein industry growth:
- Regulatory Hurdles: Stringent regulatory requirements regarding food safety, labeling, and sustainability can increase production costs and time to market.
- Supply Chain Issues: Fluctuations in raw material prices, supply chain disruptions, and geopolitical factors can affect production and profitability.
- Competitive Pressure: The presence of several major players and emerging companies creates intense competition. Price wars and innovation race can reduce margins.
Emerging Opportunities in Protein Industry
The protein industry presents several promising opportunities:
- Plant-Based Protein Alternatives: The increasing consumer interest in plant-based protein sources presents a significant opportunity for companies to develop innovative and sustainable products.
- Functional Protein Products: The growing demand for functional foods and beverages with added health benefits offers opportunities to develop protein-enhanced products.
- Strategic Partnerships: Collaborations between protein producers, food manufacturers, and technology companies can lead to breakthroughs in protein production and innovation.
Leading Players in the Protein Industry Sector
- Darling Ingredients Inc.
- Cargill Incorporated
- Gelita AG
- International Flavors & Fragrances Inc.
- Wilmar International Ltd.
- Archer Daniels Midland Company
- Glanbia PLC
- Bunge Limited
- Royal FrieslandCampina NV
- Kerry Group PLC
- Corbion Biotech Inc.
- Südzucker AG
- Groupe LACTALIS
- Fonterra Co-operative Group Limited
- Ingredion Incorporated
- Roquette Frère
- Hilmar Cheese Company Inc
- FUJI OIL HOLDINGS INC
- Arla Foods AmbA
Key Milestones in Protein Industry Industry
- November 2021: Lactalis Ingredients launched new high-protein product concepts using Pronativ® Native Micellar Casein and Pronativ® Native Whey Protein. These new products expanded the high-protein food and beverage market and increased competition in the sector.
- June 2022: Fonterra JV launched Pro-Optima™, a functional whey protein concentrate, showcasing innovation in whey protein production and expanding product offerings within the industry.
- August 2022: Optimum Nutrition launched its new Gold Standard Protein Shake, demonstrating a continued focus on ready-to-drink protein products to capture a share of the increasingly popular RTD market.
Strategic Outlook for Protein Industry Market
The protein industry is poised for continued growth, driven by ongoing technological advancements, changing consumer preferences, and increasing global demand. Strategic opportunities lie in developing innovative and sustainable protein sources, expanding into emerging markets, and forging strategic partnerships to enhance market reach and product innovation. The focus on clean labels, transparency, and sustainability will continue to shape industry developments, with companies seeking to meet the growing demand for ethical and environmentally friendly protein products.
Protein Industry Segmentation
-
1. Source
-
1.1. Animal
-
1.1.1. By Protein Type
- 1.1.1.1. Casein and Caseinates
- 1.1.1.2. Collagen
- 1.1.1.3. Egg Protein
- 1.1.1.4. Gelatin
- 1.1.1.5. Insect Protein
- 1.1.1.6. Milk Protein
- 1.1.1.7. Whey Protein
- 1.1.1.8. Other Animal Protein
-
1.1.1. By Protein Type
-
1.2. Microbial
- 1.2.1. Algae Protein
- 1.2.2. Mycoprotein
-
1.3. Plant
- 1.3.1. Hemp Protein
- 1.3.2. Pea Protein
- 1.3.3. Potato Protein
- 1.3.4. Rice Protein
- 1.3.5. Soy Protein
- 1.3.6. Wheat Protein
- 1.3.7. Other Plant Protein
-
1.1. Animal
-
2. End User
- 2.1. Animal Feed
-
2.2. Food and Beverages
-
2.2.1. By Sub End User
- 2.2.1.1. Bakery
- 2.2.1.2. Breakfast Cereals
- 2.2.1.3. Condiments/Sauces
- 2.2.1.4. Confectionery
- 2.2.1.5. Dairy and Dairy Alternative Products
- 2.2.1.6. Meat/Poultry/Seafood and Meat Alternative Products
- 2.2.1.7. RTE/RTC Food Products
- 2.2.1.8. Snacks
-
2.2.1. By Sub End User
- 2.3. Personal Care and Cosmetics
-
2.4. Supplements
- 2.4.1. Baby Food and Infant Formula
- 2.4.2. Elderly Nutrition and Medical Nutrition
- 2.4.3. Sport/Performance Nutrition
Protein Industry Segmentation By Geography
-
1. North America
- 1.1. United States
- 1.2. Canada
- 1.3. Mexico
-
2. South America
- 2.1. Brazil
- 2.2. Argentina
- 2.3. Rest of South America
-
3. Europe
- 3.1. United Kingdom
- 3.2. Germany
- 3.3. France
- 3.4. Italy
- 3.5. Spain
- 3.6. Russia
- 3.7. Benelux
- 3.8. Nordics
- 3.9. Rest of Europe
-
4. Middle East & Africa
- 4.1. Turkey
- 4.2. Israel
- 4.3. GCC
- 4.4. North Africa
- 4.5. South Africa
- 4.6. Rest of Middle East & Africa
-
5. Asia Pacific
- 5.1. China
- 5.2. India
- 5.3. Japan
- 5.4. South Korea
- 5.5. ASEAN
- 5.6. Oceania
- 5.7. Rest of Asia Pacific

Protein Industry REPORT HIGHLIGHTS
| Aspects | Details |
|---|---|
| Study Period | 2019-2033 |
| Base Year | 2024 |
| Estimated Year | 2025 |
| Forecast Period | 2025-2033 |
| Historical Period | 2019-2024 |
| Growth Rate | CAGR of 3.50% from 2019-2033 |
| Segmentation |
|
Table of Contents
- 1. Introduction
- 1.1. Research Scope
- 1.2. Market Segmentation
- 1.3. Research Methodology
- 1.4. Definitions and Assumptions
- 2. Executive Summary
- 2.1. Introduction
- 3. Market Dynamics
- 3.1. Introduction
- 3.2. Market Drivers
- 3.2.1. Increasing Demand For Convenience & Processed Food
- 3.3. Market Restrains
- 3.3.1. Increased Consumer Awareness On Side-Effects Of Chemical Additives
- 3.4. Market Trends
- 3.4.1. OTHER KEY INDUSTRY TRENDS COVERED IN THE REPORT
- 4. Market Factor Analysis
- 4.1. Porters Five Forces
- 4.2. Supply/Value Chain
- 4.3. PESTEL analysis
- 4.4. Market Entropy
- 4.5. Patent/Trademark Analysis
- 5. Global Protein Industry Analysis, Insights and Forecast, 2019-2031
- 5.1. Market Analysis, Insights and Forecast - by Source
- 5.1.1. Animal
- 5.1.1.1. By Protein Type
- 5.1.1.1.1. Casein and Caseinates
- 5.1.1.1.2. Collagen
- 5.1.1.1.3. Egg Protein
- 5.1.1.1.4. Gelatin
- 5.1.1.1.5. Insect Protein
- 5.1.1.1.6. Milk Protein
- 5.1.1.1.7. Whey Protein
- 5.1.1.1.8. Other Animal Protein
- 5.1.1.1. By Protein Type
- 5.1.2. Microbial
- 5.1.2.1. Algae Protein
- 5.1.2.2. Mycoprotein
- 5.1.3. Plant
- 5.1.3.1. Hemp Protein
- 5.1.3.2. Pea Protein
- 5.1.3.3. Potato Protein
- 5.1.3.4. Rice Protein
- 5.1.3.5. Soy Protein
- 5.1.3.6. Wheat Protein
- 5.1.3.7. Other Plant Protein
- 5.1.1. Animal
- 5.2. Market Analysis, Insights and Forecast - by End User
- 5.2.1. Animal Feed
- 5.2.2. Food and Beverages
- 5.2.2.1. By Sub End User
- 5.2.2.1.1. Bakery
- 5.2.2.1.2. Breakfast Cereals
- 5.2.2.1.3. Condiments/Sauces
- 5.2.2.1.4. Confectionery
- 5.2.2.1.5. Dairy and Dairy Alternative Products
- 5.2.2.1.6. Meat/Poultry/Seafood and Meat Alternative Products
- 5.2.2.1.7. RTE/RTC Food Products
- 5.2.2.1.8. Snacks
- 5.2.2.1. By Sub End User
- 5.2.3. Personal Care and Cosmetics
- 5.2.4. Supplements
- 5.2.4.1. Baby Food and Infant Formula
- 5.2.4.2. Elderly Nutrition and Medical Nutrition
- 5.2.4.3. Sport/Performance Nutrition
- 5.3. Market Analysis, Insights and Forecast - by Region
- 5.3.1. North America
- 5.3.2. South America
- 5.3.3. Europe
- 5.3.4. Middle East & Africa
- 5.3.5. Asia Pacific
- 5.1. Market Analysis, Insights and Forecast - by Source
- 6. North America Protein Industry Analysis, Insights and Forecast, 2019-2031
- 6.1. Market Analysis, Insights and Forecast - by Source
- 6.1.1. Animal
- 6.1.1.1. By Protein Type
- 6.1.1.1.1. Casein and Caseinates
- 6.1.1.1.2. Collagen
- 6.1.1.1.3. Egg Protein
- 6.1.1.1.4. Gelatin
- 6.1.1.1.5. Insect Protein
- 6.1.1.1.6. Milk Protein
- 6.1.1.1.7. Whey Protein
- 6.1.1.1.8. Other Animal Protein
- 6.1.1.1. By Protein Type
- 6.1.2. Microbial
- 6.1.2.1. Algae Protein
- 6.1.2.2. Mycoprotein
- 6.1.3. Plant
- 6.1.3.1. Hemp Protein
- 6.1.3.2. Pea Protein
- 6.1.3.3. Potato Protein
- 6.1.3.4. Rice Protein
- 6.1.3.5. Soy Protein
- 6.1.3.6. Wheat Protein
- 6.1.3.7. Other Plant Protein
- 6.1.1. Animal
- 6.2. Market Analysis, Insights and Forecast - by End User
- 6.2.1. Animal Feed
- 6.2.2. Food and Beverages
- 6.2.2.1. By Sub End User
- 6.2.2.1.1. Bakery
- 6.2.2.1.2. Breakfast Cereals
- 6.2.2.1.3. Condiments/Sauces
- 6.2.2.1.4. Confectionery
- 6.2.2.1.5. Dairy and Dairy Alternative Products
- 6.2.2.1.6. Meat/Poultry/Seafood and Meat Alternative Products
- 6.2.2.1.7. RTE/RTC Food Products
- 6.2.2.1.8. Snacks
- 6.2.2.1. By Sub End User
- 6.2.3. Personal Care and Cosmetics
- 6.2.4. Supplements
- 6.2.4.1. Baby Food and Infant Formula
- 6.2.4.2. Elderly Nutrition and Medical Nutrition
- 6.2.4.3. Sport/Performance Nutrition
- 6.1. Market Analysis, Insights and Forecast - by Source
- 7. South America Protein Industry Analysis, Insights and Forecast, 2019-2031
- 7.1. Market Analysis, Insights and Forecast - by Source
- 7.1.1. Animal
- 7.1.1.1. By Protein Type
- 7.1.1.1.1. Casein and Caseinates
- 7.1.1.1.2. Collagen
- 7.1.1.1.3. Egg Protein
- 7.1.1.1.4. Gelatin
- 7.1.1.1.5. Insect Protein
- 7.1.1.1.6. Milk Protein
- 7.1.1.1.7. Whey Protein
- 7.1.1.1.8. Other Animal Protein
- 7.1.1.1. By Protein Type
- 7.1.2. Microbial
- 7.1.2.1. Algae Protein
- 7.1.2.2. Mycoprotein
- 7.1.3. Plant
- 7.1.3.1. Hemp Protein
- 7.1.3.2. Pea Protein
- 7.1.3.3. Potato Protein
- 7.1.3.4. Rice Protein
- 7.1.3.5. Soy Protein
- 7.1.3.6. Wheat Protein
- 7.1.3.7. Other Plant Protein
- 7.1.1. Animal
- 7.2. Market Analysis, Insights and Forecast - by End User
- 7.2.1. Animal Feed
- 7.2.2. Food and Beverages
- 7.2.2.1. By Sub End User
- 7.2.2.1.1. Bakery
- 7.2.2.1.2. Breakfast Cereals
- 7.2.2.1.3. Condiments/Sauces
- 7.2.2.1.4. Confectionery
- 7.2.2.1.5. Dairy and Dairy Alternative Products
- 7.2.2.1.6. Meat/Poultry/Seafood and Meat Alternative Products
- 7.2.2.1.7. RTE/RTC Food Products
- 7.2.2.1.8. Snacks
- 7.2.2.1. By Sub End User
- 7.2.3. Personal Care and Cosmetics
- 7.2.4. Supplements
- 7.2.4.1. Baby Food and Infant Formula
- 7.2.4.2. Elderly Nutrition and Medical Nutrition
- 7.2.4.3. Sport/Performance Nutrition
- 7.1. Market Analysis, Insights and Forecast - by Source
- 8. Europe Protein Industry Analysis, Insights and Forecast, 2019-2031
- 8.1. Market Analysis, Insights and Forecast - by Source
- 8.1.1. Animal
- 8.1.1.1. By Protein Type
- 8.1.1.1.1. Casein and Caseinates
- 8.1.1.1.2. Collagen
- 8.1.1.1.3. Egg Protein
- 8.1.1.1.4. Gelatin
- 8.1.1.1.5. Insect Protein
- 8.1.1.1.6. Milk Protein
- 8.1.1.1.7. Whey Protein
- 8.1.1.1.8. Other Animal Protein
- 8.1.1.1. By Protein Type
- 8.1.2. Microbial
- 8.1.2.1. Algae Protein
- 8.1.2.2. Mycoprotein
- 8.1.3. Plant
- 8.1.3.1. Hemp Protein
- 8.1.3.2. Pea Protein
- 8.1.3.3. Potato Protein
- 8.1.3.4. Rice Protein
- 8.1.3.5. Soy Protein
- 8.1.3.6. Wheat Protein
- 8.1.3.7. Other Plant Protein
- 8.1.1. Animal
- 8.2. Market Analysis, Insights and Forecast - by End User
- 8.2.1. Animal Feed
- 8.2.2. Food and Beverages
- 8.2.2.1. By Sub End User
- 8.2.2.1.1. Bakery
- 8.2.2.1.2. Breakfast Cereals
- 8.2.2.1.3. Condiments/Sauces
- 8.2.2.1.4. Confectionery
- 8.2.2.1.5. Dairy and Dairy Alternative Products
- 8.2.2.1.6. Meat/Poultry/Seafood and Meat Alternative Products
- 8.2.2.1.7. RTE/RTC Food Products
- 8.2.2.1.8. Snacks
- 8.2.2.1. By Sub End User
- 8.2.3. Personal Care and Cosmetics
- 8.2.4. Supplements
- 8.2.4.1. Baby Food and Infant Formula
- 8.2.4.2. Elderly Nutrition and Medical Nutrition
- 8.2.4.3. Sport/Performance Nutrition
- 8.1. Market Analysis, Insights and Forecast - by Source
- 9. Middle East & Africa Protein Industry Analysis, Insights and Forecast, 2019-2031
- 9.1. Market Analysis, Insights and Forecast - by Source
- 9.1.1. Animal
- 9.1.1.1. By Protein Type
- 9.1.1.1.1. Casein and Caseinates
- 9.1.1.1.2. Collagen
- 9.1.1.1.3. Egg Protein
- 9.1.1.1.4. Gelatin
- 9.1.1.1.5. Insect Protein
- 9.1.1.1.6. Milk Protein
- 9.1.1.1.7. Whey Protein
- 9.1.1.1.8. Other Animal Protein
- 9.1.1.1. By Protein Type
- 9.1.2. Microbial
- 9.1.2.1. Algae Protein
- 9.1.2.2. Mycoprotein
- 9.1.3. Plant
- 9.1.3.1. Hemp Protein
- 9.1.3.2. Pea Protein
- 9.1.3.3. Potato Protein
- 9.1.3.4. Rice Protein
- 9.1.3.5. Soy Protein
- 9.1.3.6. Wheat Protein
- 9.1.3.7. Other Plant Protein
- 9.1.1. Animal
- 9.2. Market Analysis, Insights and Forecast - by End User
- 9.2.1. Animal Feed
- 9.2.2. Food and Beverages
- 9.2.2.1. By Sub End User
- 9.2.2.1.1. Bakery
- 9.2.2.1.2. Breakfast Cereals
- 9.2.2.1.3. Condiments/Sauces
- 9.2.2.1.4. Confectionery
- 9.2.2.1.5. Dairy and Dairy Alternative Products
- 9.2.2.1.6. Meat/Poultry/Seafood and Meat Alternative Products
- 9.2.2.1.7. RTE/RTC Food Products
- 9.2.2.1.8. Snacks
- 9.2.2.1. By Sub End User
- 9.2.3. Personal Care and Cosmetics
- 9.2.4. Supplements
- 9.2.4.1. Baby Food and Infant Formula
- 9.2.4.2. Elderly Nutrition and Medical Nutrition
- 9.2.4.3. Sport/Performance Nutrition
- 9.1. Market Analysis, Insights and Forecast - by Source
- 10. Asia Pacific Protein Industry Analysis, Insights and Forecast, 2019-2031
- 10.1. Market Analysis, Insights and Forecast - by Source
- 10.1.1. Animal
- 10.1.1.1. By Protein Type
- 10.1.1.1.1. Casein and Caseinates
- 10.1.1.1.2. Collagen
- 10.1.1.1.3. Egg Protein
- 10.1.1.1.4. Gelatin
- 10.1.1.1.5. Insect Protein
- 10.1.1.1.6. Milk Protein
- 10.1.1.1.7. Whey Protein
- 10.1.1.1.8. Other Animal Protein
- 10.1.1.1. By Protein Type
- 10.1.2. Microbial
- 10.1.2.1. Algae Protein
- 10.1.2.2. Mycoprotein
- 10.1.3. Plant
- 10.1.3.1. Hemp Protein
- 10.1.3.2. Pea Protein
- 10.1.3.3. Potato Protein
- 10.1.3.4. Rice Protein
- 10.1.3.5. Soy Protein
- 10.1.3.6. Wheat Protein
- 10.1.3.7. Other Plant Protein
- 10.1.1. Animal
- 10.2. Market Analysis, Insights and Forecast - by End User
- 10.2.1. Animal Feed
- 10.2.2. Food and Beverages
- 10.2.2.1. By Sub End User
- 10.2.2.1.1. Bakery
- 10.2.2.1.2. Breakfast Cereals
- 10.2.2.1.3. Condiments/Sauces
- 10.2.2.1.4. Confectionery
- 10.2.2.1.5. Dairy and Dairy Alternative Products
- 10.2.2.1.6. Meat/Poultry/Seafood and Meat Alternative Products
- 10.2.2.1.7. RTE/RTC Food Products
- 10.2.2.1.8. Snacks
- 10.2.2.1. By Sub End User
- 10.2.3. Personal Care and Cosmetics
- 10.2.4. Supplements
- 10.2.4.1. Baby Food and Infant Formula
- 10.2.4.2. Elderly Nutrition and Medical Nutrition
- 10.2.4.3. Sport/Performance Nutrition
- 10.1. Market Analysis, Insights and Forecast - by Source
- 11. North America Protein Industry Analysis, Insights and Forecast, 2019-2031
- 11.1. Market Analysis, Insights and Forecast - By Country/Sub-region
- 11.1.1. undefined
- 12. Europe Protein Industry Analysis, Insights and Forecast, 2019-2031
- 12.1. Market Analysis, Insights and Forecast - By Country/Sub-region
- 12.1.1. undefined
- 13. Asia-Pacific Protein Industry Analysis, Insights and Forecast, 2019-2031
- 13.1. Market Analysis, Insights and Forecast - By Country/Sub-region
- 13.1.1. undefined
- 14. Competitive Analysis
- 14.1. Global Market Share Analysis 2024
- 14.2. Company Profiles
- 14.2.1 Darling Ingredients Inc
- 14.2.1.1. Overview
- 14.2.1.2. Products
- 14.2.1.3. SWOT Analysis
- 14.2.1.4. Recent Developments
- 14.2.1.5. Financials (Based on Availability)
- 14.2.2 Cargill Incorporated
- 14.2.2.1. Overview
- 14.2.2.2. Products
- 14.2.2.3. SWOT Analysis
- 14.2.2.4. Recent Developments
- 14.2.2.5. Financials (Based on Availability)
- 14.2.3 Gelita AG
- 14.2.3.1. Overview
- 14.2.3.2. Products
- 14.2.3.3. SWOT Analysis
- 14.2.3.4. Recent Developments
- 14.2.3.5. Financials (Based on Availability)
- 14.2.4 International Flavors & Fragrances Inc
- 14.2.4.1. Overview
- 14.2.4.2. Products
- 14.2.4.3. SWOT Analysis
- 14.2.4.4. Recent Developments
- 14.2.4.5. Financials (Based on Availability)
- 14.2.5 Wilmar International Lt
- 14.2.5.1. Overview
- 14.2.5.2. Products
- 14.2.5.3. SWOT Analysis
- 14.2.5.4. Recent Developments
- 14.2.5.5. Financials (Based on Availability)
- 14.2.6 Archer Daniels Midland Company
- 14.2.6.1. Overview
- 14.2.6.2. Products
- 14.2.6.3. SWOT Analysis
- 14.2.6.4. Recent Developments
- 14.2.6.5. Financials (Based on Availability)
- 14.2.7 Glanbia PLC
- 14.2.7.1. Overview
- 14.2.7.2. Products
- 14.2.7.3. SWOT Analysis
- 14.2.7.4. Recent Developments
- 14.2.7.5. Financials (Based on Availability)
- 14.2.8 Bunge Limited
- 14.2.8.1. Overview
- 14.2.8.2. Products
- 14.2.8.3. SWOT Analysis
- 14.2.8.4. Recent Developments
- 14.2.8.5. Financials (Based on Availability)
- 14.2.9 Royal FrieslandCampina NV
- 14.2.9.1. Overview
- 14.2.9.2. Products
- 14.2.9.3. SWOT Analysis
- 14.2.9.4. Recent Developments
- 14.2.9.5. Financials (Based on Availability)
- 14.2.10 Kerry Group PLC
- 14.2.10.1. Overview
- 14.2.10.2. Products
- 14.2.10.3. SWOT Analysis
- 14.2.10.4. Recent Developments
- 14.2.10.5. Financials (Based on Availability)
- 14.2.11 Corbion Biotech Inc
- 14.2.11.1. Overview
- 14.2.11.2. Products
- 14.2.11.3. SWOT Analysis
- 14.2.11.4. Recent Developments
- 14.2.11.5. Financials (Based on Availability)
- 14.2.12 Südzucker AG
- 14.2.12.1. Overview
- 14.2.12.2. Products
- 14.2.12.3. SWOT Analysis
- 14.2.12.4. Recent Developments
- 14.2.12.5. Financials (Based on Availability)
- 14.2.13 Groupe LACTALIS
- 14.2.13.1. Overview
- 14.2.13.2. Products
- 14.2.13.3. SWOT Analysis
- 14.2.13.4. Recent Developments
- 14.2.13.5. Financials (Based on Availability)
- 14.2.14 Fonterra Co-operative Group Limited
- 14.2.14.1. Overview
- 14.2.14.2. Products
- 14.2.14.3. SWOT Analysis
- 14.2.14.4. Recent Developments
- 14.2.14.5. Financials (Based on Availability)
- 14.2.15 Ingredion Incorporated
- 14.2.15.1. Overview
- 14.2.15.2. Products
- 14.2.15.3. SWOT Analysis
- 14.2.15.4. Recent Developments
- 14.2.15.5. Financials (Based on Availability)
- 14.2.16 Roquette Frère
- 14.2.16.1. Overview
- 14.2.16.2. Products
- 14.2.16.3. SWOT Analysis
- 14.2.16.4. Recent Developments
- 14.2.16.5. Financials (Based on Availability)
- 14.2.17 Hilmar Cheese Company Inc
- 14.2.17.1. Overview
- 14.2.17.2. Products
- 14.2.17.3. SWOT Analysis
- 14.2.17.4. Recent Developments
- 14.2.17.5. Financials (Based on Availability)
- 14.2.18 FUJI OIL HOLDINGS INC
- 14.2.18.1. Overview
- 14.2.18.2. Products
- 14.2.18.3. SWOT Analysis
- 14.2.18.4. Recent Developments
- 14.2.18.5. Financials (Based on Availability)
- 14.2.19 Arla Foods AmbA
- 14.2.19.1. Overview
- 14.2.19.2. Products
- 14.2.19.3. SWOT Analysis
- 14.2.19.4. Recent Developments
- 14.2.19.5. Financials (Based on Availability)
- 14.2.1 Darling Ingredients Inc
List of Figures
- Figure 1: Global Protein Industry Revenue Breakdown (Million, %) by Region 2024 & 2032
- Figure 2: Global Protein Industry Volume Breakdown (K Tons, %) by Region 2024 & 2032
- Figure 3: North America Protein Industry Revenue (Million), by Country 2024 & 2032
- Figure 4: North America Protein Industry Volume (K Tons), by Country 2024 & 2032
- Figure 5: North America Protein Industry Revenue Share (%), by Country 2024 & 2032
- Figure 6: North America Protein Industry Volume Share (%), by Country 2024 & 2032
- Figure 7: Europe Protein Industry Revenue (Million), by Country 2024 & 2032
- Figure 8: Europe Protein Industry Volume (K Tons), by Country 2024 & 2032
- Figure 9: Europe Protein Industry Revenue Share (%), by Country 2024 & 2032
- Figure 10: Europe Protein Industry Volume Share (%), by Country 2024 & 2032
- Figure 11: Asia-Pacific Protein Industry Revenue (Million), by Country 2024 & 2032
- Figure 12: Asia-Pacific Protein Industry Volume (K Tons), by Country 2024 & 2032
- Figure 13: Asia-Pacific Protein Industry Revenue Share (%), by Country 2024 & 2032
- Figure 14: Asia-Pacific Protein Industry Volume Share (%), by Country 2024 & 2032
- Figure 15: North America Protein Industry Revenue (Million), by Source 2024 & 2032
- Figure 16: North America Protein Industry Volume (K Tons), by Source 2024 & 2032
- Figure 17: North America Protein Industry Revenue Share (%), by Source 2024 & 2032
- Figure 18: North America Protein Industry Volume Share (%), by Source 2024 & 2032
- Figure 19: North America Protein Industry Revenue (Million), by End User 2024 & 2032
- Figure 20: North America Protein Industry Volume (K Tons), by End User 2024 & 2032
- Figure 21: North America Protein Industry Revenue Share (%), by End User 2024 & 2032
- Figure 22: North America Protein Industry Volume Share (%), by End User 2024 & 2032
- Figure 23: North America Protein Industry Revenue (Million), by Country 2024 & 2032
- Figure 24: North America Protein Industry Volume (K Tons), by Country 2024 & 2032
- Figure 25: North America Protein Industry Revenue Share (%), by Country 2024 & 2032
- Figure 26: North America Protein Industry Volume Share (%), by Country 2024 & 2032
- Figure 27: South America Protein Industry Revenue (Million), by Source 2024 & 2032
- Figure 28: South America Protein Industry Volume (K Tons), by Source 2024 & 2032
- Figure 29: South America Protein Industry Revenue Share (%), by Source 2024 & 2032
- Figure 30: South America Protein Industry Volume Share (%), by Source 2024 & 2032
- Figure 31: South America Protein Industry Revenue (Million), by End User 2024 & 2032
- Figure 32: South America Protein Industry Volume (K Tons), by End User 2024 & 2032
- Figure 33: South America Protein Industry Revenue Share (%), by End User 2024 & 2032
- Figure 34: South America Protein Industry Volume Share (%), by End User 2024 & 2032
- Figure 35: South America Protein Industry Revenue (Million), by Country 2024 & 2032
- Figure 36: South America Protein Industry Volume (K Tons), by Country 2024 & 2032
- Figure 37: South America Protein Industry Revenue Share (%), by Country 2024 & 2032
- Figure 38: South America Protein Industry Volume Share (%), by Country 2024 & 2032
- Figure 39: Europe Protein Industry Revenue (Million), by Source 2024 & 2032
- Figure 40: Europe Protein Industry Volume (K Tons), by Source 2024 & 2032
- Figure 41: Europe Protein Industry Revenue Share (%), by Source 2024 & 2032
- Figure 42: Europe Protein Industry Volume Share (%), by Source 2024 & 2032
- Figure 43: Europe Protein Industry Revenue (Million), by End User 2024 & 2032
- Figure 44: Europe Protein Industry Volume (K Tons), by End User 2024 & 2032
- Figure 45: Europe Protein Industry Revenue Share (%), by End User 2024 & 2032
- Figure 46: Europe Protein Industry Volume Share (%), by End User 2024 & 2032
- Figure 47: Europe Protein Industry Revenue (Million), by Country 2024 & 2032
- Figure 48: Europe Protein Industry Volume (K Tons), by Country 2024 & 2032
- Figure 49: Europe Protein Industry Revenue Share (%), by Country 2024 & 2032
- Figure 50: Europe Protein Industry Volume Share (%), by Country 2024 & 2032
- Figure 51: Middle East & Africa Protein Industry Revenue (Million), by Source 2024 & 2032
- Figure 52: Middle East & Africa Protein Industry Volume (K Tons), by Source 2024 & 2032
- Figure 53: Middle East & Africa Protein Industry Revenue Share (%), by Source 2024 & 2032
- Figure 54: Middle East & Africa Protein Industry Volume Share (%), by Source 2024 & 2032
- Figure 55: Middle East & Africa Protein Industry Revenue (Million), by End User 2024 & 2032
- Figure 56: Middle East & Africa Protein Industry Volume (K Tons), by End User 2024 & 2032
- Figure 57: Middle East & Africa Protein Industry Revenue Share (%), by End User 2024 & 2032
- Figure 58: Middle East & Africa Protein Industry Volume Share (%), by End User 2024 & 2032
- Figure 59: Middle East & Africa Protein Industry Revenue (Million), by Country 2024 & 2032
- Figure 60: Middle East & Africa Protein Industry Volume (K Tons), by Country 2024 & 2032
- Figure 61: Middle East & Africa Protein Industry Revenue Share (%), by Country 2024 & 2032
- Figure 62: Middle East & Africa Protein Industry Volume Share (%), by Country 2024 & 2032
- Figure 63: Asia Pacific Protein Industry Revenue (Million), by Source 2024 & 2032
- Figure 64: Asia Pacific Protein Industry Volume (K Tons), by Source 2024 & 2032
- Figure 65: Asia Pacific Protein Industry Revenue Share (%), by Source 2024 & 2032
- Figure 66: Asia Pacific Protein Industry Volume Share (%), by Source 2024 & 2032
- Figure 67: Asia Pacific Protein Industry Revenue (Million), by End User 2024 & 2032
- Figure 68: Asia Pacific Protein Industry Volume (K Tons), by End User 2024 & 2032
- Figure 69: Asia Pacific Protein Industry Revenue Share (%), by End User 2024 & 2032
- Figure 70: Asia Pacific Protein Industry Volume Share (%), by End User 2024 & 2032
- Figure 71: Asia Pacific Protein Industry Revenue (Million), by Country 2024 & 2032
- Figure 72: Asia Pacific Protein Industry Volume (K Tons), by Country 2024 & 2032
- Figure 73: Asia Pacific Protein Industry Revenue Share (%), by Country 2024 & 2032
- Figure 74: Asia Pacific Protein Industry Volume Share (%), by Country 2024 & 2032
List of Tables
- Table 1: Global Protein Industry Revenue Million Forecast, by Region 2019 & 2032
- Table 2: Global Protein Industry Volume K Tons Forecast, by Region 2019 & 2032
- Table 3: Global Protein Industry Revenue Million Forecast, by Source 2019 & 2032
- Table 4: Global Protein Industry Volume K Tons Forecast, by Source 2019 & 2032
- Table 5: Global Protein Industry Revenue Million Forecast, by End User 2019 & 2032
- Table 6: Global Protein Industry Volume K Tons Forecast, by End User 2019 & 2032
- Table 7: Global Protein Industry Revenue Million Forecast, by Region 2019 & 2032
- Table 8: Global Protein Industry Volume K Tons Forecast, by Region 2019 & 2032
- Table 9: Global Protein Industry Revenue Million Forecast, by Country 2019 & 2032
- Table 10: Global Protein Industry Volume K Tons Forecast, by Country 2019 & 2032
- Table 11: Global Protein Industry Revenue Million Forecast, by Country 2019 & 2032
- Table 12: Global Protein Industry Volume K Tons Forecast, by Country 2019 & 2032
- Table 13: Global Protein Industry Revenue Million Forecast, by Country 2019 & 2032
- Table 14: Global Protein Industry Volume K Tons Forecast, by Country 2019 & 2032
- Table 15: Global Protein Industry Revenue Million Forecast, by Source 2019 & 2032
- Table 16: Global Protein Industry Volume K Tons Forecast, by Source 2019 & 2032
- Table 17: Global Protein Industry Revenue Million Forecast, by End User 2019 & 2032
- Table 18: Global Protein Industry Volume K Tons Forecast, by End User 2019 & 2032
- Table 19: Global Protein Industry Revenue Million Forecast, by Country 2019 & 2032
- Table 20: Global Protein Industry Volume K Tons Forecast, by Country 2019 & 2032
- Table 21: United States Protein Industry Revenue (Million) Forecast, by Application 2019 & 2032
- Table 22: United States Protein Industry Volume (K Tons) Forecast, by Application 2019 & 2032
- Table 23: Canada Protein Industry Revenue (Million) Forecast, by Application 2019 & 2032
- Table 24: Canada Protein Industry Volume (K Tons) Forecast, by Application 2019 & 2032
- Table 25: Mexico Protein Industry Revenue (Million) Forecast, by Application 2019 & 2032
- Table 26: Mexico Protein Industry Volume (K Tons) Forecast, by Application 2019 & 2032
- Table 27: Global Protein Industry Revenue Million Forecast, by Source 2019 & 2032
- Table 28: Global Protein Industry Volume K Tons Forecast, by Source 2019 & 2032
- Table 29: Global Protein Industry Revenue Million Forecast, by End User 2019 & 2032
- Table 30: Global Protein Industry Volume K Tons Forecast, by End User 2019 & 2032
- Table 31: Global Protein Industry Revenue Million Forecast, by Country 2019 & 2032
- Table 32: Global Protein Industry Volume K Tons Forecast, by Country 2019 & 2032
- Table 33: Brazil Protein Industry Revenue (Million) Forecast, by Application 2019 & 2032
- Table 34: Brazil Protein Industry Volume (K Tons) Forecast, by Application 2019 & 2032
- Table 35: Argentina Protein Industry Revenue (Million) Forecast, by Application 2019 & 2032
- Table 36: Argentina Protein Industry Volume (K Tons) Forecast, by Application 2019 & 2032
- Table 37: Rest of South America Protein Industry Revenue (Million) Forecast, by Application 2019 & 2032
- Table 38: Rest of South America Protein Industry Volume (K Tons) Forecast, by Application 2019 & 2032
- Table 39: Global Protein Industry Revenue Million Forecast, by Source 2019 & 2032
- Table 40: Global Protein Industry Volume K Tons Forecast, by Source 2019 & 2032
- Table 41: Global Protein Industry Revenue Million Forecast, by End User 2019 & 2032
- Table 42: Global Protein Industry Volume K Tons Forecast, by End User 2019 & 2032
- Table 43: Global Protein Industry Revenue Million Forecast, by Country 2019 & 2032
- Table 44: Global Protein Industry Volume K Tons Forecast, by Country 2019 & 2032
- Table 45: United Kingdom Protein Industry Revenue (Million) Forecast, by Application 2019 & 2032
- Table 46: United Kingdom Protein Industry Volume (K Tons) Forecast, by Application 2019 & 2032
- Table 47: Germany Protein Industry Revenue (Million) Forecast, by Application 2019 & 2032
- Table 48: Germany Protein Industry Volume (K Tons) Forecast, by Application 2019 & 2032
- Table 49: France Protein Industry Revenue (Million) Forecast, by Application 2019 & 2032
- Table 50: France Protein Industry Volume (K Tons) Forecast, by Application 2019 & 2032
- Table 51: Italy Protein Industry Revenue (Million) Forecast, by Application 2019 & 2032
- Table 52: Italy Protein Industry Volume (K Tons) Forecast, by Application 2019 & 2032
- Table 53: Spain Protein Industry Revenue (Million) Forecast, by Application 2019 & 2032
- Table 54: Spain Protein Industry Volume (K Tons) Forecast, by Application 2019 & 2032
- Table 55: Russia Protein Industry Revenue (Million) Forecast, by Application 2019 & 2032
- Table 56: Russia Protein Industry Volume (K Tons) Forecast, by Application 2019 & 2032
- Table 57: Benelux Protein Industry Revenue (Million) Forecast, by Application 2019 & 2032
- Table 58: Benelux Protein Industry Volume (K Tons) Forecast, by Application 2019 & 2032
- Table 59: Nordics Protein Industry Revenue (Million) Forecast, by Application 2019 & 2032
- Table 60: Nordics Protein Industry Volume (K Tons) Forecast, by Application 2019 & 2032
- Table 61: Rest of Europe Protein Industry Revenue (Million) Forecast, by Application 2019 & 2032
- Table 62: Rest of Europe Protein Industry Volume (K Tons) Forecast, by Application 2019 & 2032
- Table 63: Global Protein Industry Revenue Million Forecast, by Source 2019 & 2032
- Table 64: Global Protein Industry Volume K Tons Forecast, by Source 2019 & 2032
- Table 65: Global Protein Industry Revenue Million Forecast, by End User 2019 & 2032
- Table 66: Global Protein Industry Volume K Tons Forecast, by End User 2019 & 2032
- Table 67: Global Protein Industry Revenue Million Forecast, by Country 2019 & 2032
- Table 68: Global Protein Industry Volume K Tons Forecast, by Country 2019 & 2032
- Table 69: Turkey Protein Industry Revenue (Million) Forecast, by Application 2019 & 2032
- Table 70: Turkey Protein Industry Volume (K Tons) Forecast, by Application 2019 & 2032
- Table 71: Israel Protein Industry Revenue (Million) Forecast, by Application 2019 & 2032
- Table 72: Israel Protein Industry Volume (K Tons) Forecast, by Application 2019 & 2032
- Table 73: GCC Protein Industry Revenue (Million) Forecast, by Application 2019 & 2032
- Table 74: GCC Protein Industry Volume (K Tons) Forecast, by Application 2019 & 2032
- Table 75: North Africa Protein Industry Revenue (Million) Forecast, by Application 2019 & 2032
- Table 76: North Africa Protein Industry Volume (K Tons) Forecast, by Application 2019 & 2032
- Table 77: South Africa Protein Industry Revenue (Million) Forecast, by Application 2019 & 2032
- Table 78: South Africa Protein Industry Volume (K Tons) Forecast, by Application 2019 & 2032
- Table 79: Rest of Middle East & Africa Protein Industry Revenue (Million) Forecast, by Application 2019 & 2032
- Table 80: Rest of Middle East & Africa Protein Industry Volume (K Tons) Forecast, by Application 2019 & 2032
- Table 81: Global Protein Industry Revenue Million Forecast, by Source 2019 & 2032
- Table 82: Global Protein Industry Volume K Tons Forecast, by Source 2019 & 2032
- Table 83: Global Protein Industry Revenue Million Forecast, by End User 2019 & 2032
- Table 84: Global Protein Industry Volume K Tons Forecast, by End User 2019 & 2032
- Table 85: Global Protein Industry Revenue Million Forecast, by Country 2019 & 2032
- Table 86: Global Protein Industry Volume K Tons Forecast, by Country 2019 & 2032
- Table 87: China Protein Industry Revenue (Million) Forecast, by Application 2019 & 2032
- Table 88: China Protein Industry Volume (K Tons) Forecast, by Application 2019 & 2032
- Table 89: India Protein Industry Revenue (Million) Forecast, by Application 2019 & 2032
- Table 90: India Protein Industry Volume (K Tons) Forecast, by Application 2019 & 2032
- Table 91: Japan Protein Industry Revenue (Million) Forecast, by Application 2019 & 2032
- Table 92: Japan Protein Industry Volume (K Tons) Forecast, by Application 2019 & 2032
- Table 93: South Korea Protein Industry Revenue (Million) Forecast, by Application 2019 & 2032
- Table 94: South Korea Protein Industry Volume (K Tons) Forecast, by Application 2019 & 2032
- Table 95: ASEAN Protein Industry Revenue (Million) Forecast, by Application 2019 & 2032
- Table 96: ASEAN Protein Industry Volume (K Tons) Forecast, by Application 2019 & 2032
- Table 97: Oceania Protein Industry Revenue (Million) Forecast, by Application 2019 & 2032
- Table 98: Oceania Protein Industry Volume (K Tons) Forecast, by Application 2019 & 2032
- Table 99: Rest of Asia Pacific Protein Industry Revenue (Million) Forecast, by Application 2019 & 2032
- Table 100: Rest of Asia Pacific Protein Industry Volume (K Tons) Forecast, by Application 2019 & 2032
Frequently Asked Questions
1. What is the projected Compound Annual Growth Rate (CAGR) of the Protein Industry?
The projected CAGR is approximately 3.50%.
2. Which companies are prominent players in the Protein Industry?
Key companies in the market include Darling Ingredients Inc, Cargill Incorporated, Gelita AG, International Flavors & Fragrances Inc, Wilmar International Lt, Archer Daniels Midland Company, Glanbia PLC, Bunge Limited, Royal FrieslandCampina NV, Kerry Group PLC, Corbion Biotech Inc, Südzucker AG, Groupe LACTALIS, Fonterra Co-operative Group Limited, Ingredion Incorporated, Roquette Frère, Hilmar Cheese Company Inc, FUJI OIL HOLDINGS INC, Arla Foods AmbA.
3. What are the main segments of the Protein Industry?
The market segments include Source, End User.
4. Can you provide details about the market size?
The market size is estimated to be USD XX Million as of 2022.
5. What are some drivers contributing to market growth?
Increasing Demand For Convenience & Processed Food.
6. What are the notable trends driving market growth?
OTHER KEY INDUSTRY TRENDS COVERED IN THE REPORT.
7. Are there any restraints impacting market growth?
Increased Consumer Awareness On Side-Effects Of Chemical Additives.
8. Can you provide examples of recent developments in the market?
August 2022: Optimum Nutrition announced the launch of its new Gold Standard Protein Shake. The RTD is available in chocolate and vanilla flavors, and formulated with 24 grams of protein per serving.June 2022: Fonterra JV has entered into a joint venture with Tillamook country creamery association(TCCA) and a three-mile canyon farm in the United States to launch Pro-Optima TM, a grade A functional whey protein concentrate (fWPC).November 2021: Lactalis Ingredients launched new high-protein product concepts using Pronativ® Native Micellar Casein and Pronativ® Native Whey Protein. Some of the derived concepts are high-protein shakes and high-protein puddings.
9. What pricing options are available for accessing the report?
Pricing options include single-user, multi-user, and enterprise licenses priced at USD 3800, USD 4500, and USD 5800 respectively.
10. Is the market size provided in terms of value or volume?
The market size is provided in terms of value, measured in Million and volume, measured in K Tons.
11. Are there any specific market keywords associated with the report?
Yes, the market keyword associated with the report is "Protein Industry," which aids in identifying and referencing the specific market segment covered.
12. How do I determine which pricing option suits my needs best?
The pricing options vary based on user requirements and access needs. Individual users may opt for single-user licenses, while businesses requiring broader access may choose multi-user or enterprise licenses for cost-effective access to the report.
13. Are there any additional resources or data provided in the Protein Industry report?
While the report offers comprehensive insights, it's advisable to review the specific contents or supplementary materials provided to ascertain if additional resources or data are available.
14. How can I stay updated on further developments or reports in the Protein Industry?
To stay informed about further developments, trends, and reports in the Protein Industry, consider subscribing to industry newsletters, following relevant companies and organizations, or regularly checking reputable industry news sources and publications.
Methodology
Step 1 - Identification of Relevant Samples Size from Population Database


Step 2 - Approaches for Defining Global Market Size (Value, Volume* & Price*)

Note*: In applicable scenarios
Step 3 - Data Sources
Primary Research
- Web Analytics
- Survey Reports
- Research Institute
- Latest Research Reports
- Opinion Leaders
Secondary Research
- Annual Reports
- White Paper
- Latest Press Release
- Industry Association
- Paid Database
- Investor Presentations

Step 4 - Data Triangulation
Involves using different sources of information in order to increase the validity of a study
These sources are likely to be stakeholders in a program - participants, other researchers, program staff, other community members, and so on.
Then we put all data in single framework & apply various statistical tools to find out the dynamic on the market.
During the analysis stage, feedback from the stakeholder groups would be compared to determine areas of agreement as well as areas of divergence
