

Key Insights
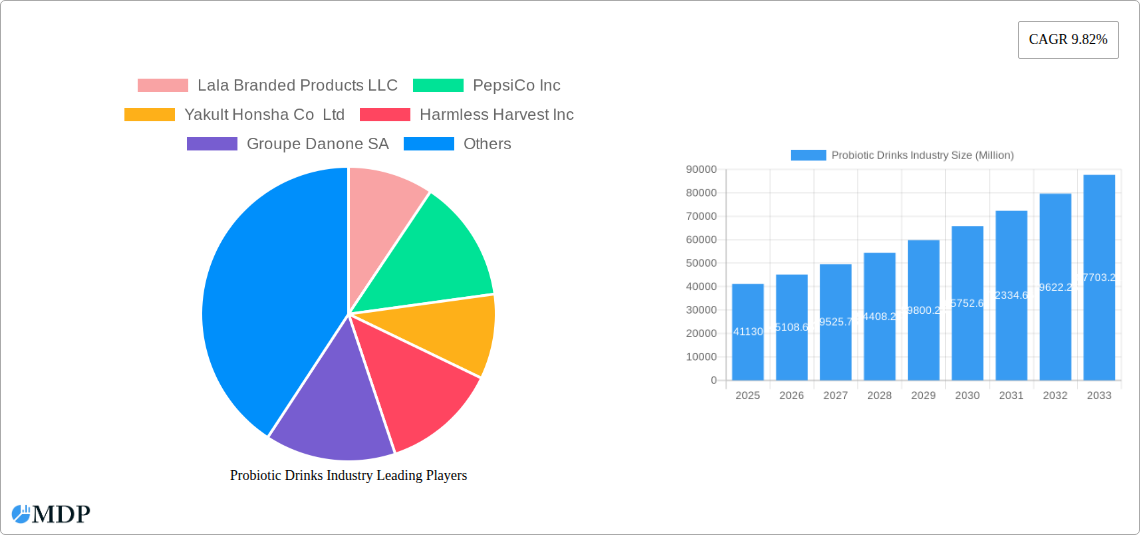
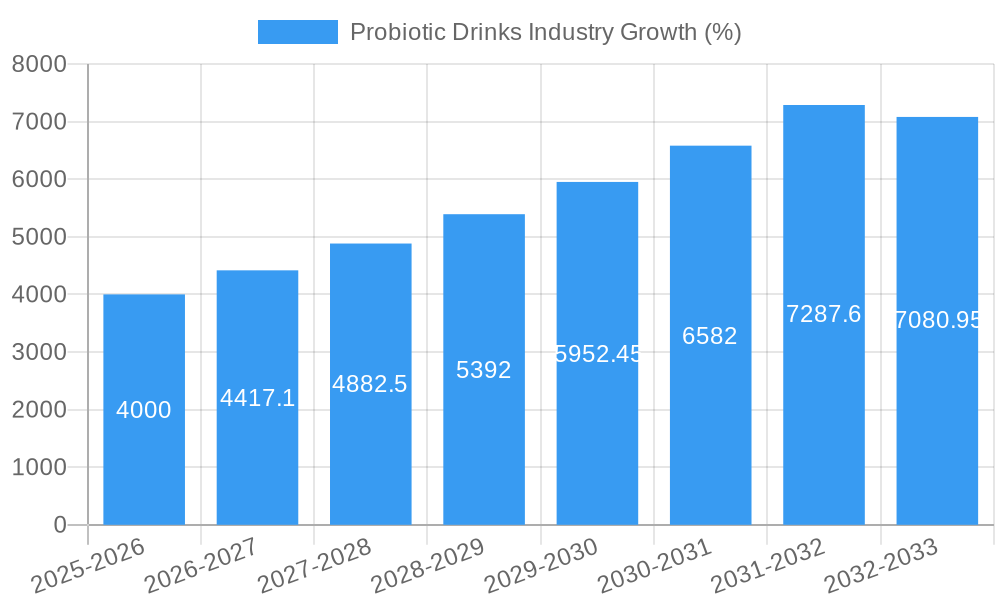
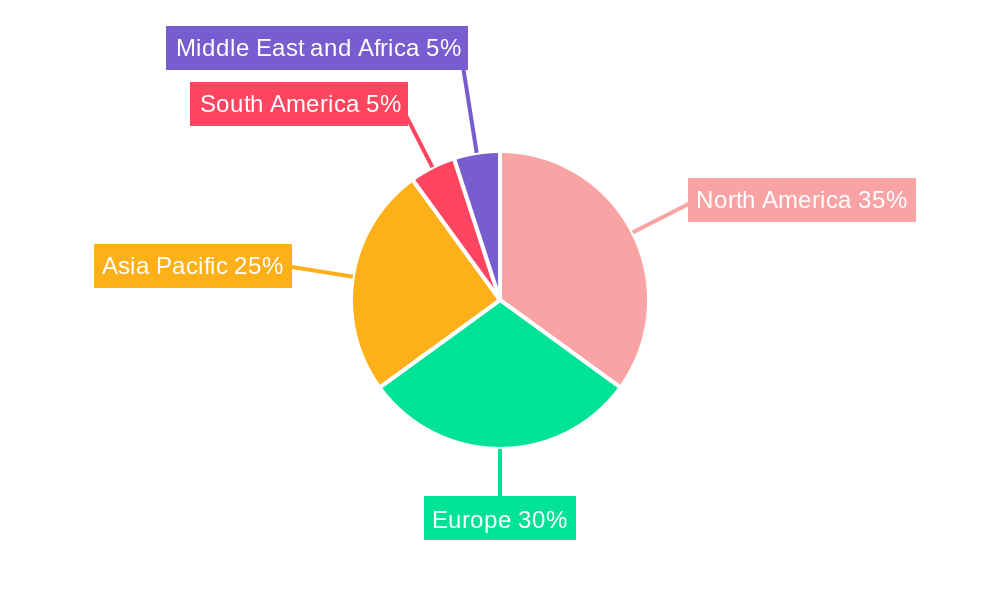
The global probiotic drinks market, valued at $41.13 billion in 2025, is projected to experience robust growth, exhibiting a Compound Annual Growth Rate (CAGR) of 9.82% from 2025 to 2033. This expansion is fueled by several key factors. Rising consumer awareness of gut health and the associated benefits of probiotics is a primary driver. Probiotic drinks offer a convenient and palatable way to incorporate these beneficial bacteria into one's diet, appealing to health-conscious individuals seeking natural ways to improve digestion and boost immunity. The increasing prevalence of chronic diseases linked to gut microbiota imbalances further fuels demand. Furthermore, product innovation, including the introduction of novel flavors, functional formulations (e.g., incorporating prebiotics or other functional ingredients), and convenient packaging formats, are significantly contributing to market growth. The diverse range of product types, from yogurt drinks and fermented milk drinks to kombucha and kefir, caters to varied consumer preferences and dietary needs, broadening market appeal. Significant growth is anticipated across all regions, with North America and Europe expected to maintain strong positions, while Asia Pacific presents a significant growth opportunity due to rising disposable incomes and increasing health awareness.
The market's growth, however, is not without its challenges. Price sensitivity, especially in emerging markets, can pose a restraint. The competitive landscape, characterized by both established multinational corporations and smaller niche players, necessitates constant product innovation and effective marketing strategies for maintaining market share. Moreover, ensuring product quality, maintaining the viability of probiotics during shelf life, and addressing potential consumer concerns regarding safety and efficacy are crucial for sustainable growth. The strategic expansion of distribution channels, including increased presence in supermarkets, convenience stores, and online platforms, will be vital for reaching broader consumer segments. Effective communication emphasizing the scientific evidence supporting the health benefits of probiotic drinks is also essential to further solidify market growth and consumer trust.
Probiotic Drinks Industry: Market Analysis & Forecast (2019-2033)
This comprehensive report provides an in-depth analysis of the global probiotic drinks industry, offering invaluable insights for stakeholders seeking to navigate this dynamic market. With a study period spanning 2019-2033, a base year of 2025, and a forecast period of 2025-2033, this report delivers critical data and actionable strategies for success. The market is valued at xx Million in 2025 and is projected to reach xx Million by 2033, exhibiting a CAGR of xx%.
Probiotic Drinks Industry Market Dynamics & Concentration
The global probiotic drinks market is characterized by a moderately concentrated landscape, with key players like PepsiCo Inc, Groupe Danone SA, and Yakult Honsha Co Ltd holding significant market share. However, smaller, specialized companies are also making inroads, driving innovation and diversification. Market concentration is estimated at xx%, with the top five players accounting for xx% of total revenue in 2024. Innovation is fueled by consumer demand for healthier beverages, leading to the development of novel product formulations and functional benefits. Regulatory frameworks, particularly regarding health claims and labeling, play a crucial role in shaping market dynamics. The presence of substitute beverages, such as traditional juices and soft drinks, exerts competitive pressure. End-user trends, such as increasing health consciousness and a growing preference for natural and functional foods, are major growth drivers. M&A activity has been moderate in recent years, with xx deals recorded between 2019 and 2024, signaling a consolidation trend within the industry.
- Market Concentration: xx% in 2024.
- Top 5 Players Market Share: xx% in 2024.
- M&A Deals (2019-2024): xx
Probiotic Drinks Industry Industry Trends & Analysis
The probiotic drinks market is experiencing robust growth, driven by several key factors. Rising consumer awareness of gut health and its impact on overall well-being is a primary driver. The increasing prevalence of digestive disorders is further fueling demand for probiotic-rich beverages. Technological advancements in fermentation processes and probiotic strain development are enhancing product quality and efficacy. Consumer preferences are shifting towards natural, organic, and minimally processed probiotic drinks. The competitive landscape is marked by intense innovation, with companies continuously launching new products with enhanced functionalities and appealing flavors. The market penetration of probiotic drinks is increasing steadily across various demographics, with a significant rise in consumption among health-conscious millennials and Gen Z consumers. The industry is expected to witness a CAGR of xx% during the forecast period (2025-2033).
Leading Markets & Segments in Probiotic Drinks Industry
The North American and European markets currently dominate the global probiotic drinks industry, driven by high consumer awareness, strong regulatory frameworks, and established distribution networks. However, Asia-Pacific is showing significant growth potential due to rising disposable incomes and increasing health consciousness.
Leading Segments:
- Product Type: Yogurt drinks hold the largest market share, followed by fermented milk drinks. Kombucha and kefir are witnessing substantial growth.
- Distribution Channel: Supermarkets/hypermarkets remain the dominant distribution channel, but convenience stores and pharmacies/health stores are gaining importance.
Key Drivers by Region:
- North America: Strong consumer demand for functional beverages, robust infrastructure.
- Europe: High health consciousness, stringent regulations driving product quality.
- Asia-Pacific: Rising disposable incomes, growing awareness of health benefits.
Probiotic Drinks Industry Product Developments
Recent product innovations focus on enhanced flavor profiles, convenient packaging formats (e.g., single-serve bottles, on-the-go pouches), and the incorporation of additional functional ingredients (e.g., vitamins, prebiotics) to cater to evolving consumer needs. Technological advancements in fermentation techniques are leading to more stable and shelf-stable products. Companies are increasingly emphasizing the unique health benefits of specific probiotic strains, leveraging scientific research to support their claims.
Key Drivers of Probiotic Drinks Industry Growth
The growth of the probiotic drinks market is primarily driven by:
- Rising Health Consciousness: Consumers are increasingly aware of the link between gut health and overall wellness.
- Technological Advancements: Improvements in fermentation and probiotic strain development are leading to better products.
- Favorable Regulatory Environment: Regulations support the development and marketing of functional beverages.
Challenges in the Probiotic Drinks Industry Market
The industry faces challenges such as:
- Stringent Regulations: Strict health and safety regulations can increase product development costs.
- Supply Chain Disruptions: Fluctuations in raw material prices and availability can impact production costs.
- Intense Competition: The market is highly competitive, with both established players and new entrants vying for market share.
Emerging Opportunities in Probiotic Drinks Industry
Future growth will be fueled by:
- Expansion into Emerging Markets: Untapped potential exists in developing economies with growing consumer bases.
- Strategic Partnerships: Collaborations between probiotic manufacturers and food and beverage companies can lead to wider product distribution.
- Innovation in Product Formulation: Developing new product categories and flavors will attract new customers.
Leading Players in the Probiotic Drinks Industry Sector
- Lala Branded Products LLC
- PepsiCo Inc
- Yakult Honsha Co Ltd
- Harmless Harvest Inc
- Groupe Danone SA
- Lifeway Foods Inc
- Kerry Group PLC (Bio-K Plus International Inc)
- Obi Probiotic Soda
- Fonterra Co-op Group Ltd
- Groupe Lactalis
Key Milestones in Probiotic Drinks Industry Industry
- July 2021: PepsiCo launched KeVita Prebiotic Shots, expanding into the on-the-go functional beverage market.
- May 2022: Fonterra launched Nurture cultured milk in Singapore, targeting the health-conscious consumer base.
- June 2022: Danone launched Activa+, a multi-benefit drinkable yogurt, adding to their product portfolio.
Strategic Outlook for Probiotic Drinks Industry Market
The probiotic drinks market is poised for continued growth, driven by innovation, expanding distribution channels, and increasing consumer demand for healthy and functional beverages. Strategic partnerships and expansion into new markets present significant opportunities for growth. Focus on personalized nutrition and product diversification will be key to long-term success.
Probiotic Drinks Industry Segmentation
-
1. Product Type
- 1.1. Yogurt Drinks
- 1.2. Fermented Milk Drinks
- 1.3. Kombucha
- 1.4. Kefir
- 1.5. Probiotics Juices
- 1.6. Other Product Types
-
2. Distribution Channel
- 2.1. Supermarkets/Hypermarkets
- 2.2. Convenience Stores
- 2.3. Pharmacies/Health Stores
- 2.4. Other Distribution Channels
Probiotic Drinks Industry Segmentation By Geography
-
1. North America
- 1.1. United States
- 1.2. Canada
- 1.3. Mexico
- 1.4. Rest of North America
-
2. Europe
- 2.1. United Kingdom
- 2.2. France
- 2.3. Germany
- 2.4. Italy
- 2.5. Spain
- 2.6. Russia
- 2.7. Rest of Europe
-
3. Asia Pacific
- 3.1. China
- 3.2. Japan
- 3.3. Australia
- 3.4. India
- 3.5. Rest of Asia Pacific
-
4. South America
- 4.1. Brazil
- 4.2. Argentina
- 4.3. Rest of South America
-
5. Middle East and Africa
- 5.1. South Africa
- 5.2. United Arab Emirates
- 5.3. Rest of Middle East and Africa
Probiotic Drinks Industry REPORT HIGHLIGHTS
| Aspects | Details |
|---|---|
| Study Period | 2019-2033 |
| Base Year | 2024 |
| Estimated Year | 2025 |
| Forecast Period | 2025-2033 |
| Historical Period | 2019-2024 |
| Growth Rate | CAGR of 9.82% from 2019-2033 |
| Segmentation |
|
Table of Contents
- 1. Introduction
- 1.1. Research Scope
- 1.2. Market Segmentation
- 1.3. Research Methodology
- 1.4. Definitions and Assumptions
- 2. Executive Summary
- 2.1. Introduction
- 3. Market Dynamics
- 3.1. Introduction
- 3.2. Market Drivers
- 3.2.1. Increasing Demand for Protein Rich Food and Supplements; Increasing Application of Collagen in Personal Care Products
- 3.3. Market Restrains
- 3.3.1. Increasing Demand for Plant-Based Protein
- 3.4. Market Trends
- 3.4.1. Growing Demand for Functional Beverages
- 4. Market Factor Analysis
- 4.1. Porters Five Forces
- 4.2. Supply/Value Chain
- 4.3. PESTEL analysis
- 4.4. Market Entropy
- 4.5. Patent/Trademark Analysis
- 5. Global Probiotic Drinks Industry Analysis, Insights and Forecast, 2019-2031
- 5.1. Market Analysis, Insights and Forecast - by Product Type
- 5.1.1. Yogurt Drinks
- 5.1.2. Fermented Milk Drinks
- 5.1.3. Kombucha
- 5.1.4. Kefir
- 5.1.5. Probiotics Juices
- 5.1.6. Other Product Types
- 5.2. Market Analysis, Insights and Forecast - by Distribution Channel
- 5.2.1. Supermarkets/Hypermarkets
- 5.2.2. Convenience Stores
- 5.2.3. Pharmacies/Health Stores
- 5.2.4. Other Distribution Channels
- 5.3. Market Analysis, Insights and Forecast - by Region
- 5.3.1. North America
- 5.3.2. Europe
- 5.3.3. Asia Pacific
- 5.3.4. South America
- 5.3.5. Middle East and Africa
- 5.1. Market Analysis, Insights and Forecast - by Product Type
- 6. North America Probiotic Drinks Industry Analysis, Insights and Forecast, 2019-2031
- 6.1. Market Analysis, Insights and Forecast - by Product Type
- 6.1.1. Yogurt Drinks
- 6.1.2. Fermented Milk Drinks
- 6.1.3. Kombucha
- 6.1.4. Kefir
- 6.1.5. Probiotics Juices
- 6.1.6. Other Product Types
- 6.2. Market Analysis, Insights and Forecast - by Distribution Channel
- 6.2.1. Supermarkets/Hypermarkets
- 6.2.2. Convenience Stores
- 6.2.3. Pharmacies/Health Stores
- 6.2.4. Other Distribution Channels
- 6.1. Market Analysis, Insights and Forecast - by Product Type
- 7. Europe Probiotic Drinks Industry Analysis, Insights and Forecast, 2019-2031
- 7.1. Market Analysis, Insights and Forecast - by Product Type
- 7.1.1. Yogurt Drinks
- 7.1.2. Fermented Milk Drinks
- 7.1.3. Kombucha
- 7.1.4. Kefir
- 7.1.5. Probiotics Juices
- 7.1.6. Other Product Types
- 7.2. Market Analysis, Insights and Forecast - by Distribution Channel
- 7.2.1. Supermarkets/Hypermarkets
- 7.2.2. Convenience Stores
- 7.2.3. Pharmacies/Health Stores
- 7.2.4. Other Distribution Channels
- 7.1. Market Analysis, Insights and Forecast - by Product Type
- 8. Asia Pacific Probiotic Drinks Industry Analysis, Insights and Forecast, 2019-2031
- 8.1. Market Analysis, Insights and Forecast - by Product Type
- 8.1.1. Yogurt Drinks
- 8.1.2. Fermented Milk Drinks
- 8.1.3. Kombucha
- 8.1.4. Kefir
- 8.1.5. Probiotics Juices
- 8.1.6. Other Product Types
- 8.2. Market Analysis, Insights and Forecast - by Distribution Channel
- 8.2.1. Supermarkets/Hypermarkets
- 8.2.2. Convenience Stores
- 8.2.3. Pharmacies/Health Stores
- 8.2.4. Other Distribution Channels
- 8.1. Market Analysis, Insights and Forecast - by Product Type
- 9. South America Probiotic Drinks Industry Analysis, Insights and Forecast, 2019-2031
- 9.1. Market Analysis, Insights and Forecast - by Product Type
- 9.1.1. Yogurt Drinks
- 9.1.2. Fermented Milk Drinks
- 9.1.3. Kombucha
- 9.1.4. Kefir
- 9.1.5. Probiotics Juices
- 9.1.6. Other Product Types
- 9.2. Market Analysis, Insights and Forecast - by Distribution Channel
- 9.2.1. Supermarkets/Hypermarkets
- 9.2.2. Convenience Stores
- 9.2.3. Pharmacies/Health Stores
- 9.2.4. Other Distribution Channels
- 9.1. Market Analysis, Insights and Forecast - by Product Type
- 10. Middle East and Africa Probiotic Drinks Industry Analysis, Insights and Forecast, 2019-2031
- 10.1. Market Analysis, Insights and Forecast - by Product Type
- 10.1.1. Yogurt Drinks
- 10.1.2. Fermented Milk Drinks
- 10.1.3. Kombucha
- 10.1.4. Kefir
- 10.1.5. Probiotics Juices
- 10.1.6. Other Product Types
- 10.2. Market Analysis, Insights and Forecast - by Distribution Channel
- 10.2.1. Supermarkets/Hypermarkets
- 10.2.2. Convenience Stores
- 10.2.3. Pharmacies/Health Stores
- 10.2.4. Other Distribution Channels
- 10.1. Market Analysis, Insights and Forecast - by Product Type
- 11. North America Probiotic Drinks Industry Analysis, Insights and Forecast, 2019-2031
- 11.1. Market Analysis, Insights and Forecast - By Country/Sub-region
- 11.1.1 United States
- 11.1.2 Canada
- 11.1.3 Mexico
- 11.1.4 Rest of North America
- 12. Europe Probiotic Drinks Industry Analysis, Insights and Forecast, 2019-2031
- 12.1. Market Analysis, Insights and Forecast - By Country/Sub-region
- 12.1.1 United Kingdom
- 12.1.2 France
- 12.1.3 Germany
- 12.1.4 Italy
- 12.1.5 Spain
- 12.1.6 Russia
- 12.1.7 Rest of Europe
- 13. Asia Pacific Probiotic Drinks Industry Analysis, Insights and Forecast, 2019-2031
- 13.1. Market Analysis, Insights and Forecast - By Country/Sub-region
- 13.1.1 China
- 13.1.2 Japan
- 13.1.3 Australia
- 13.1.4 India
- 13.1.5 Rest of Asia Pacific
- 14. South America Probiotic Drinks Industry Analysis, Insights and Forecast, 2019-2031
- 14.1. Market Analysis, Insights and Forecast - By Country/Sub-region
- 14.1.1 Brazil
- 14.1.2 Argentina
- 14.1.3 Rest of South America
- 15. Middle East and Africa Probiotic Drinks Industry Analysis, Insights and Forecast, 2019-2031
- 15.1. Market Analysis, Insights and Forecast - By Country/Sub-region
- 15.1.1 South Africa
- 15.1.2 United Arab Emirates
- 15.1.3 Rest of Middle East and Africa
- 16. Competitive Analysis
- 16.1. Global Market Share Analysis 2024
- 16.2. Company Profiles
- 16.2.1 Lala Branded Products LLC
- 16.2.1.1. Overview
- 16.2.1.2. Products
- 16.2.1.3. SWOT Analysis
- 16.2.1.4. Recent Developments
- 16.2.1.5. Financials (Based on Availability)
- 16.2.2 PepsiCo Inc
- 16.2.2.1. Overview
- 16.2.2.2. Products
- 16.2.2.3. SWOT Analysis
- 16.2.2.4. Recent Developments
- 16.2.2.5. Financials (Based on Availability)
- 16.2.3 Yakult Honsha Co Ltd
- 16.2.3.1. Overview
- 16.2.3.2. Products
- 16.2.3.3. SWOT Analysis
- 16.2.3.4. Recent Developments
- 16.2.3.5. Financials (Based on Availability)
- 16.2.4 Harmless Harvest Inc
- 16.2.4.1. Overview
- 16.2.4.2. Products
- 16.2.4.3. SWOT Analysis
- 16.2.4.4. Recent Developments
- 16.2.4.5. Financials (Based on Availability)
- 16.2.5 Groupe Danone SA
- 16.2.5.1. Overview
- 16.2.5.2. Products
- 16.2.5.3. SWOT Analysis
- 16.2.5.4. Recent Developments
- 16.2.5.5. Financials (Based on Availability)
- 16.2.6 Lifeway Foods Inc
- 16.2.6.1. Overview
- 16.2.6.2. Products
- 16.2.6.3. SWOT Analysis
- 16.2.6.4. Recent Developments
- 16.2.6.5. Financials (Based on Availability)
- 16.2.7 Kerry Group PLC (Bio-K Plus International Inc )
- 16.2.7.1. Overview
- 16.2.7.2. Products
- 16.2.7.3. SWOT Analysis
- 16.2.7.4. Recent Developments
- 16.2.7.5. Financials (Based on Availability)
- 16.2.8 Obi Probiotic Soda*List Not Exhaustive
- 16.2.8.1. Overview
- 16.2.8.2. Products
- 16.2.8.3. SWOT Analysis
- 16.2.8.4. Recent Developments
- 16.2.8.5. Financials (Based on Availability)
- 16.2.9 Fonterra Co-op Group Ltd
- 16.2.9.1. Overview
- 16.2.9.2. Products
- 16.2.9.3. SWOT Analysis
- 16.2.9.4. Recent Developments
- 16.2.9.5. Financials (Based on Availability)
- 16.2.10 Groupe Lactalis
- 16.2.10.1. Overview
- 16.2.10.2. Products
- 16.2.10.3. SWOT Analysis
- 16.2.10.4. Recent Developments
- 16.2.10.5. Financials (Based on Availability)
- 16.2.1 Lala Branded Products LLC
List of Figures
- Figure 1: Global Probiotic Drinks Industry Revenue Breakdown (Million, %) by Region 2024 & 2032
- Figure 2: Global Probiotic Drinks Industry Volume Breakdown (K Units, %) by Region 2024 & 2032
- Figure 3: North America Probiotic Drinks Industry Revenue (Million), by Country 2024 & 2032
- Figure 4: North America Probiotic Drinks Industry Volume (K Units), by Country 2024 & 2032
- Figure 5: North America Probiotic Drinks Industry Revenue Share (%), by Country 2024 & 2032
- Figure 6: North America Probiotic Drinks Industry Volume Share (%), by Country 2024 & 2032
- Figure 7: Europe Probiotic Drinks Industry Revenue (Million), by Country 2024 & 2032
- Figure 8: Europe Probiotic Drinks Industry Volume (K Units), by Country 2024 & 2032
- Figure 9: Europe Probiotic Drinks Industry Revenue Share (%), by Country 2024 & 2032
- Figure 10: Europe Probiotic Drinks Industry Volume Share (%), by Country 2024 & 2032
- Figure 11: Asia Pacific Probiotic Drinks Industry Revenue (Million), by Country 2024 & 2032
- Figure 12: Asia Pacific Probiotic Drinks Industry Volume (K Units), by Country 2024 & 2032
- Figure 13: Asia Pacific Probiotic Drinks Industry Revenue Share (%), by Country 2024 & 2032
- Figure 14: Asia Pacific Probiotic Drinks Industry Volume Share (%), by Country 2024 & 2032
- Figure 15: South America Probiotic Drinks Industry Revenue (Million), by Country 2024 & 2032
- Figure 16: South America Probiotic Drinks Industry Volume (K Units), by Country 2024 & 2032
- Figure 17: South America Probiotic Drinks Industry Revenue Share (%), by Country 2024 & 2032
- Figure 18: South America Probiotic Drinks Industry Volume Share (%), by Country 2024 & 2032
- Figure 19: Middle East and Africa Probiotic Drinks Industry Revenue (Million), by Country 2024 & 2032
- Figure 20: Middle East and Africa Probiotic Drinks Industry Volume (K Units), by Country 2024 & 2032
- Figure 21: Middle East and Africa Probiotic Drinks Industry Revenue Share (%), by Country 2024 & 2032
- Figure 22: Middle East and Africa Probiotic Drinks Industry Volume Share (%), by Country 2024 & 2032
- Figure 23: North America Probiotic Drinks Industry Revenue (Million), by Product Type 2024 & 2032
- Figure 24: North America Probiotic Drinks Industry Volume (K Units), by Product Type 2024 & 2032
- Figure 25: North America Probiotic Drinks Industry Revenue Share (%), by Product Type 2024 & 2032
- Figure 26: North America Probiotic Drinks Industry Volume Share (%), by Product Type 2024 & 2032
- Figure 27: North America Probiotic Drinks Industry Revenue (Million), by Distribution Channel 2024 & 2032
- Figure 28: North America Probiotic Drinks Industry Volume (K Units), by Distribution Channel 2024 & 2032
- Figure 29: North America Probiotic Drinks Industry Revenue Share (%), by Distribution Channel 2024 & 2032
- Figure 30: North America Probiotic Drinks Industry Volume Share (%), by Distribution Channel 2024 & 2032
- Figure 31: North America Probiotic Drinks Industry Revenue (Million), by Country 2024 & 2032
- Figure 32: North America Probiotic Drinks Industry Volume (K Units), by Country 2024 & 2032
- Figure 33: North America Probiotic Drinks Industry Revenue Share (%), by Country 2024 & 2032
- Figure 34: North America Probiotic Drinks Industry Volume Share (%), by Country 2024 & 2032
- Figure 35: Europe Probiotic Drinks Industry Revenue (Million), by Product Type 2024 & 2032
- Figure 36: Europe Probiotic Drinks Industry Volume (K Units), by Product Type 2024 & 2032
- Figure 37: Europe Probiotic Drinks Industry Revenue Share (%), by Product Type 2024 & 2032
- Figure 38: Europe Probiotic Drinks Industry Volume Share (%), by Product Type 2024 & 2032
- Figure 39: Europe Probiotic Drinks Industry Revenue (Million), by Distribution Channel 2024 & 2032
- Figure 40: Europe Probiotic Drinks Industry Volume (K Units), by Distribution Channel 2024 & 2032
- Figure 41: Europe Probiotic Drinks Industry Revenue Share (%), by Distribution Channel 2024 & 2032
- Figure 42: Europe Probiotic Drinks Industry Volume Share (%), by Distribution Channel 2024 & 2032
- Figure 43: Europe Probiotic Drinks Industry Revenue (Million), by Country 2024 & 2032
- Figure 44: Europe Probiotic Drinks Industry Volume (K Units), by Country 2024 & 2032
- Figure 45: Europe Probiotic Drinks Industry Revenue Share (%), by Country 2024 & 2032
- Figure 46: Europe Probiotic Drinks Industry Volume Share (%), by Country 2024 & 2032
- Figure 47: Asia Pacific Probiotic Drinks Industry Revenue (Million), by Product Type 2024 & 2032
- Figure 48: Asia Pacific Probiotic Drinks Industry Volume (K Units), by Product Type 2024 & 2032
- Figure 49: Asia Pacific Probiotic Drinks Industry Revenue Share (%), by Product Type 2024 & 2032
- Figure 50: Asia Pacific Probiotic Drinks Industry Volume Share (%), by Product Type 2024 & 2032
- Figure 51: Asia Pacific Probiotic Drinks Industry Revenue (Million), by Distribution Channel 2024 & 2032
- Figure 52: Asia Pacific Probiotic Drinks Industry Volume (K Units), by Distribution Channel 2024 & 2032
- Figure 53: Asia Pacific Probiotic Drinks Industry Revenue Share (%), by Distribution Channel 2024 & 2032
- Figure 54: Asia Pacific Probiotic Drinks Industry Volume Share (%), by Distribution Channel 2024 & 2032
- Figure 55: Asia Pacific Probiotic Drinks Industry Revenue (Million), by Country 2024 & 2032
- Figure 56: Asia Pacific Probiotic Drinks Industry Volume (K Units), by Country 2024 & 2032
- Figure 57: Asia Pacific Probiotic Drinks Industry Revenue Share (%), by Country 2024 & 2032
- Figure 58: Asia Pacific Probiotic Drinks Industry Volume Share (%), by Country 2024 & 2032
- Figure 59: South America Probiotic Drinks Industry Revenue (Million), by Product Type 2024 & 2032
- Figure 60: South America Probiotic Drinks Industry Volume (K Units), by Product Type 2024 & 2032
- Figure 61: South America Probiotic Drinks Industry Revenue Share (%), by Product Type 2024 & 2032
- Figure 62: South America Probiotic Drinks Industry Volume Share (%), by Product Type 2024 & 2032
- Figure 63: South America Probiotic Drinks Industry Revenue (Million), by Distribution Channel 2024 & 2032
- Figure 64: South America Probiotic Drinks Industry Volume (K Units), by Distribution Channel 2024 & 2032
- Figure 65: South America Probiotic Drinks Industry Revenue Share (%), by Distribution Channel 2024 & 2032
- Figure 66: South America Probiotic Drinks Industry Volume Share (%), by Distribution Channel 2024 & 2032
- Figure 67: South America Probiotic Drinks Industry Revenue (Million), by Country 2024 & 2032
- Figure 68: South America Probiotic Drinks Industry Volume (K Units), by Country 2024 & 2032
- Figure 69: South America Probiotic Drinks Industry Revenue Share (%), by Country 2024 & 2032
- Figure 70: South America Probiotic Drinks Industry Volume Share (%), by Country 2024 & 2032
- Figure 71: Middle East and Africa Probiotic Drinks Industry Revenue (Million), by Product Type 2024 & 2032
- Figure 72: Middle East and Africa Probiotic Drinks Industry Volume (K Units), by Product Type 2024 & 2032
- Figure 73: Middle East and Africa Probiotic Drinks Industry Revenue Share (%), by Product Type 2024 & 2032
- Figure 74: Middle East and Africa Probiotic Drinks Industry Volume Share (%), by Product Type 2024 & 2032
- Figure 75: Middle East and Africa Probiotic Drinks Industry Revenue (Million), by Distribution Channel 2024 & 2032
- Figure 76: Middle East and Africa Probiotic Drinks Industry Volume (K Units), by Distribution Channel 2024 & 2032
- Figure 77: Middle East and Africa Probiotic Drinks Industry Revenue Share (%), by Distribution Channel 2024 & 2032
- Figure 78: Middle East and Africa Probiotic Drinks Industry Volume Share (%), by Distribution Channel 2024 & 2032
- Figure 79: Middle East and Africa Probiotic Drinks Industry Revenue (Million), by Country 2024 & 2032
- Figure 80: Middle East and Africa Probiotic Drinks Industry Volume (K Units), by Country 2024 & 2032
- Figure 81: Middle East and Africa Probiotic Drinks Industry Revenue Share (%), by Country 2024 & 2032
- Figure 82: Middle East and Africa Probiotic Drinks Industry Volume Share (%), by Country 2024 & 2032
List of Tables
- Table 1: Global Probiotic Drinks Industry Revenue Million Forecast, by Region 2019 & 2032
- Table 2: Global Probiotic Drinks Industry Volume K Units Forecast, by Region 2019 & 2032
- Table 3: Global Probiotic Drinks Industry Revenue Million Forecast, by Product Type 2019 & 2032
- Table 4: Global Probiotic Drinks Industry Volume K Units Forecast, by Product Type 2019 & 2032
- Table 5: Global Probiotic Drinks Industry Revenue Million Forecast, by Distribution Channel 2019 & 2032
- Table 6: Global Probiotic Drinks Industry Volume K Units Forecast, by Distribution Channel 2019 & 2032
- Table 7: Global Probiotic Drinks Industry Revenue Million Forecast, by Region 2019 & 2032
- Table 8: Global Probiotic Drinks Industry Volume K Units Forecast, by Region 2019 & 2032
- Table 9: Global Probiotic Drinks Industry Revenue Million Forecast, by Country 2019 & 2032
- Table 10: Global Probiotic Drinks Industry Volume K Units Forecast, by Country 2019 & 2032
- Table 11: United States Probiotic Drinks Industry Revenue (Million) Forecast, by Application 2019 & 2032
- Table 12: United States Probiotic Drinks Industry Volume (K Units) Forecast, by Application 2019 & 2032
- Table 13: Canada Probiotic Drinks Industry Revenue (Million) Forecast, by Application 2019 & 2032
- Table 14: Canada Probiotic Drinks Industry Volume (K Units) Forecast, by Application 2019 & 2032
- Table 15: Mexico Probiotic Drinks Industry Revenue (Million) Forecast, by Application 2019 & 2032
- Table 16: Mexico Probiotic Drinks Industry Volume (K Units) Forecast, by Application 2019 & 2032
- Table 17: Rest of North America Probiotic Drinks Industry Revenue (Million) Forecast, by Application 2019 & 2032
- Table 18: Rest of North America Probiotic Drinks Industry Volume (K Units) Forecast, by Application 2019 & 2032
- Table 19: Global Probiotic Drinks Industry Revenue Million Forecast, by Country 2019 & 2032
- Table 20: Global Probiotic Drinks Industry Volume K Units Forecast, by Country 2019 & 2032
- Table 21: United Kingdom Probiotic Drinks Industry Revenue (Million) Forecast, by Application 2019 & 2032
- Table 22: United Kingdom Probiotic Drinks Industry Volume (K Units) Forecast, by Application 2019 & 2032
- Table 23: France Probiotic Drinks Industry Revenue (Million) Forecast, by Application 2019 & 2032
- Table 24: France Probiotic Drinks Industry Volume (K Units) Forecast, by Application 2019 & 2032
- Table 25: Germany Probiotic Drinks Industry Revenue (Million) Forecast, by Application 2019 & 2032
- Table 26: Germany Probiotic Drinks Industry Volume (K Units) Forecast, by Application 2019 & 2032
- Table 27: Italy Probiotic Drinks Industry Revenue (Million) Forecast, by Application 2019 & 2032
- Table 28: Italy Probiotic Drinks Industry Volume (K Units) Forecast, by Application 2019 & 2032
- Table 29: Spain Probiotic Drinks Industry Revenue (Million) Forecast, by Application 2019 & 2032
- Table 30: Spain Probiotic Drinks Industry Volume (K Units) Forecast, by Application 2019 & 2032
- Table 31: Russia Probiotic Drinks Industry Revenue (Million) Forecast, by Application 2019 & 2032
- Table 32: Russia Probiotic Drinks Industry Volume (K Units) Forecast, by Application 2019 & 2032
- Table 33: Rest of Europe Probiotic Drinks Industry Revenue (Million) Forecast, by Application 2019 & 2032
- Table 34: Rest of Europe Probiotic Drinks Industry Volume (K Units) Forecast, by Application 2019 & 2032
- Table 35: Global Probiotic Drinks Industry Revenue Million Forecast, by Country 2019 & 2032
- Table 36: Global Probiotic Drinks Industry Volume K Units Forecast, by Country 2019 & 2032
- Table 37: China Probiotic Drinks Industry Revenue (Million) Forecast, by Application 2019 & 2032
- Table 38: China Probiotic Drinks Industry Volume (K Units) Forecast, by Application 2019 & 2032
- Table 39: Japan Probiotic Drinks Industry Revenue (Million) Forecast, by Application 2019 & 2032
- Table 40: Japan Probiotic Drinks Industry Volume (K Units) Forecast, by Application 2019 & 2032
- Table 41: Australia Probiotic Drinks Industry Revenue (Million) Forecast, by Application 2019 & 2032
- Table 42: Australia Probiotic Drinks Industry Volume (K Units) Forecast, by Application 2019 & 2032
- Table 43: India Probiotic Drinks Industry Revenue (Million) Forecast, by Application 2019 & 2032
- Table 44: India Probiotic Drinks Industry Volume (K Units) Forecast, by Application 2019 & 2032
- Table 45: Rest of Asia Pacific Probiotic Drinks Industry Revenue (Million) Forecast, by Application 2019 & 2032
- Table 46: Rest of Asia Pacific Probiotic Drinks Industry Volume (K Units) Forecast, by Application 2019 & 2032
- Table 47: Global Probiotic Drinks Industry Revenue Million Forecast, by Country 2019 & 2032
- Table 48: Global Probiotic Drinks Industry Volume K Units Forecast, by Country 2019 & 2032
- Table 49: Brazil Probiotic Drinks Industry Revenue (Million) Forecast, by Application 2019 & 2032
- Table 50: Brazil Probiotic Drinks Industry Volume (K Units) Forecast, by Application 2019 & 2032
- Table 51: Argentina Probiotic Drinks Industry Revenue (Million) Forecast, by Application 2019 & 2032
- Table 52: Argentina Probiotic Drinks Industry Volume (K Units) Forecast, by Application 2019 & 2032
- Table 53: Rest of South America Probiotic Drinks Industry Revenue (Million) Forecast, by Application 2019 & 2032
- Table 54: Rest of South America Probiotic Drinks Industry Volume (K Units) Forecast, by Application 2019 & 2032
- Table 55: Global Probiotic Drinks Industry Revenue Million Forecast, by Country 2019 & 2032
- Table 56: Global Probiotic Drinks Industry Volume K Units Forecast, by Country 2019 & 2032
- Table 57: South Africa Probiotic Drinks Industry Revenue (Million) Forecast, by Application 2019 & 2032
- Table 58: South Africa Probiotic Drinks Industry Volume (K Units) Forecast, by Application 2019 & 2032
- Table 59: United Arab Emirates Probiotic Drinks Industry Revenue (Million) Forecast, by Application 2019 & 2032
- Table 60: United Arab Emirates Probiotic Drinks Industry Volume (K Units) Forecast, by Application 2019 & 2032
- Table 61: Rest of Middle East and Africa Probiotic Drinks Industry Revenue (Million) Forecast, by Application 2019 & 2032
- Table 62: Rest of Middle East and Africa Probiotic Drinks Industry Volume (K Units) Forecast, by Application 2019 & 2032
- Table 63: Global Probiotic Drinks Industry Revenue Million Forecast, by Product Type 2019 & 2032
- Table 64: Global Probiotic Drinks Industry Volume K Units Forecast, by Product Type 2019 & 2032
- Table 65: Global Probiotic Drinks Industry Revenue Million Forecast, by Distribution Channel 2019 & 2032
- Table 66: Global Probiotic Drinks Industry Volume K Units Forecast, by Distribution Channel 2019 & 2032
- Table 67: Global Probiotic Drinks Industry Revenue Million Forecast, by Country 2019 & 2032
- Table 68: Global Probiotic Drinks Industry Volume K Units Forecast, by Country 2019 & 2032
- Table 69: United States Probiotic Drinks Industry Revenue (Million) Forecast, by Application 2019 & 2032
- Table 70: United States Probiotic Drinks Industry Volume (K Units) Forecast, by Application 2019 & 2032
- Table 71: Canada Probiotic Drinks Industry Revenue (Million) Forecast, by Application 2019 & 2032
- Table 72: Canada Probiotic Drinks Industry Volume (K Units) Forecast, by Application 2019 & 2032
- Table 73: Mexico Probiotic Drinks Industry Revenue (Million) Forecast, by Application 2019 & 2032
- Table 74: Mexico Probiotic Drinks Industry Volume (K Units) Forecast, by Application 2019 & 2032
- Table 75: Rest of North America Probiotic Drinks Industry Revenue (Million) Forecast, by Application 2019 & 2032
- Table 76: Rest of North America Probiotic Drinks Industry Volume (K Units) Forecast, by Application 2019 & 2032
- Table 77: Global Probiotic Drinks Industry Revenue Million Forecast, by Product Type 2019 & 2032
- Table 78: Global Probiotic Drinks Industry Volume K Units Forecast, by Product Type 2019 & 2032
- Table 79: Global Probiotic Drinks Industry Revenue Million Forecast, by Distribution Channel 2019 & 2032
- Table 80: Global Probiotic Drinks Industry Volume K Units Forecast, by Distribution Channel 2019 & 2032
- Table 81: Global Probiotic Drinks Industry Revenue Million Forecast, by Country 2019 & 2032
- Table 82: Global Probiotic Drinks Industry Volume K Units Forecast, by Country 2019 & 2032
- Table 83: United Kingdom Probiotic Drinks Industry Revenue (Million) Forecast, by Application 2019 & 2032
- Table 84: United Kingdom Probiotic Drinks Industry Volume (K Units) Forecast, by Application 2019 & 2032
- Table 85: France Probiotic Drinks Industry Revenue (Million) Forecast, by Application 2019 & 2032
- Table 86: France Probiotic Drinks Industry Volume (K Units) Forecast, by Application 2019 & 2032
- Table 87: Germany Probiotic Drinks Industry Revenue (Million) Forecast, by Application 2019 & 2032
- Table 88: Germany Probiotic Drinks Industry Volume (K Units) Forecast, by Application 2019 & 2032
- Table 89: Italy Probiotic Drinks Industry Revenue (Million) Forecast, by Application 2019 & 2032
- Table 90: Italy Probiotic Drinks Industry Volume (K Units) Forecast, by Application 2019 & 2032
- Table 91: Spain Probiotic Drinks Industry Revenue (Million) Forecast, by Application 2019 & 2032
- Table 92: Spain Probiotic Drinks Industry Volume (K Units) Forecast, by Application 2019 & 2032
- Table 93: Russia Probiotic Drinks Industry Revenue (Million) Forecast, by Application 2019 & 2032
- Table 94: Russia Probiotic Drinks Industry Volume (K Units) Forecast, by Application 2019 & 2032
- Table 95: Rest of Europe Probiotic Drinks Industry Revenue (Million) Forecast, by Application 2019 & 2032
- Table 96: Rest of Europe Probiotic Drinks Industry Volume (K Units) Forecast, by Application 2019 & 2032
- Table 97: Global Probiotic Drinks Industry Revenue Million Forecast, by Product Type 2019 & 2032
- Table 98: Global Probiotic Drinks Industry Volume K Units Forecast, by Product Type 2019 & 2032
- Table 99: Global Probiotic Drinks Industry Revenue Million Forecast, by Distribution Channel 2019 & 2032
- Table 100: Global Probiotic Drinks Industry Volume K Units Forecast, by Distribution Channel 2019 & 2032
- Table 101: Global Probiotic Drinks Industry Revenue Million Forecast, by Country 2019 & 2032
- Table 102: Global Probiotic Drinks Industry Volume K Units Forecast, by Country 2019 & 2032
- Table 103: China Probiotic Drinks Industry Revenue (Million) Forecast, by Application 2019 & 2032
- Table 104: China Probiotic Drinks Industry Volume (K Units) Forecast, by Application 2019 & 2032
- Table 105: Japan Probiotic Drinks Industry Revenue (Million) Forecast, by Application 2019 & 2032
- Table 106: Japan Probiotic Drinks Industry Volume (K Units) Forecast, by Application 2019 & 2032
- Table 107: Australia Probiotic Drinks Industry Revenue (Million) Forecast, by Application 2019 & 2032
- Table 108: Australia Probiotic Drinks Industry Volume (K Units) Forecast, by Application 2019 & 2032
- Table 109: India Probiotic Drinks Industry Revenue (Million) Forecast, by Application 2019 & 2032
- Table 110: India Probiotic Drinks Industry Volume (K Units) Forecast, by Application 2019 & 2032
- Table 111: Rest of Asia Pacific Probiotic Drinks Industry Revenue (Million) Forecast, by Application 2019 & 2032
- Table 112: Rest of Asia Pacific Probiotic Drinks Industry Volume (K Units) Forecast, by Application 2019 & 2032
- Table 113: Global Probiotic Drinks Industry Revenue Million Forecast, by Product Type 2019 & 2032
- Table 114: Global Probiotic Drinks Industry Volume K Units Forecast, by Product Type 2019 & 2032
- Table 115: Global Probiotic Drinks Industry Revenue Million Forecast, by Distribution Channel 2019 & 2032
- Table 116: Global Probiotic Drinks Industry Volume K Units Forecast, by Distribution Channel 2019 & 2032
- Table 117: Global Probiotic Drinks Industry Revenue Million Forecast, by Country 2019 & 2032
- Table 118: Global Probiotic Drinks Industry Volume K Units Forecast, by Country 2019 & 2032
- Table 119: Brazil Probiotic Drinks Industry Revenue (Million) Forecast, by Application 2019 & 2032
- Table 120: Brazil Probiotic Drinks Industry Volume (K Units) Forecast, by Application 2019 & 2032
- Table 121: Argentina Probiotic Drinks Industry Revenue (Million) Forecast, by Application 2019 & 2032
- Table 122: Argentina Probiotic Drinks Industry Volume (K Units) Forecast, by Application 2019 & 2032
- Table 123: Rest of South America Probiotic Drinks Industry Revenue (Million) Forecast, by Application 2019 & 2032
- Table 124: Rest of South America Probiotic Drinks Industry Volume (K Units) Forecast, by Application 2019 & 2032
- Table 125: Global Probiotic Drinks Industry Revenue Million Forecast, by Product Type 2019 & 2032
- Table 126: Global Probiotic Drinks Industry Volume K Units Forecast, by Product Type 2019 & 2032
- Table 127: Global Probiotic Drinks Industry Revenue Million Forecast, by Distribution Channel 2019 & 2032
- Table 128: Global Probiotic Drinks Industry Volume K Units Forecast, by Distribution Channel 2019 & 2032
- Table 129: Global Probiotic Drinks Industry Revenue Million Forecast, by Country 2019 & 2032
- Table 130: Global Probiotic Drinks Industry Volume K Units Forecast, by Country 2019 & 2032
- Table 131: South Africa Probiotic Drinks Industry Revenue (Million) Forecast, by Application 2019 & 2032
- Table 132: South Africa Probiotic Drinks Industry Volume (K Units) Forecast, by Application 2019 & 2032
- Table 133: United Arab Emirates Probiotic Drinks Industry Revenue (Million) Forecast, by Application 2019 & 2032
- Table 134: United Arab Emirates Probiotic Drinks Industry Volume (K Units) Forecast, by Application 2019 & 2032
- Table 135: Rest of Middle East and Africa Probiotic Drinks Industry Revenue (Million) Forecast, by Application 2019 & 2032
- Table 136: Rest of Middle East and Africa Probiotic Drinks Industry Volume (K Units) Forecast, by Application 2019 & 2032
Frequently Asked Questions
1. What is the projected Compound Annual Growth Rate (CAGR) of the Probiotic Drinks Industry?
The projected CAGR is approximately 9.82%.
2. Which companies are prominent players in the Probiotic Drinks Industry?
Key companies in the market include Lala Branded Products LLC, PepsiCo Inc, Yakult Honsha Co Ltd, Harmless Harvest Inc, Groupe Danone SA, Lifeway Foods Inc, Kerry Group PLC (Bio-K Plus International Inc ), Obi Probiotic Soda*List Not Exhaustive, Fonterra Co-op Group Ltd, Groupe Lactalis.
3. What are the main segments of the Probiotic Drinks Industry?
The market segments include Product Type, Distribution Channel.
4. Can you provide details about the market size?
The market size is estimated to be USD 41.13 Million as of 2022.
5. What are some drivers contributing to market growth?
Increasing Demand for Protein Rich Food and Supplements; Increasing Application of Collagen in Personal Care Products.
6. What are the notable trends driving market growth?
Growing Demand for Functional Beverages.
7. Are there any restraints impacting market growth?
Increasing Demand for Plant-Based Protein.
8. Can you provide examples of recent developments in the market?
June 2022: Danone launched the new drinkable yogurt Activa+. Activa+ is a multi-benefit drinkable yogurt made with active probiotic vitamins A, D, and zinc. The product is available in different flavors like raspberry, peach, and strawberry.
9. What pricing options are available for accessing the report?
Pricing options include single-user, multi-user, and enterprise licenses priced at USD 4750, USD 5250, and USD 8750 respectively.
10. Is the market size provided in terms of value or volume?
The market size is provided in terms of value, measured in Million and volume, measured in K Units.
11. Are there any specific market keywords associated with the report?
Yes, the market keyword associated with the report is "Probiotic Drinks Industry," which aids in identifying and referencing the specific market segment covered.
12. How do I determine which pricing option suits my needs best?
The pricing options vary based on user requirements and access needs. Individual users may opt for single-user licenses, while businesses requiring broader access may choose multi-user or enterprise licenses for cost-effective access to the report.
13. Are there any additional resources or data provided in the Probiotic Drinks Industry report?
While the report offers comprehensive insights, it's advisable to review the specific contents or supplementary materials provided to ascertain if additional resources or data are available.
14. How can I stay updated on further developments or reports in the Probiotic Drinks Industry?
To stay informed about further developments, trends, and reports in the Probiotic Drinks Industry, consider subscribing to industry newsletters, following relevant companies and organizations, or regularly checking reputable industry news sources and publications.
Methodology
Step 1 - Identification of Relevant Samples Size from Population Database


Step 2 - Approaches for Defining Global Market Size (Value, Volume* & Price*)

Note*: In applicable scenarios
Step 3 - Data Sources
Primary Research
- Web Analytics
- Survey Reports
- Research Institute
- Latest Research Reports
- Opinion Leaders
Secondary Research
- Annual Reports
- White Paper
- Latest Press Release
- Industry Association
- Paid Database
- Investor Presentations

Step 4 - Data Triangulation
Involves using different sources of information in order to increase the validity of a study
These sources are likely to be stakeholders in a program - participants, other researchers, program staff, other community members, and so on.
Then we put all data in single framework & apply various statistical tools to find out the dynamic on the market.
During the analysis stage, feedback from the stakeholder groups would be compared to determine areas of agreement as well as areas of divergence
