

Key Insights
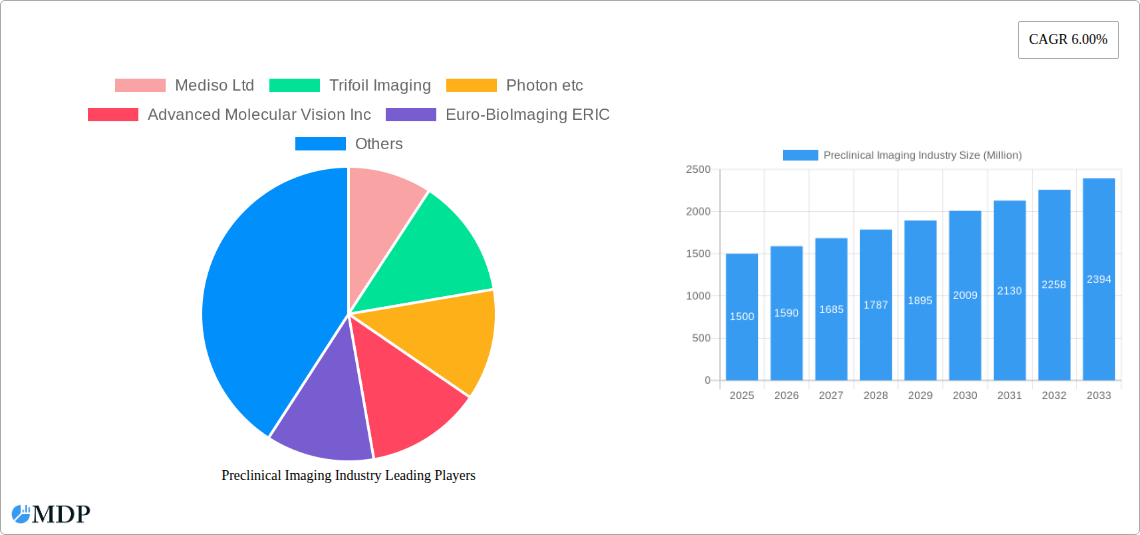
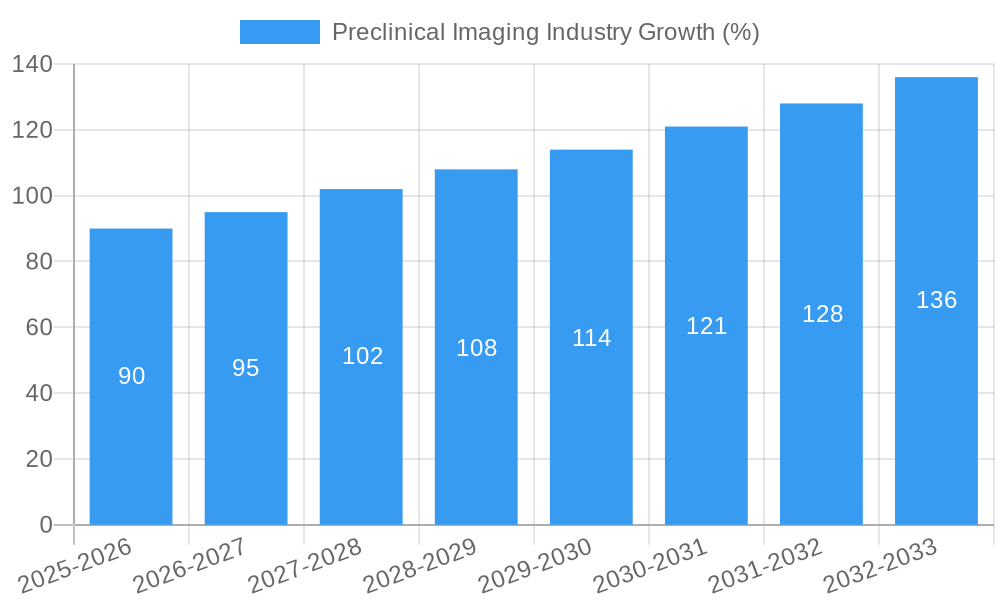
The preclinical imaging market, valued at approximately $1.5 billion in 2025, is projected to experience robust growth, exhibiting a compound annual growth rate (CAGR) of 6% from 2025 to 2033. This expansion is driven by several key factors. Firstly, the increasing demand for advanced preclinical imaging modalities, such as optical imaging systems, micro-MRI, and micro-CT, is fueling market growth. These technologies offer high-resolution images enabling researchers to study disease progression, drug efficacy, and therapeutic responses with greater precision. Secondly, the rising prevalence of chronic diseases like cancer and cardiovascular ailments is driving the development of novel therapeutics and diagnostic tools. This surge in research and development necessitates advanced preclinical imaging to accelerate the drug discovery and development process. Furthermore, technological advancements in areas like AI-powered image analysis are enhancing the efficiency and accuracy of preclinical studies, further propelling market growth.
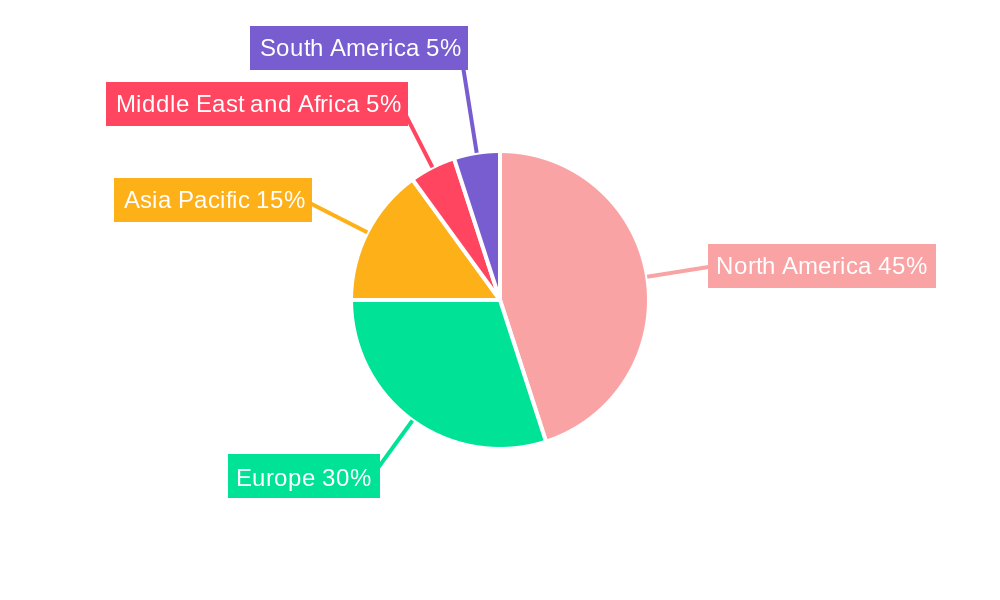
However, the market faces certain restraints. High capital investment costs associated with advanced imaging systems, coupled with the complex and specialized training required for their operation, might limit broader adoption, particularly within smaller research institutions or those in developing regions. Regulatory hurdles and lengthy approval processes for new imaging technologies also present challenges. Despite these constraints, the market's positive growth trajectory is expected to continue, fueled by ongoing technological innovations, expanding research activities, and the imperative to improve healthcare outcomes through effective drug development and personalized medicine. The increasing adoption of preclinical imaging across various research areas, including oncology, neurology, and cardiology, will contribute significantly to the market's sustained growth throughout the forecast period. North America is expected to dominate the market initially, followed by Europe and Asia-Pacific, with emerging markets in the Middle East and Africa and South America exhibiting strong growth potential in later years.
Preclinical Imaging Industry: Market Report 2019-2033
This comprehensive report provides an in-depth analysis of the preclinical imaging market, covering market dynamics, industry trends, leading segments and players, and future growth opportunities. The study period spans from 2019 to 2033, with 2025 as the base and estimated year. The report offers valuable insights for stakeholders, including manufacturers, researchers, investors, and regulatory bodies, seeking to understand and capitalize on the growth potential within this dynamic sector. The market is projected to reach xx Million by 2033, exhibiting a CAGR of xx% during the forecast period (2025-2033).
Preclinical Imaging Industry Market Dynamics & Concentration
The preclinical imaging market is characterized by moderate concentration, with several key players holding significant market share. However, the landscape is dynamic, driven by continuous innovation, evolving regulatory frameworks, and increasing adoption of advanced imaging modalities. Market share distribution among the top five players is estimated at approximately 60% in 2025, indicating a relatively fragmented yet competitive environment. The historical period (2019-2024) witnessed approximately xx M&A deals, signaling a trend of consolidation and expansion among key players.
- Innovation Drivers: Technological advancements, such as the development of higher-resolution imaging systems and improved image analysis software, are key drivers of market growth.
- Regulatory Frameworks: Stringent regulatory approvals and safety standards influence product development and market entry. Compliance requirements vary across regions, impacting market penetration strategies.
- Product Substitutes: Alternative technologies and methodologies exist, but they often lack the specificity, resolution, and non-invasiveness offered by advanced preclinical imaging techniques.
- End-User Trends: Increasing demand for personalized medicine and accelerated drug discovery is driving adoption of preclinical imaging in pharmaceutical and biotechnology research.
- M&A Activities: Strategic mergers and acquisitions are expected to continue, facilitating market consolidation and expansion into new therapeutic areas.
Preclinical Imaging Industry Industry Trends & Analysis
The preclinical imaging market is experiencing robust growth, propelled by several factors. The increasing prevalence of chronic diseases, the rising demand for personalized medicine, and substantial investments in research and development are primary growth drivers. Technological advancements, particularly in optical imaging, micro-CT, and micro-MRI systems, are enhancing image resolution, sensitivity, and throughput, fueling market expansion. The market's growth is further influenced by consumer preferences for minimally invasive techniques, a focus on efficiency in drug development pipelines, and heightened competition among imaging technology providers. The historical period (2019-2024) shows a CAGR of xx%, with market penetration expected to reach xx% by 2033. The shift towards multi-modal imaging systems, combining data from various modalities, is another significant trend shaping the market.
Leading Markets & Segments in Preclinical Imaging Industry
North America currently dominates the preclinical imaging market, driven by robust funding for biomedical research, a high concentration of pharmaceutical and biotechnology companies, and the presence of leading imaging technology providers. Within modalities, Micro-MRI and Optical Imaging Systems hold significant market share due to their versatility, high resolution, and suitability for various preclinical research applications.
- Key Drivers in North America:
- Strong government funding for biomedical research.
- High density of pharmaceutical and biotech companies.
- Well-established regulatory frameworks.
- Early adoption of advanced imaging technologies.
- Micro-MRI Dominance: High resolution and versatility for various applications.
- Optical Imaging Systems Growth: Non-invasive nature and suitability for longitudinal studies.
- Other Modalities: Micro-CT, micro-ultrasound, and photoacoustic imaging are experiencing growth but at a slower pace compared to Micro-MRI and optical imaging.
Preclinical Imaging Industry Product Developments
Recent advancements in preclinical imaging have focused on developing higher-resolution, more sensitive, and faster imaging systems. The integration of artificial intelligence (AI) and machine learning (ML) algorithms for improved image analysis and automated workflows is significantly impacting the market. New applications are emerging in areas such as drug delivery optimization, cell tracking, and the study of disease mechanisms at a cellular and molecular level. This translates into improved efficiency, reduced costs, and enhanced accuracy in preclinical research. Competition is fierce, with companies focusing on offering unique features, such as multi-modal capabilities, increased throughput, and user-friendly interfaces.
Key Drivers of Preclinical Imaging Industry Growth
Several factors contribute to the growth of the preclinical imaging market. Technological advancements, such as higher resolution imaging, multi-modal systems, and AI-driven image analysis, are key. The rising prevalence of chronic diseases and the increasing demand for personalized medicine are also significant drivers. Furthermore, supportive government regulations and funding for research & development programs accelerate market growth. The economic benefits of efficient drug development through preclinical imaging are attracting substantial investment.
Challenges in the Preclinical Imaging Industry Market
The preclinical imaging market faces several challenges. High capital costs associated with acquiring and maintaining advanced imaging systems can be a barrier for smaller research institutions. Regulatory hurdles and stringent approval processes for new technologies can also slow down market entry. Furthermore, intense competition among established players and the emergence of new entrants create a complex and dynamic market landscape. Supply chain disruptions and shortages of critical components further impact market growth. The overall impact of these challenges is estimated to reduce market growth by approximately xx Million by 2033.
Emerging Opportunities in Preclinical Imaging Industry
The preclinical imaging market presents several opportunities for future growth. Continued technological breakthroughs, particularly in the development of novel imaging modalities and advanced image analysis techniques, will create new market segments. Strategic partnerships between imaging technology companies and pharmaceutical or biotechnology companies will accelerate the development and adoption of preclinical imaging techniques. Expanding into new geographic markets, particularly in developing countries with growing research infrastructure, represents substantial growth potential. The increasing integration of preclinical imaging data with other ‘omics’ data to provide a holistic view of disease mechanisms will also shape future growth trajectories.
Leading Players in the Preclinical Imaging Industry Sector
- Mediso Ltd
- Trifoil Imaging
- Photon etc
- Advanced Molecular Vision Inc
- Euro-BioImaging ERIC
- MR Solutions Ltd
- Aspect Imaging Ltd
- PerkinElmer Inc
- IVIM Technology Corp
- Bruker Corporation
- AXT PTY LTD
- United Imaging Healthcare Co Ltd
- Fujifilm Holdings Corporation
Key Milestones in Preclinical Imaging Industry Industry
- May 2022: Bruker launched innovative 7 Tesla and 9.4 Tesla conduction-cooled Maxwell magnets for its market-leading preclinical MRI systems, enhancing resolution and capabilities.
- April 2022: PerkinElmer expanded its in vivo imaging portfolio with the Vega imaging system, a novel ultrasound platform accelerating non-invasive research and drug development. This launch significantly impacted the ultrasound segment of the market.
Strategic Outlook for Preclinical Imaging Industry Market
The preclinical imaging market holds significant potential for continued growth. The convergence of advanced imaging technologies with AI and big data analytics will create new opportunities for improved diagnostics and personalized medicine. Strategic partnerships and collaborations will foster innovation and accelerate market penetration. Expansion into new therapeutic areas and global markets will further drive market growth. Companies that successfully adapt to evolving technological landscapes and regulatory environments are poised to capture significant market share in the years to come.
Preclinical Imaging Industry Segmentation
-
1. Modality
- 1.1. Optical Imaging Systems
- 1.2. Nuclear Imaging Systems
- 1.3. Micro-MRI
- 1.4. Micro-ultrasound
- 1.5. Micro-CT
- 1.6. Photoacoustic Imaging Systems
- 1.7. Other Modality
Preclinical Imaging Industry Segmentation By Geography
-
1. North America
- 1.1. United States
- 1.2. Canada
- 1.3. Mexico
-
2. Europe
- 2.1. Germany
- 2.2. United Kingdom
- 2.3. France
- 2.4. Italy
- 2.5. Spain
- 2.6. Rest of Europe
-
3. Asia Pacific
- 3.1. China
- 3.2. Japan
- 3.3. India
- 3.4. Australia
- 3.5. South Korea
- 3.6. Rest of Asia Pacific
-
4. Middle East and Africa
- 4.1. GCC
- 4.2. South Africa
- 4.3. Rest of Middle East and Africa
-
5. South America
- 5.1. Brazil
- 5.2. Argentina
- 5.3. Rest of South America
Preclinical Imaging Industry REPORT HIGHLIGHTS
| Aspects | Details |
|---|---|
| Study Period | 2019-2033 |
| Base Year | 2024 |
| Estimated Year | 2025 |
| Forecast Period | 2025-2033 |
| Historical Period | 2019-2024 |
| Growth Rate | CAGR of 6.00% from 2019-2033 |
| Segmentation |
|
Table of Contents
- 1. Introduction
- 1.1. Research Scope
- 1.2. Market Segmentation
- 1.3. Research Methodology
- 1.4. Definitions and Assumptions
- 2. Executive Summary
- 2.1. Introduction
- 3. Market Dynamics
- 3.1. Introduction
- 3.2. Market Drivers
- 3.2.1 Technological Advancements in Molecular Imaging; Increasing Demand for Non-invasive Small Animal Imaging Techniques; Increase in Preclinical Research Funding
- 3.2.2 by Both Private and Public Organizations
- 3.3. Market Restrains
- 3.3.1. Strict Regulations in Preclinical Research; High Installation and Operational Costs associated with Preclinical Imaging Modalities
- 3.4. Market Trends
- 3.4.1. Micro-Ultrasound is the Segment by Modality and is Expected to be the Fastest Growing Market
- 4. Market Factor Analysis
- 4.1. Porters Five Forces
- 4.2. Supply/Value Chain
- 4.3. PESTEL analysis
- 4.4. Market Entropy
- 4.5. Patent/Trademark Analysis
- 5. Global Preclinical Imaging Industry Analysis, Insights and Forecast, 2019-2031
- 5.1. Market Analysis, Insights and Forecast - by Modality
- 5.1.1. Optical Imaging Systems
- 5.1.2. Nuclear Imaging Systems
- 5.1.3. Micro-MRI
- 5.1.4. Micro-ultrasound
- 5.1.5. Micro-CT
- 5.1.6. Photoacoustic Imaging Systems
- 5.1.7. Other Modality
- 5.2. Market Analysis, Insights and Forecast - by Region
- 5.2.1. North America
- 5.2.2. Europe
- 5.2.3. Asia Pacific
- 5.2.4. Middle East and Africa
- 5.2.5. South America
- 5.1. Market Analysis, Insights and Forecast - by Modality
- 6. North America Preclinical Imaging Industry Analysis, Insights and Forecast, 2019-2031
- 6.1. Market Analysis, Insights and Forecast - by Modality
- 6.1.1. Optical Imaging Systems
- 6.1.2. Nuclear Imaging Systems
- 6.1.3. Micro-MRI
- 6.1.4. Micro-ultrasound
- 6.1.5. Micro-CT
- 6.1.6. Photoacoustic Imaging Systems
- 6.1.7. Other Modality
- 6.1. Market Analysis, Insights and Forecast - by Modality
- 7. Europe Preclinical Imaging Industry Analysis, Insights and Forecast, 2019-2031
- 7.1. Market Analysis, Insights and Forecast - by Modality
- 7.1.1. Optical Imaging Systems
- 7.1.2. Nuclear Imaging Systems
- 7.1.3. Micro-MRI
- 7.1.4. Micro-ultrasound
- 7.1.5. Micro-CT
- 7.1.6. Photoacoustic Imaging Systems
- 7.1.7. Other Modality
- 7.1. Market Analysis, Insights and Forecast - by Modality
- 8. Asia Pacific Preclinical Imaging Industry Analysis, Insights and Forecast, 2019-2031
- 8.1. Market Analysis, Insights and Forecast - by Modality
- 8.1.1. Optical Imaging Systems
- 8.1.2. Nuclear Imaging Systems
- 8.1.3. Micro-MRI
- 8.1.4. Micro-ultrasound
- 8.1.5. Micro-CT
- 8.1.6. Photoacoustic Imaging Systems
- 8.1.7. Other Modality
- 8.1. Market Analysis, Insights and Forecast - by Modality
- 9. Middle East and Africa Preclinical Imaging Industry Analysis, Insights and Forecast, 2019-2031
- 9.1. Market Analysis, Insights and Forecast - by Modality
- 9.1.1. Optical Imaging Systems
- 9.1.2. Nuclear Imaging Systems
- 9.1.3. Micro-MRI
- 9.1.4. Micro-ultrasound
- 9.1.5. Micro-CT
- 9.1.6. Photoacoustic Imaging Systems
- 9.1.7. Other Modality
- 9.1. Market Analysis, Insights and Forecast - by Modality
- 10. South America Preclinical Imaging Industry Analysis, Insights and Forecast, 2019-2031
- 10.1. Market Analysis, Insights and Forecast - by Modality
- 10.1.1. Optical Imaging Systems
- 10.1.2. Nuclear Imaging Systems
- 10.1.3. Micro-MRI
- 10.1.4. Micro-ultrasound
- 10.1.5. Micro-CT
- 10.1.6. Photoacoustic Imaging Systems
- 10.1.7. Other Modality
- 10.1. Market Analysis, Insights and Forecast - by Modality
- 11. North America Preclinical Imaging Industry Analysis, Insights and Forecast, 2019-2031
- 11.1. Market Analysis, Insights and Forecast - By Country/Sub-region
- 11.1.1. undefined
- 12. Europe Preclinical Imaging Industry Analysis, Insights and Forecast, 2019-2031
- 12.1. Market Analysis, Insights and Forecast - By Country/Sub-region
- 12.1.1. undefined
- 13. Asia Pacific Preclinical Imaging Industry Analysis, Insights and Forecast, 2019-2031
- 13.1. Market Analysis, Insights and Forecast - By Country/Sub-region
- 13.1.1. undefined
- 14. Middle East and Africa Preclinical Imaging Industry Analysis, Insights and Forecast, 2019-2031
- 14.1. Market Analysis, Insights and Forecast - By Country/Sub-region
- 14.1.1. undefined
- 15. South America Preclinical Imaging Industry Analysis, Insights and Forecast, 2019-2031
- 15.1. Market Analysis, Insights and Forecast - By Country/Sub-region
- 15.1.1. undefined
- 16. Competitive Analysis
- 16.1. Global Market Share Analysis 2024
- 16.2. Company Profiles
- 16.2.1 Mediso Ltd
- 16.2.1.1. Overview
- 16.2.1.2. Products
- 16.2.1.3. SWOT Analysis
- 16.2.1.4. Recent Developments
- 16.2.1.5. Financials (Based on Availability)
- 16.2.2 Trifoil Imaging
- 16.2.2.1. Overview
- 16.2.2.2. Products
- 16.2.2.3. SWOT Analysis
- 16.2.2.4. Recent Developments
- 16.2.2.5. Financials (Based on Availability)
- 16.2.3 Photon etc
- 16.2.3.1. Overview
- 16.2.3.2. Products
- 16.2.3.3. SWOT Analysis
- 16.2.3.4. Recent Developments
- 16.2.3.5. Financials (Based on Availability)
- 16.2.4 Advanced Molecular Vision Inc
- 16.2.4.1. Overview
- 16.2.4.2. Products
- 16.2.4.3. SWOT Analysis
- 16.2.4.4. Recent Developments
- 16.2.4.5. Financials (Based on Availability)
- 16.2.5 Euro-BioImaging ERIC
- 16.2.5.1. Overview
- 16.2.5.2. Products
- 16.2.5.3. SWOT Analysis
- 16.2.5.4. Recent Developments
- 16.2.5.5. Financials (Based on Availability)
- 16.2.6 MR Solutions Ltd
- 16.2.6.1. Overview
- 16.2.6.2. Products
- 16.2.6.3. SWOT Analysis
- 16.2.6.4. Recent Developments
- 16.2.6.5. Financials (Based on Availability)
- 16.2.7 Aspect Imaging Ltd
- 16.2.7.1. Overview
- 16.2.7.2. Products
- 16.2.7.3. SWOT Analysis
- 16.2.7.4. Recent Developments
- 16.2.7.5. Financials (Based on Availability)
- 16.2.8 PerkinElmer Inc
- 16.2.8.1. Overview
- 16.2.8.2. Products
- 16.2.8.3. SWOT Analysis
- 16.2.8.4. Recent Developments
- 16.2.8.5. Financials (Based on Availability)
- 16.2.9 IVIM Technology Corp
- 16.2.9.1. Overview
- 16.2.9.2. Products
- 16.2.9.3. SWOT Analysis
- 16.2.9.4. Recent Developments
- 16.2.9.5. Financials (Based on Availability)
- 16.2.10 Bruker Corporation
- 16.2.10.1. Overview
- 16.2.10.2. Products
- 16.2.10.3. SWOT Analysis
- 16.2.10.4. Recent Developments
- 16.2.10.5. Financials (Based on Availability)
- 16.2.11 AXT PTY LTD
- 16.2.11.1. Overview
- 16.2.11.2. Products
- 16.2.11.3. SWOT Analysis
- 16.2.11.4. Recent Developments
- 16.2.11.5. Financials (Based on Availability)
- 16.2.12 United Imaging Healthcare Co Ltd
- 16.2.12.1. Overview
- 16.2.12.2. Products
- 16.2.12.3. SWOT Analysis
- 16.2.12.4. Recent Developments
- 16.2.12.5. Financials (Based on Availability)
- 16.2.13 Fujifilm Holdings Corporation
- 16.2.13.1. Overview
- 16.2.13.2. Products
- 16.2.13.3. SWOT Analysis
- 16.2.13.4. Recent Developments
- 16.2.13.5. Financials (Based on Availability)
- 16.2.1 Mediso Ltd
List of Figures
- Figure 1: Global Preclinical Imaging Industry Revenue Breakdown (Million, %) by Region 2024 & 2032
- Figure 2: Global Preclinical Imaging Industry Volume Breakdown (K Unit, %) by Region 2024 & 2032
- Figure 3: North America Preclinical Imaging Industry Revenue (Million), by Country 2024 & 2032
- Figure 4: North America Preclinical Imaging Industry Volume (K Unit), by Country 2024 & 2032
- Figure 5: North America Preclinical Imaging Industry Revenue Share (%), by Country 2024 & 2032
- Figure 6: North America Preclinical Imaging Industry Volume Share (%), by Country 2024 & 2032
- Figure 7: Europe Preclinical Imaging Industry Revenue (Million), by Country 2024 & 2032
- Figure 8: Europe Preclinical Imaging Industry Volume (K Unit), by Country 2024 & 2032
- Figure 9: Europe Preclinical Imaging Industry Revenue Share (%), by Country 2024 & 2032
- Figure 10: Europe Preclinical Imaging Industry Volume Share (%), by Country 2024 & 2032
- Figure 11: Asia Pacific Preclinical Imaging Industry Revenue (Million), by Country 2024 & 2032
- Figure 12: Asia Pacific Preclinical Imaging Industry Volume (K Unit), by Country 2024 & 2032
- Figure 13: Asia Pacific Preclinical Imaging Industry Revenue Share (%), by Country 2024 & 2032
- Figure 14: Asia Pacific Preclinical Imaging Industry Volume Share (%), by Country 2024 & 2032
- Figure 15: Middle East and Africa Preclinical Imaging Industry Revenue (Million), by Country 2024 & 2032
- Figure 16: Middle East and Africa Preclinical Imaging Industry Volume (K Unit), by Country 2024 & 2032
- Figure 17: Middle East and Africa Preclinical Imaging Industry Revenue Share (%), by Country 2024 & 2032
- Figure 18: Middle East and Africa Preclinical Imaging Industry Volume Share (%), by Country 2024 & 2032
- Figure 19: South America Preclinical Imaging Industry Revenue (Million), by Country 2024 & 2032
- Figure 20: South America Preclinical Imaging Industry Volume (K Unit), by Country 2024 & 2032
- Figure 21: South America Preclinical Imaging Industry Revenue Share (%), by Country 2024 & 2032
- Figure 22: South America Preclinical Imaging Industry Volume Share (%), by Country 2024 & 2032
- Figure 23: North America Preclinical Imaging Industry Revenue (Million), by Modality 2024 & 2032
- Figure 24: North America Preclinical Imaging Industry Volume (K Unit), by Modality 2024 & 2032
- Figure 25: North America Preclinical Imaging Industry Revenue Share (%), by Modality 2024 & 2032
- Figure 26: North America Preclinical Imaging Industry Volume Share (%), by Modality 2024 & 2032
- Figure 27: North America Preclinical Imaging Industry Revenue (Million), by Country 2024 & 2032
- Figure 28: North America Preclinical Imaging Industry Volume (K Unit), by Country 2024 & 2032
- Figure 29: North America Preclinical Imaging Industry Revenue Share (%), by Country 2024 & 2032
- Figure 30: North America Preclinical Imaging Industry Volume Share (%), by Country 2024 & 2032
- Figure 31: Europe Preclinical Imaging Industry Revenue (Million), by Modality 2024 & 2032
- Figure 32: Europe Preclinical Imaging Industry Volume (K Unit), by Modality 2024 & 2032
- Figure 33: Europe Preclinical Imaging Industry Revenue Share (%), by Modality 2024 & 2032
- Figure 34: Europe Preclinical Imaging Industry Volume Share (%), by Modality 2024 & 2032
- Figure 35: Europe Preclinical Imaging Industry Revenue (Million), by Country 2024 & 2032
- Figure 36: Europe Preclinical Imaging Industry Volume (K Unit), by Country 2024 & 2032
- Figure 37: Europe Preclinical Imaging Industry Revenue Share (%), by Country 2024 & 2032
- Figure 38: Europe Preclinical Imaging Industry Volume Share (%), by Country 2024 & 2032
- Figure 39: Asia Pacific Preclinical Imaging Industry Revenue (Million), by Modality 2024 & 2032
- Figure 40: Asia Pacific Preclinical Imaging Industry Volume (K Unit), by Modality 2024 & 2032
- Figure 41: Asia Pacific Preclinical Imaging Industry Revenue Share (%), by Modality 2024 & 2032
- Figure 42: Asia Pacific Preclinical Imaging Industry Volume Share (%), by Modality 2024 & 2032
- Figure 43: Asia Pacific Preclinical Imaging Industry Revenue (Million), by Country 2024 & 2032
- Figure 44: Asia Pacific Preclinical Imaging Industry Volume (K Unit), by Country 2024 & 2032
- Figure 45: Asia Pacific Preclinical Imaging Industry Revenue Share (%), by Country 2024 & 2032
- Figure 46: Asia Pacific Preclinical Imaging Industry Volume Share (%), by Country 2024 & 2032
- Figure 47: Middle East and Africa Preclinical Imaging Industry Revenue (Million), by Modality 2024 & 2032
- Figure 48: Middle East and Africa Preclinical Imaging Industry Volume (K Unit), by Modality 2024 & 2032
- Figure 49: Middle East and Africa Preclinical Imaging Industry Revenue Share (%), by Modality 2024 & 2032
- Figure 50: Middle East and Africa Preclinical Imaging Industry Volume Share (%), by Modality 2024 & 2032
- Figure 51: Middle East and Africa Preclinical Imaging Industry Revenue (Million), by Country 2024 & 2032
- Figure 52: Middle East and Africa Preclinical Imaging Industry Volume (K Unit), by Country 2024 & 2032
- Figure 53: Middle East and Africa Preclinical Imaging Industry Revenue Share (%), by Country 2024 & 2032
- Figure 54: Middle East and Africa Preclinical Imaging Industry Volume Share (%), by Country 2024 & 2032
- Figure 55: South America Preclinical Imaging Industry Revenue (Million), by Modality 2024 & 2032
- Figure 56: South America Preclinical Imaging Industry Volume (K Unit), by Modality 2024 & 2032
- Figure 57: South America Preclinical Imaging Industry Revenue Share (%), by Modality 2024 & 2032
- Figure 58: South America Preclinical Imaging Industry Volume Share (%), by Modality 2024 & 2032
- Figure 59: South America Preclinical Imaging Industry Revenue (Million), by Country 2024 & 2032
- Figure 60: South America Preclinical Imaging Industry Volume (K Unit), by Country 2024 & 2032
- Figure 61: South America Preclinical Imaging Industry Revenue Share (%), by Country 2024 & 2032
- Figure 62: South America Preclinical Imaging Industry Volume Share (%), by Country 2024 & 2032
List of Tables
- Table 1: Global Preclinical Imaging Industry Revenue Million Forecast, by Region 2019 & 2032
- Table 2: Global Preclinical Imaging Industry Volume K Unit Forecast, by Region 2019 & 2032
- Table 3: Global Preclinical Imaging Industry Revenue Million Forecast, by Modality 2019 & 2032
- Table 4: Global Preclinical Imaging Industry Volume K Unit Forecast, by Modality 2019 & 2032
- Table 5: Global Preclinical Imaging Industry Revenue Million Forecast, by Region 2019 & 2032
- Table 6: Global Preclinical Imaging Industry Volume K Unit Forecast, by Region 2019 & 2032
- Table 7: Global Preclinical Imaging Industry Revenue Million Forecast, by Country 2019 & 2032
- Table 8: Global Preclinical Imaging Industry Volume K Unit Forecast, by Country 2019 & 2032
- Table 9: Global Preclinical Imaging Industry Revenue Million Forecast, by Country 2019 & 2032
- Table 10: Global Preclinical Imaging Industry Volume K Unit Forecast, by Country 2019 & 2032
- Table 11: Global Preclinical Imaging Industry Revenue Million Forecast, by Country 2019 & 2032
- Table 12: Global Preclinical Imaging Industry Volume K Unit Forecast, by Country 2019 & 2032
- Table 13: Global Preclinical Imaging Industry Revenue Million Forecast, by Country 2019 & 2032
- Table 14: Global Preclinical Imaging Industry Volume K Unit Forecast, by Country 2019 & 2032
- Table 15: Global Preclinical Imaging Industry Revenue Million Forecast, by Country 2019 & 2032
- Table 16: Global Preclinical Imaging Industry Volume K Unit Forecast, by Country 2019 & 2032
- Table 17: Global Preclinical Imaging Industry Revenue Million Forecast, by Modality 2019 & 2032
- Table 18: Global Preclinical Imaging Industry Volume K Unit Forecast, by Modality 2019 & 2032
- Table 19: Global Preclinical Imaging Industry Revenue Million Forecast, by Country 2019 & 2032
- Table 20: Global Preclinical Imaging Industry Volume K Unit Forecast, by Country 2019 & 2032
- Table 21: United States Preclinical Imaging Industry Revenue (Million) Forecast, by Application 2019 & 2032
- Table 22: United States Preclinical Imaging Industry Volume (K Unit) Forecast, by Application 2019 & 2032
- Table 23: Canada Preclinical Imaging Industry Revenue (Million) Forecast, by Application 2019 & 2032
- Table 24: Canada Preclinical Imaging Industry Volume (K Unit) Forecast, by Application 2019 & 2032
- Table 25: Mexico Preclinical Imaging Industry Revenue (Million) Forecast, by Application 2019 & 2032
- Table 26: Mexico Preclinical Imaging Industry Volume (K Unit) Forecast, by Application 2019 & 2032
- Table 27: Global Preclinical Imaging Industry Revenue Million Forecast, by Modality 2019 & 2032
- Table 28: Global Preclinical Imaging Industry Volume K Unit Forecast, by Modality 2019 & 2032
- Table 29: Global Preclinical Imaging Industry Revenue Million Forecast, by Country 2019 & 2032
- Table 30: Global Preclinical Imaging Industry Volume K Unit Forecast, by Country 2019 & 2032
- Table 31: Germany Preclinical Imaging Industry Revenue (Million) Forecast, by Application 2019 & 2032
- Table 32: Germany Preclinical Imaging Industry Volume (K Unit) Forecast, by Application 2019 & 2032
- Table 33: United Kingdom Preclinical Imaging Industry Revenue (Million) Forecast, by Application 2019 & 2032
- Table 34: United Kingdom Preclinical Imaging Industry Volume (K Unit) Forecast, by Application 2019 & 2032
- Table 35: France Preclinical Imaging Industry Revenue (Million) Forecast, by Application 2019 & 2032
- Table 36: France Preclinical Imaging Industry Volume (K Unit) Forecast, by Application 2019 & 2032
- Table 37: Italy Preclinical Imaging Industry Revenue (Million) Forecast, by Application 2019 & 2032
- Table 38: Italy Preclinical Imaging Industry Volume (K Unit) Forecast, by Application 2019 & 2032
- Table 39: Spain Preclinical Imaging Industry Revenue (Million) Forecast, by Application 2019 & 2032
- Table 40: Spain Preclinical Imaging Industry Volume (K Unit) Forecast, by Application 2019 & 2032
- Table 41: Rest of Europe Preclinical Imaging Industry Revenue (Million) Forecast, by Application 2019 & 2032
- Table 42: Rest of Europe Preclinical Imaging Industry Volume (K Unit) Forecast, by Application 2019 & 2032
- Table 43: Global Preclinical Imaging Industry Revenue Million Forecast, by Modality 2019 & 2032
- Table 44: Global Preclinical Imaging Industry Volume K Unit Forecast, by Modality 2019 & 2032
- Table 45: Global Preclinical Imaging Industry Revenue Million Forecast, by Country 2019 & 2032
- Table 46: Global Preclinical Imaging Industry Volume K Unit Forecast, by Country 2019 & 2032
- Table 47: China Preclinical Imaging Industry Revenue (Million) Forecast, by Application 2019 & 2032
- Table 48: China Preclinical Imaging Industry Volume (K Unit) Forecast, by Application 2019 & 2032
- Table 49: Japan Preclinical Imaging Industry Revenue (Million) Forecast, by Application 2019 & 2032
- Table 50: Japan Preclinical Imaging Industry Volume (K Unit) Forecast, by Application 2019 & 2032
- Table 51: India Preclinical Imaging Industry Revenue (Million) Forecast, by Application 2019 & 2032
- Table 52: India Preclinical Imaging Industry Volume (K Unit) Forecast, by Application 2019 & 2032
- Table 53: Australia Preclinical Imaging Industry Revenue (Million) Forecast, by Application 2019 & 2032
- Table 54: Australia Preclinical Imaging Industry Volume (K Unit) Forecast, by Application 2019 & 2032
- Table 55: South Korea Preclinical Imaging Industry Revenue (Million) Forecast, by Application 2019 & 2032
- Table 56: South Korea Preclinical Imaging Industry Volume (K Unit) Forecast, by Application 2019 & 2032
- Table 57: Rest of Asia Pacific Preclinical Imaging Industry Revenue (Million) Forecast, by Application 2019 & 2032
- Table 58: Rest of Asia Pacific Preclinical Imaging Industry Volume (K Unit) Forecast, by Application 2019 & 2032
- Table 59: Global Preclinical Imaging Industry Revenue Million Forecast, by Modality 2019 & 2032
- Table 60: Global Preclinical Imaging Industry Volume K Unit Forecast, by Modality 2019 & 2032
- Table 61: Global Preclinical Imaging Industry Revenue Million Forecast, by Country 2019 & 2032
- Table 62: Global Preclinical Imaging Industry Volume K Unit Forecast, by Country 2019 & 2032
- Table 63: GCC Preclinical Imaging Industry Revenue (Million) Forecast, by Application 2019 & 2032
- Table 64: GCC Preclinical Imaging Industry Volume (K Unit) Forecast, by Application 2019 & 2032
- Table 65: South Africa Preclinical Imaging Industry Revenue (Million) Forecast, by Application 2019 & 2032
- Table 66: South Africa Preclinical Imaging Industry Volume (K Unit) Forecast, by Application 2019 & 2032
- Table 67: Rest of Middle East and Africa Preclinical Imaging Industry Revenue (Million) Forecast, by Application 2019 & 2032
- Table 68: Rest of Middle East and Africa Preclinical Imaging Industry Volume (K Unit) Forecast, by Application 2019 & 2032
- Table 69: Global Preclinical Imaging Industry Revenue Million Forecast, by Modality 2019 & 2032
- Table 70: Global Preclinical Imaging Industry Volume K Unit Forecast, by Modality 2019 & 2032
- Table 71: Global Preclinical Imaging Industry Revenue Million Forecast, by Country 2019 & 2032
- Table 72: Global Preclinical Imaging Industry Volume K Unit Forecast, by Country 2019 & 2032
- Table 73: Brazil Preclinical Imaging Industry Revenue (Million) Forecast, by Application 2019 & 2032
- Table 74: Brazil Preclinical Imaging Industry Volume (K Unit) Forecast, by Application 2019 & 2032
- Table 75: Argentina Preclinical Imaging Industry Revenue (Million) Forecast, by Application 2019 & 2032
- Table 76: Argentina Preclinical Imaging Industry Volume (K Unit) Forecast, by Application 2019 & 2032
- Table 77: Rest of South America Preclinical Imaging Industry Revenue (Million) Forecast, by Application 2019 & 2032
- Table 78: Rest of South America Preclinical Imaging Industry Volume (K Unit) Forecast, by Application 2019 & 2032
Frequently Asked Questions
1. What is the projected Compound Annual Growth Rate (CAGR) of the Preclinical Imaging Industry?
The projected CAGR is approximately 6.00%.
2. Which companies are prominent players in the Preclinical Imaging Industry?
Key companies in the market include Mediso Ltd, Trifoil Imaging, Photon etc, Advanced Molecular Vision Inc, Euro-BioImaging ERIC, MR Solutions Ltd, Aspect Imaging Ltd, PerkinElmer Inc, IVIM Technology Corp , Bruker Corporation, AXT PTY LTD, United Imaging Healthcare Co Ltd, Fujifilm Holdings Corporation.
3. What are the main segments of the Preclinical Imaging Industry?
The market segments include Modality.
4. Can you provide details about the market size?
The market size is estimated to be USD XX Million as of 2022.
5. What are some drivers contributing to market growth?
Technological Advancements in Molecular Imaging; Increasing Demand for Non-invasive Small Animal Imaging Techniques; Increase in Preclinical Research Funding. by Both Private and Public Organizations.
6. What are the notable trends driving market growth?
Micro-Ultrasound is the Segment by Modality and is Expected to be the Fastest Growing Market.
7. Are there any restraints impacting market growth?
Strict Regulations in Preclinical Research; High Installation and Operational Costs associated with Preclinical Imaging Modalities.
8. Can you provide examples of recent developments in the market?
In May 2022, Bruker launched innovative 7 Tesla and 9.4 Tesla conduction-cooled Maxwell magnets for its market-leading preclinical magnetic resonance imaging (MRI) systems portfolio.
9. What pricing options are available for accessing the report?
Pricing options include single-user, multi-user, and enterprise licenses priced at USD 4750, USD 5250, and USD 8750 respectively.
10. Is the market size provided in terms of value or volume?
The market size is provided in terms of value, measured in Million and volume, measured in K Unit.
11. Are there any specific market keywords associated with the report?
Yes, the market keyword associated with the report is "Preclinical Imaging Industry," which aids in identifying and referencing the specific market segment covered.
12. How do I determine which pricing option suits my needs best?
The pricing options vary based on user requirements and access needs. Individual users may opt for single-user licenses, while businesses requiring broader access may choose multi-user or enterprise licenses for cost-effective access to the report.
13. Are there any additional resources or data provided in the Preclinical Imaging Industry report?
While the report offers comprehensive insights, it's advisable to review the specific contents or supplementary materials provided to ascertain if additional resources or data are available.
14. How can I stay updated on further developments or reports in the Preclinical Imaging Industry?
To stay informed about further developments, trends, and reports in the Preclinical Imaging Industry, consider subscribing to industry newsletters, following relevant companies and organizations, or regularly checking reputable industry news sources and publications.
Methodology
Step 1 - Identification of Relevant Samples Size from Population Database


Step 2 - Approaches for Defining Global Market Size (Value, Volume* & Price*)

Note*: In applicable scenarios
Step 3 - Data Sources
Primary Research
- Web Analytics
- Survey Reports
- Research Institute
- Latest Research Reports
- Opinion Leaders
Secondary Research
- Annual Reports
- White Paper
- Latest Press Release
- Industry Association
- Paid Database
- Investor Presentations

Step 4 - Data Triangulation
Involves using different sources of information in order to increase the validity of a study
These sources are likely to be stakeholders in a program - participants, other researchers, program staff, other community members, and so on.
Then we put all data in single framework & apply various statistical tools to find out the dynamic on the market.
During the analysis stage, feedback from the stakeholder groups would be compared to determine areas of agreement as well as areas of divergence
