

Key Insights
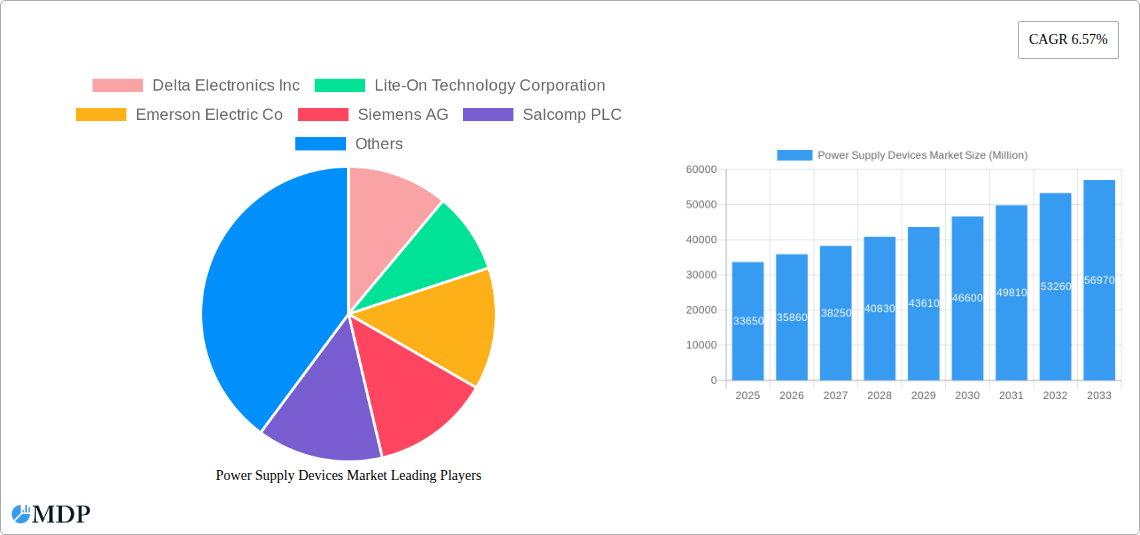
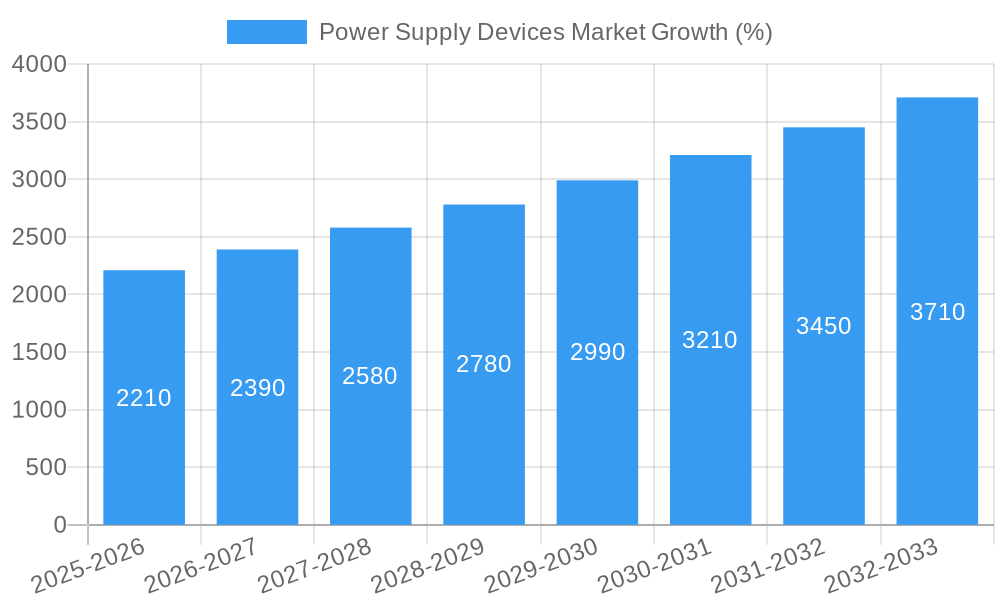
The global power supply devices market, valued at $33.65 billion in 2025, is poised for robust growth, exhibiting a Compound Annual Growth Rate (CAGR) of 6.57% from 2025 to 2033. This expansion is driven by the increasing demand for power efficient electronics across diverse sectors. The surging adoption of renewable energy sources, coupled with the proliferation of data centers and electric vehicles, fuels significant market growth. Furthermore, miniaturization trends in electronics and the growing need for reliable power solutions in industrial automation and smart infrastructure contribute to the market's upward trajectory. Key segments like AC-DC power supplies and DC-DC converters are experiencing strong demand, driven by their versatility and efficiency in various applications. The communication, industrial, and automotive sectors are major end-users, consistently driving the market's growth. While supply chain disruptions and potential material cost fluctuations present challenges, the market's resilience is underpinned by consistent technological advancements, leading to improved energy efficiency and reduced operational costs for end-users.
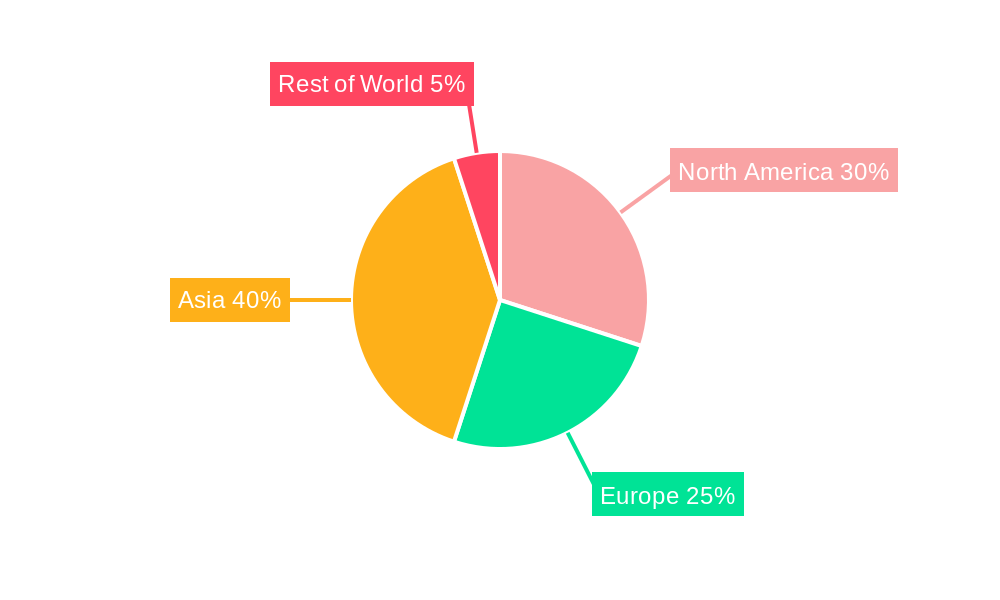
The market is segmented by device type (AC-DC power supplies and DC-DC converters) and end-user industry (communication, industrial, consumer and mobile, automotive, transportation, lighting, and other end-user industries). Leading players like Delta Electronics, Lite-On Technology, Emerson Electric, Siemens, and others are actively engaged in product innovation and strategic partnerships to maintain their market share. Regional analysis indicates strong growth potential in Asia, driven by rapid industrialization and technological advancements. Europe and North America also contribute significantly to the market, primarily due to the high adoption of advanced technologies and the presence of established players. While detailed regional market share data is unavailable, a logical estimation based on current market trends would suggest that Asia holds a leading share, followed by North America and Europe. The forecast period (2025-2033) promises continued market expansion, with potential for higher growth rates in specific niche segments, especially those related to renewable energy integration and electric vehicle infrastructure.
Power Supply Devices Market Report: 2019-2033 Forecast
This comprehensive report provides an in-depth analysis of the Power Supply Devices Market, offering invaluable insights for industry stakeholders, investors, and strategic decision-makers. Covering the period from 2019 to 2033, with a focus on 2025, this report meticulously examines market dynamics, leading players, emerging trends, and future growth prospects. The market is expected to reach xx Million by 2033, exhibiting a robust CAGR of xx% during the forecast period (2025-2033).
Power Supply Devices Market Market Dynamics & Concentration
The Power Supply Devices market is characterized by a moderately concentrated landscape with several key players holding significant market share. Delta Electronics Inc., Lite-On Technology Corporation, Emerson Electric Co., Siemens AG, Salcomp PLC, Acbel Polytech Inc., Mean Well Enterprises Co. Ltd., Murata Manufacturing Co. Ltd., and TDK-Lambda Corporation (TDK Corporation) are among the leading companies shaping the market dynamics. Market concentration is influenced by factors such as economies of scale, technological innovation, and brand recognition.
- Market Share: Delta Electronics and Mean Well Enterprises collectively hold an estimated xx% market share in 2025.
- Innovation Drivers: Continuous advancements in power efficiency, miniaturization, and enhanced reliability are driving market growth. The adoption of GaN and SiC technologies is a significant driver.
- Regulatory Frameworks: Stringent energy efficiency regulations and safety standards across various regions influence product design and manufacturing processes. Compliance costs and standards vary significantly across regions.
- Product Substitutes: While few direct substitutes exist, alternative energy solutions and evolving energy storage technologies pose indirect competitive pressure.
- End-User Trends: The increasing demand for power supply devices across diverse end-user industries like communication, automotive, and industrial sectors significantly impacts market growth. The rise of electric vehicles and renewable energy adoption are key catalysts.
- M&A Activities: The market has witnessed xx M&A deals in the past five years, primarily driven by strategic acquisitions to expand product portfolios and market reach. This activity is expected to continue at a similar pace, with a projected xx deals in the next five years.
Power Supply Devices Market Industry Trends & Analysis
The Power Supply Devices market is experiencing substantial growth, propelled by several key factors. Technological advancements, particularly in high-efficiency power conversion technologies (e.g., GaN, SiC), are driving miniaturization and cost reduction. The increasing demand for power-efficient devices across various industries, including consumer electronics, automotive, and renewable energy, fuels market expansion. Consumer preferences are shifting towards smaller, more efficient, and reliable power supplies. The competitive landscape is characterized by both intense competition among established players and the emergence of new entrants with innovative solutions. The market is experiencing a shift towards increased reliance on digital power supplies as they provide better control and efficiency. The growth is also driven by increasing demand from data centers and cloud infrastructure. The adoption of new materials and packaging is reducing the size and weight of the components while increasing the power density. The adoption of smart and connected power solutions is enabling remote monitoring and management of power systems. The market penetration of DC-DC converters is expected to increase in the upcoming years driven by the growth of portable and mobile electronics.
Leading Markets & Segments in Power Supply Devices Market
The global Power Supply Devices market is geographically diverse, with several regions and segments exhibiting strong growth.
By Device Type:
- AC-DC Power Supplies: This segment holds the largest market share, driven by its widespread applications in various industries. Key drivers include the continued growth in consumer electronics, increasing demand for industrial automation, and expansion in data centers. The market is expected to witness a CAGR of xx% from 2025 to 2033.
- DC-DC Converters: This segment is experiencing rapid growth due to its use in portable and mobile electronic devices, automotive electronics, and renewable energy applications. The market is expected to witness robust growth with a CAGR of xx% from 2025 to 2033.
By End-user Industry:
- Communication: The growth of 5G infrastructure and data centers is driving demand for high-efficiency power supplies.
- Industrial: Automation, robotics, and industrial control systems are key drivers of growth in this segment.
- Consumer and Mobile: The ever-increasing demand for smartphones, laptops, and other portable electronics fuels this segment's expansion.
- Automotive: The rapid growth of electric and hybrid vehicles is a major driver, demanding high-power, reliable, and efficient power supplies.
- Transportation: Besides automotive, rail transport and other transport systems demand large power supplies for various applications.
- Lighting: LED lighting is pushing demand for compact and efficient power supplies.
- Other End-user Industries: This sector includes medical equipment, aerospace, and other specialized applications, contributing to steady growth.
The Asia-Pacific region currently holds the largest market share, driven by factors like increasing industrialization, substantial investments in infrastructure, and a growing consumer electronics market. North America and Europe also represent significant markets, with growth driven by robust technological advancements and regulatory support for energy efficiency.
Power Supply Devices Market Product Developments
Recent product innovations focus on enhancing efficiency, miniaturization, and reliability. The introduction of GaN and SiC-based power supplies offers significant improvements in power density and efficiency compared to traditional silicon-based solutions. These advancements are leading to smaller, lighter, and more cost-effective power supply solutions for various applications. Moreover, new designs focusing on increased ruggedness and environmental resilience are gaining traction. The market is moving towards smart power supplies with embedded intelligence for better management and control.
Key Drivers of Power Supply Devices Market Growth
Several key factors drive the growth of the Power Supply Devices market. Technological advancements leading to higher efficiency and power density are paramount. The increasing demand for energy-efficient solutions in various applications, driven by stringent environmental regulations and consumer preferences, is a significant driver. Government initiatives promoting renewable energy and sustainable technologies further stimulate market expansion. The rising adoption of electric vehicles and industrial automation is boosting demand for advanced power supply devices.
Challenges in the Power Supply Devices Market Market
The market faces challenges, including the fluctuating prices of raw materials, which impact manufacturing costs. Supply chain disruptions can lead to production delays and increased costs. Intense competition among established players and the emergence of new entrants necessitate continuous innovation to maintain competitiveness. Meeting stringent regulatory requirements in different regions adds complexity to product development and manufacturing.
Emerging Opportunities in Power Supply Devices Market
The Power Supply Devices market presents significant opportunities for growth. The rising adoption of electric vehicles and renewable energy sources creates a strong demand for high-power, reliable power supplies. Technological advancements in GaN and SiC technologies will continue to drive innovation and offer enhanced performance. Strategic partnerships and collaborations between companies across the supply chain can foster efficiency and access to new markets. Expanding into emerging economies with rapid industrialization presents substantial growth potential.
Leading Players in the Power Supply Devices Market Sector
- Delta Electronics Inc
- Lite-On Technology Corporation
- Emerson Electric Co
- Siemens AG
- Salcomp PLC
- Acbel Polytech Inc
- Mean Well Enterprises Co Ltd
- Murata Manufacturing Co Ltd
- TDK-Lambda Corporation (TDK Corporation)
Key Milestones in Power Supply Devices Market Industry
- November 2023: Vox Power launched the VCCR300 Conduction Cooled Power Series, a high-power, reliable DC/DC power supply designed for railway applications. This signifies innovation in high-power DC-DC converters.
- October 2023: Mean Well Enterprises introduced the RQB60W12 series, an ultra-wide input railway DC-DC converter, expanding options for railway power solutions and highlighting adaptation to extreme environments.
Strategic Outlook for Power Supply Devices Market Market
The Power Supply Devices market is poised for continued growth, driven by technological advancements, increasing demand across various sectors, and supportive government policies. Strategic partnerships, investments in R&D, and expansion into new markets will be crucial for success. Companies focusing on innovation, efficiency, and sustainability will be best positioned to capitalize on the market's future potential.
Power Supply Devices Market Segmentation
-
1. Device Type
- 1.1. AC-DC Power Supplies
- 1.2. DC-DC Converters
-
2. End-user Industry
- 2.1. Communication
- 2.2. Industrial
- 2.3. Consumer and Mobile
- 2.4. Automotive
- 2.5. Transportation
- 2.6. Lighting
- 2.7. Other End-user Industries
Power Supply Devices Market Segmentation By Geography
- 1. Americas
- 2. Europe
- 3. Asia
- 4. Australia and New Zealand
- 5. Middle East and Africa
Power Supply Devices Market REPORT HIGHLIGHTS
| Aspects | Details |
|---|---|
| Study Period | 2019-2033 |
| Base Year | 2024 |
| Estimated Year | 2025 |
| Forecast Period | 2025-2033 |
| Historical Period | 2019-2024 |
| Growth Rate | CAGR of 6.57% from 2019-2033 |
| Segmentation |
|
Table of Contents
- 1. Introduction
- 1.1. Research Scope
- 1.2. Market Segmentation
- 1.3. Research Methodology
- 1.4. Definitions and Assumptions
- 2. Executive Summary
- 2.1. Introduction
- 3. Market Dynamics
- 3.1. Introduction
- 3.2. Market Drivers
- 3.2.1. Growing Adoption of Home and Building Automation Systems; Increasing Demand for Energy-efficient Devices
- 3.3. Market Restrains
- 3.3.1. Stringent Regulatory Compliance and Safety Standards
- 3.4. Market Trends
- 3.4.1. Consumer and Mobile Segment to Witness Major Growth
- 4. Market Factor Analysis
- 4.1. Porters Five Forces
- 4.2. Supply/Value Chain
- 4.3. PESTEL analysis
- 4.4. Market Entropy
- 4.5. Patent/Trademark Analysis
- 5. Global Power Supply Devices Market Analysis, Insights and Forecast, 2019-2031
- 5.1. Market Analysis, Insights and Forecast - by Device Type
- 5.1.1. AC-DC Power Supplies
- 5.1.2. DC-DC Converters
- 5.2. Market Analysis, Insights and Forecast - by End-user Industry
- 5.2.1. Communication
- 5.2.2. Industrial
- 5.2.3. Consumer and Mobile
- 5.2.4. Automotive
- 5.2.5. Transportation
- 5.2.6. Lighting
- 5.2.7. Other End-user Industries
- 5.3. Market Analysis, Insights and Forecast - by Region
- 5.3.1. Americas
- 5.3.2. Europe
- 5.3.3. Asia
- 5.3.4. Australia and New Zealand
- 5.3.5. Middle East and Africa
- 5.1. Market Analysis, Insights and Forecast - by Device Type
- 6. Americas Power Supply Devices Market Analysis, Insights and Forecast, 2019-2031
- 6.1. Market Analysis, Insights and Forecast - by Device Type
- 6.1.1. AC-DC Power Supplies
- 6.1.2. DC-DC Converters
- 6.2. Market Analysis, Insights and Forecast - by End-user Industry
- 6.2.1. Communication
- 6.2.2. Industrial
- 6.2.3. Consumer and Mobile
- 6.2.4. Automotive
- 6.2.5. Transportation
- 6.2.6. Lighting
- 6.2.7. Other End-user Industries
- 6.1. Market Analysis, Insights and Forecast - by Device Type
- 7. Europe Power Supply Devices Market Analysis, Insights and Forecast, 2019-2031
- 7.1. Market Analysis, Insights and Forecast - by Device Type
- 7.1.1. AC-DC Power Supplies
- 7.1.2. DC-DC Converters
- 7.2. Market Analysis, Insights and Forecast - by End-user Industry
- 7.2.1. Communication
- 7.2.2. Industrial
- 7.2.3. Consumer and Mobile
- 7.2.4. Automotive
- 7.2.5. Transportation
- 7.2.6. Lighting
- 7.2.7. Other End-user Industries
- 7.1. Market Analysis, Insights and Forecast - by Device Type
- 8. Asia Power Supply Devices Market Analysis, Insights and Forecast, 2019-2031
- 8.1. Market Analysis, Insights and Forecast - by Device Type
- 8.1.1. AC-DC Power Supplies
- 8.1.2. DC-DC Converters
- 8.2. Market Analysis, Insights and Forecast - by End-user Industry
- 8.2.1. Communication
- 8.2.2. Industrial
- 8.2.3. Consumer and Mobile
- 8.2.4. Automotive
- 8.2.5. Transportation
- 8.2.6. Lighting
- 8.2.7. Other End-user Industries
- 8.1. Market Analysis, Insights and Forecast - by Device Type
- 9. Australia and New Zealand Power Supply Devices Market Analysis, Insights and Forecast, 2019-2031
- 9.1. Market Analysis, Insights and Forecast - by Device Type
- 9.1.1. AC-DC Power Supplies
- 9.1.2. DC-DC Converters
- 9.2. Market Analysis, Insights and Forecast - by End-user Industry
- 9.2.1. Communication
- 9.2.2. Industrial
- 9.2.3. Consumer and Mobile
- 9.2.4. Automotive
- 9.2.5. Transportation
- 9.2.6. Lighting
- 9.2.7. Other End-user Industries
- 9.1. Market Analysis, Insights and Forecast - by Device Type
- 10. Middle East and Africa Power Supply Devices Market Analysis, Insights and Forecast, 2019-2031
- 10.1. Market Analysis, Insights and Forecast - by Device Type
- 10.1.1. AC-DC Power Supplies
- 10.1.2. DC-DC Converters
- 10.2. Market Analysis, Insights and Forecast - by End-user Industry
- 10.2.1. Communication
- 10.2.2. Industrial
- 10.2.3. Consumer and Mobile
- 10.2.4. Automotive
- 10.2.5. Transportation
- 10.2.6. Lighting
- 10.2.7. Other End-user Industries
- 10.1. Market Analysis, Insights and Forecast - by Device Type
- 11. Americas Power Supply Devices Market Analysis, Insights and Forecast, 2019-2031
- 11.1. Market Analysis, Insights and Forecast - By Country/Sub-region
- 11.1.1.
- 12. Europe Power Supply Devices Market Analysis, Insights and Forecast, 2019-2031
- 12.1. Market Analysis, Insights and Forecast - By Country/Sub-region
- 12.1.1.
- 13. Asia Power Supply Devices Market Analysis, Insights and Forecast, 2019-2031
- 13.1. Market Analysis, Insights and Forecast - By Country/Sub-region
- 13.1.1.
- 14. Australia and New Zealand Power Supply Devices Market Analysis, Insights and Forecast, 2019-2031
- 14.1. Market Analysis, Insights and Forecast - By Country/Sub-region
- 14.1.1.
- 15. Middle East and Africa Power Supply Devices Market Analysis, Insights and Forecast, 2019-2031
- 15.1. Market Analysis, Insights and Forecast - By Country/Sub-region
- 15.1.1.
- 16. Competitive Analysis
- 16.1. Global Market Share Analysis 2024
- 16.2. Company Profiles
- 16.2.1 Delta Electronics Inc
- 16.2.1.1. Overview
- 16.2.1.2. Products
- 16.2.1.3. SWOT Analysis
- 16.2.1.4. Recent Developments
- 16.2.1.5. Financials (Based on Availability)
- 16.2.2 Lite-On Technology Corporation
- 16.2.2.1. Overview
- 16.2.2.2. Products
- 16.2.2.3. SWOT Analysis
- 16.2.2.4. Recent Developments
- 16.2.2.5. Financials (Based on Availability)
- 16.2.3 Emerson Electric Co
- 16.2.3.1. Overview
- 16.2.3.2. Products
- 16.2.3.3. SWOT Analysis
- 16.2.3.4. Recent Developments
- 16.2.3.5. Financials (Based on Availability)
- 16.2.4 Siemens AG
- 16.2.4.1. Overview
- 16.2.4.2. Products
- 16.2.4.3. SWOT Analysis
- 16.2.4.4. Recent Developments
- 16.2.4.5. Financials (Based on Availability)
- 16.2.5 Salcomp PLC
- 16.2.5.1. Overview
- 16.2.5.2. Products
- 16.2.5.3. SWOT Analysis
- 16.2.5.4. Recent Developments
- 16.2.5.5. Financials (Based on Availability)
- 16.2.6 Acbel Polytech Inc
- 16.2.6.1. Overview
- 16.2.6.2. Products
- 16.2.6.3. SWOT Analysis
- 16.2.6.4. Recent Developments
- 16.2.6.5. Financials (Based on Availability)
- 16.2.7 Mean Well Enterprises Co Ltd
- 16.2.7.1. Overview
- 16.2.7.2. Products
- 16.2.7.3. SWOT Analysis
- 16.2.7.4. Recent Developments
- 16.2.7.5. Financials (Based on Availability)
- 16.2.8 Murata Manufacturing Co Ltd
- 16.2.8.1. Overview
- 16.2.8.2. Products
- 16.2.8.3. SWOT Analysis
- 16.2.8.4. Recent Developments
- 16.2.8.5. Financials (Based on Availability)
- 16.2.9 TDK-Lambda Corporation (TDK Corporation
- 16.2.9.1. Overview
- 16.2.9.2. Products
- 16.2.9.3. SWOT Analysis
- 16.2.9.4. Recent Developments
- 16.2.9.5. Financials (Based on Availability)
- 16.2.1 Delta Electronics Inc
List of Figures
- Figure 1: Global Power Supply Devices Market Revenue Breakdown (Million, %) by Region 2024 & 2032
- Figure 2: Global Power Supply Devices Market Volume Breakdown (K Unit, %) by Region 2024 & 2032
- Figure 3: Americas Power Supply Devices Market Revenue (Million), by Country 2024 & 2032
- Figure 4: Americas Power Supply Devices Market Volume (K Unit), by Country 2024 & 2032
- Figure 5: Americas Power Supply Devices Market Revenue Share (%), by Country 2024 & 2032
- Figure 6: Americas Power Supply Devices Market Volume Share (%), by Country 2024 & 2032
- Figure 7: Europe Power Supply Devices Market Revenue (Million), by Country 2024 & 2032
- Figure 8: Europe Power Supply Devices Market Volume (K Unit), by Country 2024 & 2032
- Figure 9: Europe Power Supply Devices Market Revenue Share (%), by Country 2024 & 2032
- Figure 10: Europe Power Supply Devices Market Volume Share (%), by Country 2024 & 2032
- Figure 11: Asia Power Supply Devices Market Revenue (Million), by Country 2024 & 2032
- Figure 12: Asia Power Supply Devices Market Volume (K Unit), by Country 2024 & 2032
- Figure 13: Asia Power Supply Devices Market Revenue Share (%), by Country 2024 & 2032
- Figure 14: Asia Power Supply Devices Market Volume Share (%), by Country 2024 & 2032
- Figure 15: Australia and New Zealand Power Supply Devices Market Revenue (Million), by Country 2024 & 2032
- Figure 16: Australia and New Zealand Power Supply Devices Market Volume (K Unit), by Country 2024 & 2032
- Figure 17: Australia and New Zealand Power Supply Devices Market Revenue Share (%), by Country 2024 & 2032
- Figure 18: Australia and New Zealand Power Supply Devices Market Volume Share (%), by Country 2024 & 2032
- Figure 19: Middle East and Africa Power Supply Devices Market Revenue (Million), by Country 2024 & 2032
- Figure 20: Middle East and Africa Power Supply Devices Market Volume (K Unit), by Country 2024 & 2032
- Figure 21: Middle East and Africa Power Supply Devices Market Revenue Share (%), by Country 2024 & 2032
- Figure 22: Middle East and Africa Power Supply Devices Market Volume Share (%), by Country 2024 & 2032
- Figure 23: Americas Power Supply Devices Market Revenue (Million), by Device Type 2024 & 2032
- Figure 24: Americas Power Supply Devices Market Volume (K Unit), by Device Type 2024 & 2032
- Figure 25: Americas Power Supply Devices Market Revenue Share (%), by Device Type 2024 & 2032
- Figure 26: Americas Power Supply Devices Market Volume Share (%), by Device Type 2024 & 2032
- Figure 27: Americas Power Supply Devices Market Revenue (Million), by End-user Industry 2024 & 2032
- Figure 28: Americas Power Supply Devices Market Volume (K Unit), by End-user Industry 2024 & 2032
- Figure 29: Americas Power Supply Devices Market Revenue Share (%), by End-user Industry 2024 & 2032
- Figure 30: Americas Power Supply Devices Market Volume Share (%), by End-user Industry 2024 & 2032
- Figure 31: Americas Power Supply Devices Market Revenue (Million), by Country 2024 & 2032
- Figure 32: Americas Power Supply Devices Market Volume (K Unit), by Country 2024 & 2032
- Figure 33: Americas Power Supply Devices Market Revenue Share (%), by Country 2024 & 2032
- Figure 34: Americas Power Supply Devices Market Volume Share (%), by Country 2024 & 2032
- Figure 35: Europe Power Supply Devices Market Revenue (Million), by Device Type 2024 & 2032
- Figure 36: Europe Power Supply Devices Market Volume (K Unit), by Device Type 2024 & 2032
- Figure 37: Europe Power Supply Devices Market Revenue Share (%), by Device Type 2024 & 2032
- Figure 38: Europe Power Supply Devices Market Volume Share (%), by Device Type 2024 & 2032
- Figure 39: Europe Power Supply Devices Market Revenue (Million), by End-user Industry 2024 & 2032
- Figure 40: Europe Power Supply Devices Market Volume (K Unit), by End-user Industry 2024 & 2032
- Figure 41: Europe Power Supply Devices Market Revenue Share (%), by End-user Industry 2024 & 2032
- Figure 42: Europe Power Supply Devices Market Volume Share (%), by End-user Industry 2024 & 2032
- Figure 43: Europe Power Supply Devices Market Revenue (Million), by Country 2024 & 2032
- Figure 44: Europe Power Supply Devices Market Volume (K Unit), by Country 2024 & 2032
- Figure 45: Europe Power Supply Devices Market Revenue Share (%), by Country 2024 & 2032
- Figure 46: Europe Power Supply Devices Market Volume Share (%), by Country 2024 & 2032
- Figure 47: Asia Power Supply Devices Market Revenue (Million), by Device Type 2024 & 2032
- Figure 48: Asia Power Supply Devices Market Volume (K Unit), by Device Type 2024 & 2032
- Figure 49: Asia Power Supply Devices Market Revenue Share (%), by Device Type 2024 & 2032
- Figure 50: Asia Power Supply Devices Market Volume Share (%), by Device Type 2024 & 2032
- Figure 51: Asia Power Supply Devices Market Revenue (Million), by End-user Industry 2024 & 2032
- Figure 52: Asia Power Supply Devices Market Volume (K Unit), by End-user Industry 2024 & 2032
- Figure 53: Asia Power Supply Devices Market Revenue Share (%), by End-user Industry 2024 & 2032
- Figure 54: Asia Power Supply Devices Market Volume Share (%), by End-user Industry 2024 & 2032
- Figure 55: Asia Power Supply Devices Market Revenue (Million), by Country 2024 & 2032
- Figure 56: Asia Power Supply Devices Market Volume (K Unit), by Country 2024 & 2032
- Figure 57: Asia Power Supply Devices Market Revenue Share (%), by Country 2024 & 2032
- Figure 58: Asia Power Supply Devices Market Volume Share (%), by Country 2024 & 2032
- Figure 59: Australia and New Zealand Power Supply Devices Market Revenue (Million), by Device Type 2024 & 2032
- Figure 60: Australia and New Zealand Power Supply Devices Market Volume (K Unit), by Device Type 2024 & 2032
- Figure 61: Australia and New Zealand Power Supply Devices Market Revenue Share (%), by Device Type 2024 & 2032
- Figure 62: Australia and New Zealand Power Supply Devices Market Volume Share (%), by Device Type 2024 & 2032
- Figure 63: Australia and New Zealand Power Supply Devices Market Revenue (Million), by End-user Industry 2024 & 2032
- Figure 64: Australia and New Zealand Power Supply Devices Market Volume (K Unit), by End-user Industry 2024 & 2032
- Figure 65: Australia and New Zealand Power Supply Devices Market Revenue Share (%), by End-user Industry 2024 & 2032
- Figure 66: Australia and New Zealand Power Supply Devices Market Volume Share (%), by End-user Industry 2024 & 2032
- Figure 67: Australia and New Zealand Power Supply Devices Market Revenue (Million), by Country 2024 & 2032
- Figure 68: Australia and New Zealand Power Supply Devices Market Volume (K Unit), by Country 2024 & 2032
- Figure 69: Australia and New Zealand Power Supply Devices Market Revenue Share (%), by Country 2024 & 2032
- Figure 70: Australia and New Zealand Power Supply Devices Market Volume Share (%), by Country 2024 & 2032
- Figure 71: Middle East and Africa Power Supply Devices Market Revenue (Million), by Device Type 2024 & 2032
- Figure 72: Middle East and Africa Power Supply Devices Market Volume (K Unit), by Device Type 2024 & 2032
- Figure 73: Middle East and Africa Power Supply Devices Market Revenue Share (%), by Device Type 2024 & 2032
- Figure 74: Middle East and Africa Power Supply Devices Market Volume Share (%), by Device Type 2024 & 2032
- Figure 75: Middle East and Africa Power Supply Devices Market Revenue (Million), by End-user Industry 2024 & 2032
- Figure 76: Middle East and Africa Power Supply Devices Market Volume (K Unit), by End-user Industry 2024 & 2032
- Figure 77: Middle East and Africa Power Supply Devices Market Revenue Share (%), by End-user Industry 2024 & 2032
- Figure 78: Middle East and Africa Power Supply Devices Market Volume Share (%), by End-user Industry 2024 & 2032
- Figure 79: Middle East and Africa Power Supply Devices Market Revenue (Million), by Country 2024 & 2032
- Figure 80: Middle East and Africa Power Supply Devices Market Volume (K Unit), by Country 2024 & 2032
- Figure 81: Middle East and Africa Power Supply Devices Market Revenue Share (%), by Country 2024 & 2032
- Figure 82: Middle East and Africa Power Supply Devices Market Volume Share (%), by Country 2024 & 2032
List of Tables
- Table 1: Global Power Supply Devices Market Revenue Million Forecast, by Region 2019 & 2032
- Table 2: Global Power Supply Devices Market Volume K Unit Forecast, by Region 2019 & 2032
- Table 3: Global Power Supply Devices Market Revenue Million Forecast, by Device Type 2019 & 2032
- Table 4: Global Power Supply Devices Market Volume K Unit Forecast, by Device Type 2019 & 2032
- Table 5: Global Power Supply Devices Market Revenue Million Forecast, by End-user Industry 2019 & 2032
- Table 6: Global Power Supply Devices Market Volume K Unit Forecast, by End-user Industry 2019 & 2032
- Table 7: Global Power Supply Devices Market Revenue Million Forecast, by Region 2019 & 2032
- Table 8: Global Power Supply Devices Market Volume K Unit Forecast, by Region 2019 & 2032
- Table 9: Global Power Supply Devices Market Revenue Million Forecast, by Country 2019 & 2032
- Table 10: Global Power Supply Devices Market Volume K Unit Forecast, by Country 2019 & 2032
- Table 11: Power Supply Devices Market Revenue (Million) Forecast, by Application 2019 & 2032
- Table 12: Power Supply Devices Market Volume (K Unit) Forecast, by Application 2019 & 2032
- Table 13: Global Power Supply Devices Market Revenue Million Forecast, by Country 2019 & 2032
- Table 14: Global Power Supply Devices Market Volume K Unit Forecast, by Country 2019 & 2032
- Table 15: Power Supply Devices Market Revenue (Million) Forecast, by Application 2019 & 2032
- Table 16: Power Supply Devices Market Volume (K Unit) Forecast, by Application 2019 & 2032
- Table 17: Global Power Supply Devices Market Revenue Million Forecast, by Country 2019 & 2032
- Table 18: Global Power Supply Devices Market Volume K Unit Forecast, by Country 2019 & 2032
- Table 19: Power Supply Devices Market Revenue (Million) Forecast, by Application 2019 & 2032
- Table 20: Power Supply Devices Market Volume (K Unit) Forecast, by Application 2019 & 2032
- Table 21: Global Power Supply Devices Market Revenue Million Forecast, by Country 2019 & 2032
- Table 22: Global Power Supply Devices Market Volume K Unit Forecast, by Country 2019 & 2032
- Table 23: Power Supply Devices Market Revenue (Million) Forecast, by Application 2019 & 2032
- Table 24: Power Supply Devices Market Volume (K Unit) Forecast, by Application 2019 & 2032
- Table 25: Global Power Supply Devices Market Revenue Million Forecast, by Country 2019 & 2032
- Table 26: Global Power Supply Devices Market Volume K Unit Forecast, by Country 2019 & 2032
- Table 27: Power Supply Devices Market Revenue (Million) Forecast, by Application 2019 & 2032
- Table 28: Power Supply Devices Market Volume (K Unit) Forecast, by Application 2019 & 2032
- Table 29: Global Power Supply Devices Market Revenue Million Forecast, by Device Type 2019 & 2032
- Table 30: Global Power Supply Devices Market Volume K Unit Forecast, by Device Type 2019 & 2032
- Table 31: Global Power Supply Devices Market Revenue Million Forecast, by End-user Industry 2019 & 2032
- Table 32: Global Power Supply Devices Market Volume K Unit Forecast, by End-user Industry 2019 & 2032
- Table 33: Global Power Supply Devices Market Revenue Million Forecast, by Country 2019 & 2032
- Table 34: Global Power Supply Devices Market Volume K Unit Forecast, by Country 2019 & 2032
- Table 35: Global Power Supply Devices Market Revenue Million Forecast, by Device Type 2019 & 2032
- Table 36: Global Power Supply Devices Market Volume K Unit Forecast, by Device Type 2019 & 2032
- Table 37: Global Power Supply Devices Market Revenue Million Forecast, by End-user Industry 2019 & 2032
- Table 38: Global Power Supply Devices Market Volume K Unit Forecast, by End-user Industry 2019 & 2032
- Table 39: Global Power Supply Devices Market Revenue Million Forecast, by Country 2019 & 2032
- Table 40: Global Power Supply Devices Market Volume K Unit Forecast, by Country 2019 & 2032
- Table 41: Global Power Supply Devices Market Revenue Million Forecast, by Device Type 2019 & 2032
- Table 42: Global Power Supply Devices Market Volume K Unit Forecast, by Device Type 2019 & 2032
- Table 43: Global Power Supply Devices Market Revenue Million Forecast, by End-user Industry 2019 & 2032
- Table 44: Global Power Supply Devices Market Volume K Unit Forecast, by End-user Industry 2019 & 2032
- Table 45: Global Power Supply Devices Market Revenue Million Forecast, by Country 2019 & 2032
- Table 46: Global Power Supply Devices Market Volume K Unit Forecast, by Country 2019 & 2032
- Table 47: Global Power Supply Devices Market Revenue Million Forecast, by Device Type 2019 & 2032
- Table 48: Global Power Supply Devices Market Volume K Unit Forecast, by Device Type 2019 & 2032
- Table 49: Global Power Supply Devices Market Revenue Million Forecast, by End-user Industry 2019 & 2032
- Table 50: Global Power Supply Devices Market Volume K Unit Forecast, by End-user Industry 2019 & 2032
- Table 51: Global Power Supply Devices Market Revenue Million Forecast, by Country 2019 & 2032
- Table 52: Global Power Supply Devices Market Volume K Unit Forecast, by Country 2019 & 2032
- Table 53: Global Power Supply Devices Market Revenue Million Forecast, by Device Type 2019 & 2032
- Table 54: Global Power Supply Devices Market Volume K Unit Forecast, by Device Type 2019 & 2032
- Table 55: Global Power Supply Devices Market Revenue Million Forecast, by End-user Industry 2019 & 2032
- Table 56: Global Power Supply Devices Market Volume K Unit Forecast, by End-user Industry 2019 & 2032
- Table 57: Global Power Supply Devices Market Revenue Million Forecast, by Country 2019 & 2032
- Table 58: Global Power Supply Devices Market Volume K Unit Forecast, by Country 2019 & 2032
Frequently Asked Questions
1. What is the projected Compound Annual Growth Rate (CAGR) of the Power Supply Devices Market?
The projected CAGR is approximately 6.57%.
2. Which companies are prominent players in the Power Supply Devices Market?
Key companies in the market include Delta Electronics Inc, Lite-On Technology Corporation, Emerson Electric Co, Siemens AG, Salcomp PLC, Acbel Polytech Inc, Mean Well Enterprises Co Ltd, Murata Manufacturing Co Ltd, TDK-Lambda Corporation (TDK Corporation.
3. What are the main segments of the Power Supply Devices Market?
The market segments include Device Type, End-user Industry.
4. Can you provide details about the market size?
The market size is estimated to be USD 33.65 Million as of 2022.
5. What are some drivers contributing to market growth?
Growing Adoption of Home and Building Automation Systems; Increasing Demand for Energy-efficient Devices.
6. What are the notable trends driving market growth?
Consumer and Mobile Segment to Witness Major Growth.
7. Are there any restraints impacting market growth?
Stringent Regulatory Compliance and Safety Standards.
8. Can you provide examples of recent developments in the market?
November 2023: Vox Power announced the introduction of the VCCR300 Conduction Cooled Power Series, a robust, rugged, and highly reliable DC/DC power supply capable of silently delivering 300 Watts of power. The VCCR300 Series provides a wider DC input voltage range, including the standard 48V, 72V, 96V, and 110V railway battery requirements as outlined in EN50155.
9. What pricing options are available for accessing the report?
Pricing options include single-user, multi-user, and enterprise licenses priced at USD 4750, USD 5250, and USD 8750 respectively.
10. Is the market size provided in terms of value or volume?
The market size is provided in terms of value, measured in Million and volume, measured in K Unit.
11. Are there any specific market keywords associated with the report?
Yes, the market keyword associated with the report is "Power Supply Devices Market," which aids in identifying and referencing the specific market segment covered.
12. How do I determine which pricing option suits my needs best?
The pricing options vary based on user requirements and access needs. Individual users may opt for single-user licenses, while businesses requiring broader access may choose multi-user or enterprise licenses for cost-effective access to the report.
13. Are there any additional resources or data provided in the Power Supply Devices Market report?
While the report offers comprehensive insights, it's advisable to review the specific contents or supplementary materials provided to ascertain if additional resources or data are available.
14. How can I stay updated on further developments or reports in the Power Supply Devices Market?
To stay informed about further developments, trends, and reports in the Power Supply Devices Market, consider subscribing to industry newsletters, following relevant companies and organizations, or regularly checking reputable industry news sources and publications.
Methodology
Step 1 - Identification of Relevant Samples Size from Population Database


Step 2 - Approaches for Defining Global Market Size (Value, Volume* & Price*)

Note*: In applicable scenarios
Step 3 - Data Sources
Primary Research
- Web Analytics
- Survey Reports
- Research Institute
- Latest Research Reports
- Opinion Leaders
Secondary Research
- Annual Reports
- White Paper
- Latest Press Release
- Industry Association
- Paid Database
- Investor Presentations

Step 4 - Data Triangulation
Involves using different sources of information in order to increase the validity of a study
These sources are likely to be stakeholders in a program - participants, other researchers, program staff, other community members, and so on.
Then we put all data in single framework & apply various statistical tools to find out the dynamic on the market.
During the analysis stage, feedback from the stakeholder groups would be compared to determine areas of agreement as well as areas of divergence
