

Key Insights
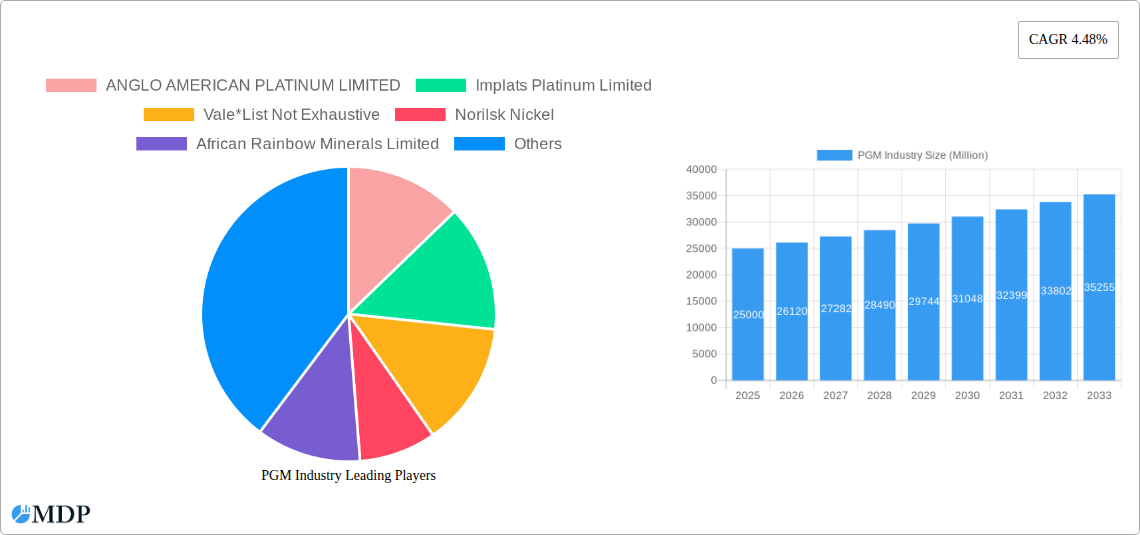
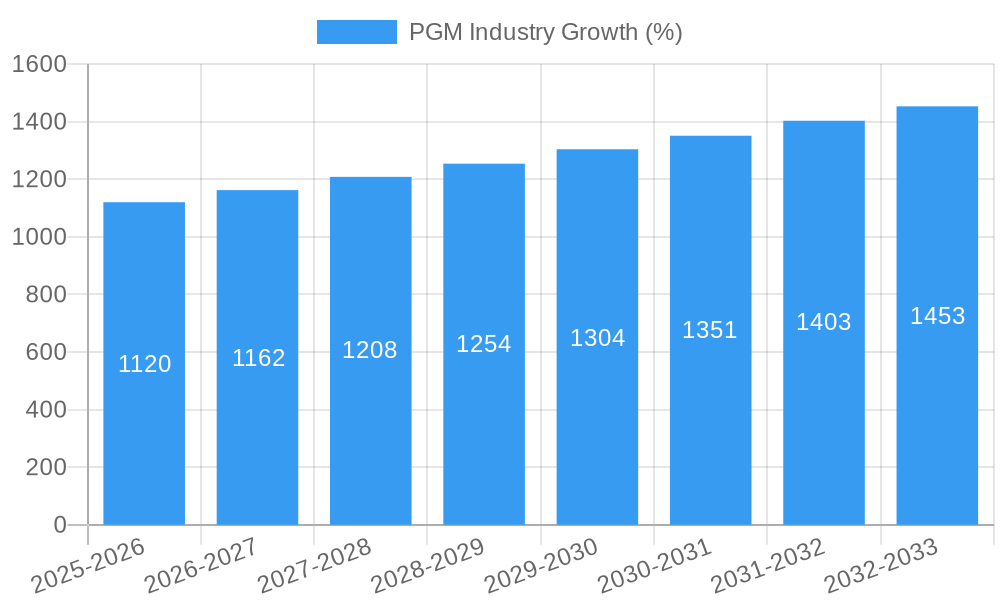
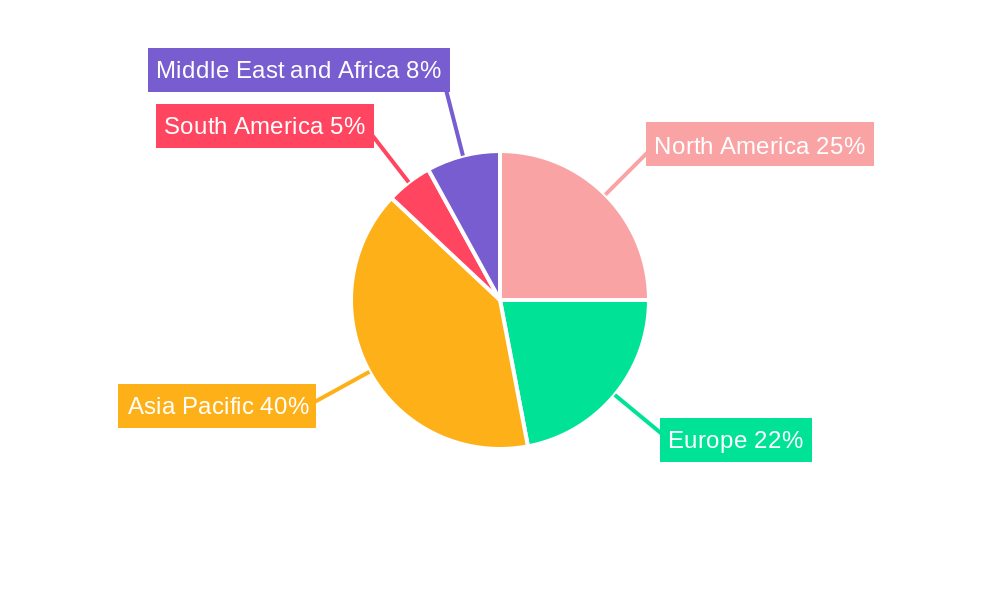
The Platinum Group Metals (PGM) industry, encompassing platinum, palladium, rhodium, iridium, ruthenium, and osmium, is experiencing steady growth, projected at a 4.48% CAGR from 2025 to 2033. This expansion is driven primarily by the burgeoning automotive catalyst market, where PGMs are crucial for reducing harmful emissions. The increasing demand for electric vehicles, while initially seeming counterintuitive, actually contributes to PGM demand due to the continued use of PGMs in fuel cells and other vehicle components. Furthermore, the electronics industry’s reliance on PGMs for applications such as circuit boards and sensors fuels consistent growth. Growth in the jewelry sector, particularly for platinum and palladium, also plays a significant, albeit less impactful, role in overall market size. While supply constraints and fluctuating prices represent challenges, technological advancements in PGM recycling and the exploration of new applications, such as hydrogen fuel cells and water treatment, are mitigating these risks and fostering long-term growth. Regional variations exist, with Asia-Pacific, particularly China and India, exhibiting significant growth due to robust industrialization and expanding automotive sectors. North America and Europe also remain substantial markets, driven by automotive and industrial applications.
The segmentation of the PGM market reveals the dominance of autocatalysts as the largest application segment, followed by electrical and electronics. The jewelry sector, while representing a considerable portion, is less impactful on the overall market growth rate compared to industrial applications. The medical and chemical industries represent smaller but growing niche markets, showcasing the diverse utility of PGMs. While major players like Anglo American Platinum, Impala Platinum, Norilsk Nickel, and Glencore control a significant portion of the market, smaller companies specializing in specific applications or recycling are also becoming increasingly influential. The forecast period indicates a continued upward trend, though volatility in prices and geopolitical factors will continue to impact the overall market dynamics. Future growth will be significantly influenced by the global shift towards cleaner energy technologies and continued technological innovation within various sectors.
PGM Industry Market Report: 2019-2033 Forecast
This comprehensive report provides an in-depth analysis of the Platinum Group Metals (PGM) industry, offering invaluable insights for stakeholders seeking to navigate the complexities of this dynamic market. The report covers the period 2019-2033, with a base year of 2025 and a forecast period of 2025-2033. Projected market values are in Millions.
PGM Industry Market Dynamics & Concentration
The PGM market, driven by robust demand from autocatalysts and emerging applications like fuel cells, exhibits a moderately concentrated structure. Key players like Anglo American Platinum Limited, Implats Platinum Limited, and Sibanye-Stillwater hold significant market share, though the exact figures fluctuate. The market share of the top three players is estimated at xx%. Innovation in PGM extraction and refining technologies, particularly focusing on sustainability and reduced environmental impact, is a key driver. Stringent environmental regulations worldwide are shaping industry practices, pushing companies to adopt cleaner production methods. The emergence of substitute materials is a long-term threat, though their widespread adoption remains limited due to performance limitations. End-user trends favour electrification, boosting demand for PGMs in electric vehicles and fuel cells. M&A activity is frequent, with recent examples including Sibanye-Stillwater's acquisition of Reldan, highlighting industry consolidation and the pursuit of greater recycling capabilities. The number of M&A deals between 2019-2024 is estimated at xx, reflecting the strategic importance of acquisitions for securing resources and expanding market share.
- Market Concentration: Top 3 players hold approximately xx% market share (2025 estimate).
- Innovation Drivers: Sustainable extraction, refining technologies, and enhanced recycling.
- Regulatory Frameworks: Stringent environmental regulations driving cleaner production.
- Product Substitutes: Limited viable substitutes exist currently.
- End-User Trends: Growing demand from electric vehicles and fuel cells.
- M&A Activity: xx deals between 2019 and 2024, with ongoing consolidation.
PGM Industry Industry Trends & Analysis
The PGM industry is experiencing robust growth, driven primarily by the rising demand for autocatalysts in the automotive sector and the burgeoning fuel cell market. The Compound Annual Growth Rate (CAGR) for the period 2025-2033 is estimated at xx%. Technological advancements in PGM extraction and refining processes are improving efficiency and lowering production costs. Increased consumer awareness of environmental issues is also positively impacting demand, particularly for cleaner energy technologies incorporating PGMs. The competitive landscape is characterized by intense rivalry among major producers, leading to innovation and efficiency improvements. Market penetration in the fuel cell sector is projected to reach xx% by 2033, driven by government incentives and growing environmental concerns.
Leading Markets & Segments in PGM Industry
The autocatalyst segment remains the dominant application for PGMs, accounting for approximately xx% of global consumption in 2025. Platinum and palladium are the most widely used metals in this segment. The electrical and electronics sector is another significant consumer, followed by the burgeoning fuel cell market. Geographically, significant markets include South Africa, Russia, and North America.
- Dominant Region/Country: South Africa (major producer) and China (major consumer)
- Dominant Metal Type: Platinum and Palladium, followed by Rhodium
- Dominant Application: Autocatalysts, then Electrical and Electronics.
Key Drivers:
- Autocatalyst Demand: Driven by stricter emission regulations globally.
- Fuel Cell Growth: Expansion of hydrogen fuel cell vehicle production.
- Economic Growth: Rising disposable incomes in developing countries.
- Government Policies: Support for clean energy technologies and electric vehicles.
- Infrastructure Development: Increased investment in electrical grids and charging stations.
PGM Industry Product Developments
Recent product innovations focus on enhancing the efficiency of PGM-based catalysts, improving their durability, and reducing their environmental impact. This involves the development of novel alloys and nano-structured materials. The market emphasizes producing cost-effective and high-performance PGMs, catering to the demands of various end-use industries. New applications are constantly being explored, particularly in the energy storage and medical fields, expanding the market's potential.
Key Drivers of PGM Industry Growth
Several factors are propelling the growth of the PGM industry. The automotive sector's transition to cleaner vehicles, spurred by emission standards, is a key driver. The rising adoption of fuel cells, particularly in transportation and stationary power generation, is another significant factor. Government incentives and supportive policies towards clean energy technologies are boosting investment and demand.
Challenges in the PGM Industry Market
The PGM industry faces several challenges. Price volatility due to supply chain disruptions and fluctuating demand remains a concern. Stringent environmental regulations increase the cost of production and compliance. The potential for the emergence of substitute materials poses a long-term threat.
Emerging Opportunities in PGM Industry
The growth of the electric vehicle market and the increasing demand for fuel cells present substantial opportunities for the PGM industry. Strategic partnerships and collaborations to develop next-generation PGM-based technologies will drive innovation and market expansion. The recycling of PGMs from end-of-life products is also a growing area of opportunity, contributing to a more circular economy.
Leading Players in the PGM Industry Sector
- ANGLO AMERICAN PLATINUM LIMITED
- Implats Platinum Limited
- Vale
- Norilsk Nickel
- African Rainbow Minerals Limited
- GLENCORE
- Northam Platinum Holdings Limited
- Johnson Matthey
- Sibanye-Stillwater
- Platinum Group Metals Ltd
Key Milestones in PGM Industry Industry
- November 2023: Sibanye-Stillwater's acquisition of Reldan strengthens its recycling capabilities and expands its access to secondary PGM sources.
- October 2023: Anglo American's collaboration with BMW and Sasol demonstrates the growing importance of PGMs in hydrogen fuel cell technology.
Strategic Outlook for PGM Industry Market
The PGM industry's future is bright, driven by sustained demand from the automotive and energy sectors. Strategic investments in research and development, sustainable mining practices, and recycling technologies will be crucial for long-term growth and profitability. The industry should prioritize collaborations to drive innovation and secure supply chains, ensuring future market competitiveness.
PGM Industry Segmentation
-
1. Metal Type
- 1.1. Platinum
- 1.2. Palladium
- 1.3. Rhodium
- 1.4. Iridium
- 1.5. Ruthenium
- 1.6. Osmium
-
2. Application
- 2.1. Auto Catalysts
- 2.2. Electrical and Electronics
- 2.3. Fuel Cells
- 2.4. Glass, Ceramics, and Pigments
- 2.5. Jewellery
- 2.6. Medical (Dental and Pharmaceuticals)
- 2.7. Chemical Industry
- 2.8. Other Ap
PGM Industry Segmentation By Geography
-
1. Asia Pacific
- 1.1. China
- 1.2. India
- 1.3. Japan
- 1.4. South Korea
- 1.5. ASEAN Countries
- 1.6. Rest of Asia Pacific
-
2. North America
- 2.1. United States
- 2.2. Canada
- 2.3. Mexico
-
3. Europe
- 3.1. Germany
- 3.2. United Kingdom
- 3.3. Italy
- 3.4. France
- 3.5. Rest of Europe
-
4. South America
- 4.1. Brazil
- 4.2. Argentina
- 4.3. Rest of South America
-
5. Middle East and Africa
- 5.1. Saudi Arabia
- 5.2. South Africa
- 5.3. Rest of Middle East and Africa
PGM Industry REPORT HIGHLIGHTS
| Aspects | Details |
|---|---|
| Study Period | 2019-2033 |
| Base Year | 2024 |
| Estimated Year | 2025 |
| Forecast Period | 2025-2033 |
| Historical Period | 2019-2024 |
| Growth Rate | CAGR of 4.48% from 2019-2033 |
| Segmentation |
|
Table of Contents
- 1. Introduction
- 1.1. Research Scope
- 1.2. Market Segmentation
- 1.3. Research Methodology
- 1.4. Definitions and Assumptions
- 2. Executive Summary
- 2.1. Introduction
- 3. Market Dynamics
- 3.1. Introduction
- 3.2. Market Drivers
- 3.2.1 Growing Demand for Catalytic Converters from the Automotive Industry; Increasing Demand for Platinum
- 3.2.2 Palladium
- 3.2.3 and Ruthenium from the Electronics Industry; Growing Jewelry Consumption in Asia-Pacific Countries
- 3.3. Market Restrains
- 3.3.1. High Costs Involved in Production and Maintenance; Other Restraints
- 3.4. Market Trends
- 3.4.1. Autocatalysts Segment to Dominate the Market
- 4. Market Factor Analysis
- 4.1. Porters Five Forces
- 4.2. Supply/Value Chain
- 4.3. PESTEL analysis
- 4.4. Market Entropy
- 4.5. Patent/Trademark Analysis
- 5. Global PGM Industry Analysis, Insights and Forecast, 2019-2031
- 5.1. Market Analysis, Insights and Forecast - by Metal Type
- 5.1.1. Platinum
- 5.1.2. Palladium
- 5.1.3. Rhodium
- 5.1.4. Iridium
- 5.1.5. Ruthenium
- 5.1.6. Osmium
- 5.2. Market Analysis, Insights and Forecast - by Application
- 5.2.1. Auto Catalysts
- 5.2.2. Electrical and Electronics
- 5.2.3. Fuel Cells
- 5.2.4. Glass, Ceramics, and Pigments
- 5.2.5. Jewellery
- 5.2.6. Medical (Dental and Pharmaceuticals)
- 5.2.7. Chemical Industry
- 5.2.8. Other Ap
- 5.3. Market Analysis, Insights and Forecast - by Region
- 5.3.1. Asia Pacific
- 5.3.2. North America
- 5.3.3. Europe
- 5.3.4. South America
- 5.3.5. Middle East and Africa
- 5.1. Market Analysis, Insights and Forecast - by Metal Type
- 6. Asia Pacific PGM Industry Analysis, Insights and Forecast, 2019-2031
- 6.1. Market Analysis, Insights and Forecast - by Metal Type
- 6.1.1. Platinum
- 6.1.2. Palladium
- 6.1.3. Rhodium
- 6.1.4. Iridium
- 6.1.5. Ruthenium
- 6.1.6. Osmium
- 6.2. Market Analysis, Insights and Forecast - by Application
- 6.2.1. Auto Catalysts
- 6.2.2. Electrical and Electronics
- 6.2.3. Fuel Cells
- 6.2.4. Glass, Ceramics, and Pigments
- 6.2.5. Jewellery
- 6.2.6. Medical (Dental and Pharmaceuticals)
- 6.2.7. Chemical Industry
- 6.2.8. Other Ap
- 6.1. Market Analysis, Insights and Forecast - by Metal Type
- 7. North America PGM Industry Analysis, Insights and Forecast, 2019-2031
- 7.1. Market Analysis, Insights and Forecast - by Metal Type
- 7.1.1. Platinum
- 7.1.2. Palladium
- 7.1.3. Rhodium
- 7.1.4. Iridium
- 7.1.5. Ruthenium
- 7.1.6. Osmium
- 7.2. Market Analysis, Insights and Forecast - by Application
- 7.2.1. Auto Catalysts
- 7.2.2. Electrical and Electronics
- 7.2.3. Fuel Cells
- 7.2.4. Glass, Ceramics, and Pigments
- 7.2.5. Jewellery
- 7.2.6. Medical (Dental and Pharmaceuticals)
- 7.2.7. Chemical Industry
- 7.2.8. Other Ap
- 7.1. Market Analysis, Insights and Forecast - by Metal Type
- 8. Europe PGM Industry Analysis, Insights and Forecast, 2019-2031
- 8.1. Market Analysis, Insights and Forecast - by Metal Type
- 8.1.1. Platinum
- 8.1.2. Palladium
- 8.1.3. Rhodium
- 8.1.4. Iridium
- 8.1.5. Ruthenium
- 8.1.6. Osmium
- 8.2. Market Analysis, Insights and Forecast - by Application
- 8.2.1. Auto Catalysts
- 8.2.2. Electrical and Electronics
- 8.2.3. Fuel Cells
- 8.2.4. Glass, Ceramics, and Pigments
- 8.2.5. Jewellery
- 8.2.6. Medical (Dental and Pharmaceuticals)
- 8.2.7. Chemical Industry
- 8.2.8. Other Ap
- 8.1. Market Analysis, Insights and Forecast - by Metal Type
- 9. South America PGM Industry Analysis, Insights and Forecast, 2019-2031
- 9.1. Market Analysis, Insights and Forecast - by Metal Type
- 9.1.1. Platinum
- 9.1.2. Palladium
- 9.1.3. Rhodium
- 9.1.4. Iridium
- 9.1.5. Ruthenium
- 9.1.6. Osmium
- 9.2. Market Analysis, Insights and Forecast - by Application
- 9.2.1. Auto Catalysts
- 9.2.2. Electrical and Electronics
- 9.2.3. Fuel Cells
- 9.2.4. Glass, Ceramics, and Pigments
- 9.2.5. Jewellery
- 9.2.6. Medical (Dental and Pharmaceuticals)
- 9.2.7. Chemical Industry
- 9.2.8. Other Ap
- 9.1. Market Analysis, Insights and Forecast - by Metal Type
- 10. Middle East and Africa PGM Industry Analysis, Insights and Forecast, 2019-2031
- 10.1. Market Analysis, Insights and Forecast - by Metal Type
- 10.1.1. Platinum
- 10.1.2. Palladium
- 10.1.3. Rhodium
- 10.1.4. Iridium
- 10.1.5. Ruthenium
- 10.1.6. Osmium
- 10.2. Market Analysis, Insights and Forecast - by Application
- 10.2.1. Auto Catalysts
- 10.2.2. Electrical and Electronics
- 10.2.3. Fuel Cells
- 10.2.4. Glass, Ceramics, and Pigments
- 10.2.5. Jewellery
- 10.2.6. Medical (Dental and Pharmaceuticals)
- 10.2.7. Chemical Industry
- 10.2.8. Other Ap
- 10.1. Market Analysis, Insights and Forecast - by Metal Type
- 11. Asia Pacific PGM Industry Analysis, Insights and Forecast, 2019-2031
- 11.1. Market Analysis, Insights and Forecast - By Country/Sub-region
- 11.1.1 China
- 11.1.2 India
- 11.1.3 Japan
- 11.1.4 South Korea
- 11.1.5 ASEAN Countries
- 11.1.6 Rest of Asia Pacific
- 12. North America PGM Industry Analysis, Insights and Forecast, 2019-2031
- 12.1. Market Analysis, Insights and Forecast - By Country/Sub-region
- 12.1.1 United States
- 12.1.2 Canada
- 12.1.3 Mexico
- 13. Europe PGM Industry Analysis, Insights and Forecast, 2019-2031
- 13.1. Market Analysis, Insights and Forecast - By Country/Sub-region
- 13.1.1 Germany
- 13.1.2 United Kingdom
- 13.1.3 Italy
- 13.1.4 France
- 13.1.5 Rest of Europe
- 14. South America PGM Industry Analysis, Insights and Forecast, 2019-2031
- 14.1. Market Analysis, Insights and Forecast - By Country/Sub-region
- 14.1.1 Brazil
- 14.1.2 Argentina
- 14.1.3 Rest of South America
- 15. Middle East and Africa PGM Industry Analysis, Insights and Forecast, 2019-2031
- 15.1. Market Analysis, Insights and Forecast - By Country/Sub-region
- 15.1.1 Saudi Arabia
- 15.1.2 South Africa
- 15.1.3 Rest of Middle East and Africa
- 16. Competitive Analysis
- 16.1. Global Market Share Analysis 2024
- 16.2. Company Profiles
- 16.2.1 ANGLO AMERICAN PLATINUM LIMITED
- 16.2.1.1. Overview
- 16.2.1.2. Products
- 16.2.1.3. SWOT Analysis
- 16.2.1.4. Recent Developments
- 16.2.1.5. Financials (Based on Availability)
- 16.2.2 Implats Platinum Limited
- 16.2.2.1. Overview
- 16.2.2.2. Products
- 16.2.2.3. SWOT Analysis
- 16.2.2.4. Recent Developments
- 16.2.2.5. Financials (Based on Availability)
- 16.2.3 Vale*List Not Exhaustive
- 16.2.3.1. Overview
- 16.2.3.2. Products
- 16.2.3.3. SWOT Analysis
- 16.2.3.4. Recent Developments
- 16.2.3.5. Financials (Based on Availability)
- 16.2.4 Norilsk Nickel
- 16.2.4.1. Overview
- 16.2.4.2. Products
- 16.2.4.3. SWOT Analysis
- 16.2.4.4. Recent Developments
- 16.2.4.5. Financials (Based on Availability)
- 16.2.5 African Rainbow Minerals Limited
- 16.2.5.1. Overview
- 16.2.5.2. Products
- 16.2.5.3. SWOT Analysis
- 16.2.5.4. Recent Developments
- 16.2.5.5. Financials (Based on Availability)
- 16.2.6 GLENCORE
- 16.2.6.1. Overview
- 16.2.6.2. Products
- 16.2.6.3. SWOT Analysis
- 16.2.6.4. Recent Developments
- 16.2.6.5. Financials (Based on Availability)
- 16.2.7 Northam Platinum Holdings Limited
- 16.2.7.1. Overview
- 16.2.7.2. Products
- 16.2.7.3. SWOT Analysis
- 16.2.7.4. Recent Developments
- 16.2.7.5. Financials (Based on Availability)
- 16.2.8 Johnson Matthey
- 16.2.8.1. Overview
- 16.2.8.2. Products
- 16.2.8.3. SWOT Analysis
- 16.2.8.4. Recent Developments
- 16.2.8.5. Financials (Based on Availability)
- 16.2.9 Sibanye-Stillwater
- 16.2.9.1. Overview
- 16.2.9.2. Products
- 16.2.9.3. SWOT Analysis
- 16.2.9.4. Recent Developments
- 16.2.9.5. Financials (Based on Availability)
- 16.2.10 Platinum Group Metals Ltd
- 16.2.10.1. Overview
- 16.2.10.2. Products
- 16.2.10.3. SWOT Analysis
- 16.2.10.4. Recent Developments
- 16.2.10.5. Financials (Based on Availability)
- 16.2.1 ANGLO AMERICAN PLATINUM LIMITED
List of Figures
- Figure 1: Global PGM Industry Revenue Breakdown (Million, %) by Region 2024 & 2032
- Figure 2: Global PGM Industry Volume Breakdown (tons, %) by Region 2024 & 2032
- Figure 3: Asia Pacific PGM Industry Revenue (Million), by Country 2024 & 2032
- Figure 4: Asia Pacific PGM Industry Volume (tons), by Country 2024 & 2032
- Figure 5: Asia Pacific PGM Industry Revenue Share (%), by Country 2024 & 2032
- Figure 6: Asia Pacific PGM Industry Volume Share (%), by Country 2024 & 2032
- Figure 7: North America PGM Industry Revenue (Million), by Country 2024 & 2032
- Figure 8: North America PGM Industry Volume (tons), by Country 2024 & 2032
- Figure 9: North America PGM Industry Revenue Share (%), by Country 2024 & 2032
- Figure 10: North America PGM Industry Volume Share (%), by Country 2024 & 2032
- Figure 11: Europe PGM Industry Revenue (Million), by Country 2024 & 2032
- Figure 12: Europe PGM Industry Volume (tons), by Country 2024 & 2032
- Figure 13: Europe PGM Industry Revenue Share (%), by Country 2024 & 2032
- Figure 14: Europe PGM Industry Volume Share (%), by Country 2024 & 2032
- Figure 15: South America PGM Industry Revenue (Million), by Country 2024 & 2032
- Figure 16: South America PGM Industry Volume (tons), by Country 2024 & 2032
- Figure 17: South America PGM Industry Revenue Share (%), by Country 2024 & 2032
- Figure 18: South America PGM Industry Volume Share (%), by Country 2024 & 2032
- Figure 19: Middle East and Africa PGM Industry Revenue (Million), by Country 2024 & 2032
- Figure 20: Middle East and Africa PGM Industry Volume (tons), by Country 2024 & 2032
- Figure 21: Middle East and Africa PGM Industry Revenue Share (%), by Country 2024 & 2032
- Figure 22: Middle East and Africa PGM Industry Volume Share (%), by Country 2024 & 2032
- Figure 23: Asia Pacific PGM Industry Revenue (Million), by Metal Type 2024 & 2032
- Figure 24: Asia Pacific PGM Industry Volume (tons), by Metal Type 2024 & 2032
- Figure 25: Asia Pacific PGM Industry Revenue Share (%), by Metal Type 2024 & 2032
- Figure 26: Asia Pacific PGM Industry Volume Share (%), by Metal Type 2024 & 2032
- Figure 27: Asia Pacific PGM Industry Revenue (Million), by Application 2024 & 2032
- Figure 28: Asia Pacific PGM Industry Volume (tons), by Application 2024 & 2032
- Figure 29: Asia Pacific PGM Industry Revenue Share (%), by Application 2024 & 2032
- Figure 30: Asia Pacific PGM Industry Volume Share (%), by Application 2024 & 2032
- Figure 31: Asia Pacific PGM Industry Revenue (Million), by Country 2024 & 2032
- Figure 32: Asia Pacific PGM Industry Volume (tons), by Country 2024 & 2032
- Figure 33: Asia Pacific PGM Industry Revenue Share (%), by Country 2024 & 2032
- Figure 34: Asia Pacific PGM Industry Volume Share (%), by Country 2024 & 2032
- Figure 35: North America PGM Industry Revenue (Million), by Metal Type 2024 & 2032
- Figure 36: North America PGM Industry Volume (tons), by Metal Type 2024 & 2032
- Figure 37: North America PGM Industry Revenue Share (%), by Metal Type 2024 & 2032
- Figure 38: North America PGM Industry Volume Share (%), by Metal Type 2024 & 2032
- Figure 39: North America PGM Industry Revenue (Million), by Application 2024 & 2032
- Figure 40: North America PGM Industry Volume (tons), by Application 2024 & 2032
- Figure 41: North America PGM Industry Revenue Share (%), by Application 2024 & 2032
- Figure 42: North America PGM Industry Volume Share (%), by Application 2024 & 2032
- Figure 43: North America PGM Industry Revenue (Million), by Country 2024 & 2032
- Figure 44: North America PGM Industry Volume (tons), by Country 2024 & 2032
- Figure 45: North America PGM Industry Revenue Share (%), by Country 2024 & 2032
- Figure 46: North America PGM Industry Volume Share (%), by Country 2024 & 2032
- Figure 47: Europe PGM Industry Revenue (Million), by Metal Type 2024 & 2032
- Figure 48: Europe PGM Industry Volume (tons), by Metal Type 2024 & 2032
- Figure 49: Europe PGM Industry Revenue Share (%), by Metal Type 2024 & 2032
- Figure 50: Europe PGM Industry Volume Share (%), by Metal Type 2024 & 2032
- Figure 51: Europe PGM Industry Revenue (Million), by Application 2024 & 2032
- Figure 52: Europe PGM Industry Volume (tons), by Application 2024 & 2032
- Figure 53: Europe PGM Industry Revenue Share (%), by Application 2024 & 2032
- Figure 54: Europe PGM Industry Volume Share (%), by Application 2024 & 2032
- Figure 55: Europe PGM Industry Revenue (Million), by Country 2024 & 2032
- Figure 56: Europe PGM Industry Volume (tons), by Country 2024 & 2032
- Figure 57: Europe PGM Industry Revenue Share (%), by Country 2024 & 2032
- Figure 58: Europe PGM Industry Volume Share (%), by Country 2024 & 2032
- Figure 59: South America PGM Industry Revenue (Million), by Metal Type 2024 & 2032
- Figure 60: South America PGM Industry Volume (tons), by Metal Type 2024 & 2032
- Figure 61: South America PGM Industry Revenue Share (%), by Metal Type 2024 & 2032
- Figure 62: South America PGM Industry Volume Share (%), by Metal Type 2024 & 2032
- Figure 63: South America PGM Industry Revenue (Million), by Application 2024 & 2032
- Figure 64: South America PGM Industry Volume (tons), by Application 2024 & 2032
- Figure 65: South America PGM Industry Revenue Share (%), by Application 2024 & 2032
- Figure 66: South America PGM Industry Volume Share (%), by Application 2024 & 2032
- Figure 67: South America PGM Industry Revenue (Million), by Country 2024 & 2032
- Figure 68: South America PGM Industry Volume (tons), by Country 2024 & 2032
- Figure 69: South America PGM Industry Revenue Share (%), by Country 2024 & 2032
- Figure 70: South America PGM Industry Volume Share (%), by Country 2024 & 2032
- Figure 71: Middle East and Africa PGM Industry Revenue (Million), by Metal Type 2024 & 2032
- Figure 72: Middle East and Africa PGM Industry Volume (tons), by Metal Type 2024 & 2032
- Figure 73: Middle East and Africa PGM Industry Revenue Share (%), by Metal Type 2024 & 2032
- Figure 74: Middle East and Africa PGM Industry Volume Share (%), by Metal Type 2024 & 2032
- Figure 75: Middle East and Africa PGM Industry Revenue (Million), by Application 2024 & 2032
- Figure 76: Middle East and Africa PGM Industry Volume (tons), by Application 2024 & 2032
- Figure 77: Middle East and Africa PGM Industry Revenue Share (%), by Application 2024 & 2032
- Figure 78: Middle East and Africa PGM Industry Volume Share (%), by Application 2024 & 2032
- Figure 79: Middle East and Africa PGM Industry Revenue (Million), by Country 2024 & 2032
- Figure 80: Middle East and Africa PGM Industry Volume (tons), by Country 2024 & 2032
- Figure 81: Middle East and Africa PGM Industry Revenue Share (%), by Country 2024 & 2032
- Figure 82: Middle East and Africa PGM Industry Volume Share (%), by Country 2024 & 2032
List of Tables
- Table 1: Global PGM Industry Revenue Million Forecast, by Region 2019 & 2032
- Table 2: Global PGM Industry Volume tons Forecast, by Region 2019 & 2032
- Table 3: Global PGM Industry Revenue Million Forecast, by Metal Type 2019 & 2032
- Table 4: Global PGM Industry Volume tons Forecast, by Metal Type 2019 & 2032
- Table 5: Global PGM Industry Revenue Million Forecast, by Application 2019 & 2032
- Table 6: Global PGM Industry Volume tons Forecast, by Application 2019 & 2032
- Table 7: Global PGM Industry Revenue Million Forecast, by Region 2019 & 2032
- Table 8: Global PGM Industry Volume tons Forecast, by Region 2019 & 2032
- Table 9: Global PGM Industry Revenue Million Forecast, by Country 2019 & 2032
- Table 10: Global PGM Industry Volume tons Forecast, by Country 2019 & 2032
- Table 11: China PGM Industry Revenue (Million) Forecast, by Application 2019 & 2032
- Table 12: China PGM Industry Volume (tons) Forecast, by Application 2019 & 2032
- Table 13: India PGM Industry Revenue (Million) Forecast, by Application 2019 & 2032
- Table 14: India PGM Industry Volume (tons) Forecast, by Application 2019 & 2032
- Table 15: Japan PGM Industry Revenue (Million) Forecast, by Application 2019 & 2032
- Table 16: Japan PGM Industry Volume (tons) Forecast, by Application 2019 & 2032
- Table 17: South Korea PGM Industry Revenue (Million) Forecast, by Application 2019 & 2032
- Table 18: South Korea PGM Industry Volume (tons) Forecast, by Application 2019 & 2032
- Table 19: ASEAN Countries PGM Industry Revenue (Million) Forecast, by Application 2019 & 2032
- Table 20: ASEAN Countries PGM Industry Volume (tons) Forecast, by Application 2019 & 2032
- Table 21: Rest of Asia Pacific PGM Industry Revenue (Million) Forecast, by Application 2019 & 2032
- Table 22: Rest of Asia Pacific PGM Industry Volume (tons) Forecast, by Application 2019 & 2032
- Table 23: Global PGM Industry Revenue Million Forecast, by Country 2019 & 2032
- Table 24: Global PGM Industry Volume tons Forecast, by Country 2019 & 2032
- Table 25: United States PGM Industry Revenue (Million) Forecast, by Application 2019 & 2032
- Table 26: United States PGM Industry Volume (tons) Forecast, by Application 2019 & 2032
- Table 27: Canada PGM Industry Revenue (Million) Forecast, by Application 2019 & 2032
- Table 28: Canada PGM Industry Volume (tons) Forecast, by Application 2019 & 2032
- Table 29: Mexico PGM Industry Revenue (Million) Forecast, by Application 2019 & 2032
- Table 30: Mexico PGM Industry Volume (tons) Forecast, by Application 2019 & 2032
- Table 31: Global PGM Industry Revenue Million Forecast, by Country 2019 & 2032
- Table 32: Global PGM Industry Volume tons Forecast, by Country 2019 & 2032
- Table 33: Germany PGM Industry Revenue (Million) Forecast, by Application 2019 & 2032
- Table 34: Germany PGM Industry Volume (tons) Forecast, by Application 2019 & 2032
- Table 35: United Kingdom PGM Industry Revenue (Million) Forecast, by Application 2019 & 2032
- Table 36: United Kingdom PGM Industry Volume (tons) Forecast, by Application 2019 & 2032
- Table 37: Italy PGM Industry Revenue (Million) Forecast, by Application 2019 & 2032
- Table 38: Italy PGM Industry Volume (tons) Forecast, by Application 2019 & 2032
- Table 39: France PGM Industry Revenue (Million) Forecast, by Application 2019 & 2032
- Table 40: France PGM Industry Volume (tons) Forecast, by Application 2019 & 2032
- Table 41: Rest of Europe PGM Industry Revenue (Million) Forecast, by Application 2019 & 2032
- Table 42: Rest of Europe PGM Industry Volume (tons) Forecast, by Application 2019 & 2032
- Table 43: Global PGM Industry Revenue Million Forecast, by Country 2019 & 2032
- Table 44: Global PGM Industry Volume tons Forecast, by Country 2019 & 2032
- Table 45: Brazil PGM Industry Revenue (Million) Forecast, by Application 2019 & 2032
- Table 46: Brazil PGM Industry Volume (tons) Forecast, by Application 2019 & 2032
- Table 47: Argentina PGM Industry Revenue (Million) Forecast, by Application 2019 & 2032
- Table 48: Argentina PGM Industry Volume (tons) Forecast, by Application 2019 & 2032
- Table 49: Rest of South America PGM Industry Revenue (Million) Forecast, by Application 2019 & 2032
- Table 50: Rest of South America PGM Industry Volume (tons) Forecast, by Application 2019 & 2032
- Table 51: Global PGM Industry Revenue Million Forecast, by Country 2019 & 2032
- Table 52: Global PGM Industry Volume tons Forecast, by Country 2019 & 2032
- Table 53: Saudi Arabia PGM Industry Revenue (Million) Forecast, by Application 2019 & 2032
- Table 54: Saudi Arabia PGM Industry Volume (tons) Forecast, by Application 2019 & 2032
- Table 55: South Africa PGM Industry Revenue (Million) Forecast, by Application 2019 & 2032
- Table 56: South Africa PGM Industry Volume (tons) Forecast, by Application 2019 & 2032
- Table 57: Rest of Middle East and Africa PGM Industry Revenue (Million) Forecast, by Application 2019 & 2032
- Table 58: Rest of Middle East and Africa PGM Industry Volume (tons) Forecast, by Application 2019 & 2032
- Table 59: Global PGM Industry Revenue Million Forecast, by Metal Type 2019 & 2032
- Table 60: Global PGM Industry Volume tons Forecast, by Metal Type 2019 & 2032
- Table 61: Global PGM Industry Revenue Million Forecast, by Application 2019 & 2032
- Table 62: Global PGM Industry Volume tons Forecast, by Application 2019 & 2032
- Table 63: Global PGM Industry Revenue Million Forecast, by Country 2019 & 2032
- Table 64: Global PGM Industry Volume tons Forecast, by Country 2019 & 2032
- Table 65: China PGM Industry Revenue (Million) Forecast, by Application 2019 & 2032
- Table 66: China PGM Industry Volume (tons) Forecast, by Application 2019 & 2032
- Table 67: India PGM Industry Revenue (Million) Forecast, by Application 2019 & 2032
- Table 68: India PGM Industry Volume (tons) Forecast, by Application 2019 & 2032
- Table 69: Japan PGM Industry Revenue (Million) Forecast, by Application 2019 & 2032
- Table 70: Japan PGM Industry Volume (tons) Forecast, by Application 2019 & 2032
- Table 71: South Korea PGM Industry Revenue (Million) Forecast, by Application 2019 & 2032
- Table 72: South Korea PGM Industry Volume (tons) Forecast, by Application 2019 & 2032
- Table 73: ASEAN Countries PGM Industry Revenue (Million) Forecast, by Application 2019 & 2032
- Table 74: ASEAN Countries PGM Industry Volume (tons) Forecast, by Application 2019 & 2032
- Table 75: Rest of Asia Pacific PGM Industry Revenue (Million) Forecast, by Application 2019 & 2032
- Table 76: Rest of Asia Pacific PGM Industry Volume (tons) Forecast, by Application 2019 & 2032
- Table 77: Global PGM Industry Revenue Million Forecast, by Metal Type 2019 & 2032
- Table 78: Global PGM Industry Volume tons Forecast, by Metal Type 2019 & 2032
- Table 79: Global PGM Industry Revenue Million Forecast, by Application 2019 & 2032
- Table 80: Global PGM Industry Volume tons Forecast, by Application 2019 & 2032
- Table 81: Global PGM Industry Revenue Million Forecast, by Country 2019 & 2032
- Table 82: Global PGM Industry Volume tons Forecast, by Country 2019 & 2032
- Table 83: United States PGM Industry Revenue (Million) Forecast, by Application 2019 & 2032
- Table 84: United States PGM Industry Volume (tons) Forecast, by Application 2019 & 2032
- Table 85: Canada PGM Industry Revenue (Million) Forecast, by Application 2019 & 2032
- Table 86: Canada PGM Industry Volume (tons) Forecast, by Application 2019 & 2032
- Table 87: Mexico PGM Industry Revenue (Million) Forecast, by Application 2019 & 2032
- Table 88: Mexico PGM Industry Volume (tons) Forecast, by Application 2019 & 2032
- Table 89: Global PGM Industry Revenue Million Forecast, by Metal Type 2019 & 2032
- Table 90: Global PGM Industry Volume tons Forecast, by Metal Type 2019 & 2032
- Table 91: Global PGM Industry Revenue Million Forecast, by Application 2019 & 2032
- Table 92: Global PGM Industry Volume tons Forecast, by Application 2019 & 2032
- Table 93: Global PGM Industry Revenue Million Forecast, by Country 2019 & 2032
- Table 94: Global PGM Industry Volume tons Forecast, by Country 2019 & 2032
- Table 95: Germany PGM Industry Revenue (Million) Forecast, by Application 2019 & 2032
- Table 96: Germany PGM Industry Volume (tons) Forecast, by Application 2019 & 2032
- Table 97: United Kingdom PGM Industry Revenue (Million) Forecast, by Application 2019 & 2032
- Table 98: United Kingdom PGM Industry Volume (tons) Forecast, by Application 2019 & 2032
- Table 99: Italy PGM Industry Revenue (Million) Forecast, by Application 2019 & 2032
- Table 100: Italy PGM Industry Volume (tons) Forecast, by Application 2019 & 2032
- Table 101: France PGM Industry Revenue (Million) Forecast, by Application 2019 & 2032
- Table 102: France PGM Industry Volume (tons) Forecast, by Application 2019 & 2032
- Table 103: Rest of Europe PGM Industry Revenue (Million) Forecast, by Application 2019 & 2032
- Table 104: Rest of Europe PGM Industry Volume (tons) Forecast, by Application 2019 & 2032
- Table 105: Global PGM Industry Revenue Million Forecast, by Metal Type 2019 & 2032
- Table 106: Global PGM Industry Volume tons Forecast, by Metal Type 2019 & 2032
- Table 107: Global PGM Industry Revenue Million Forecast, by Application 2019 & 2032
- Table 108: Global PGM Industry Volume tons Forecast, by Application 2019 & 2032
- Table 109: Global PGM Industry Revenue Million Forecast, by Country 2019 & 2032
- Table 110: Global PGM Industry Volume tons Forecast, by Country 2019 & 2032
- Table 111: Brazil PGM Industry Revenue (Million) Forecast, by Application 2019 & 2032
- Table 112: Brazil PGM Industry Volume (tons) Forecast, by Application 2019 & 2032
- Table 113: Argentina PGM Industry Revenue (Million) Forecast, by Application 2019 & 2032
- Table 114: Argentina PGM Industry Volume (tons) Forecast, by Application 2019 & 2032
- Table 115: Rest of South America PGM Industry Revenue (Million) Forecast, by Application 2019 & 2032
- Table 116: Rest of South America PGM Industry Volume (tons) Forecast, by Application 2019 & 2032
- Table 117: Global PGM Industry Revenue Million Forecast, by Metal Type 2019 & 2032
- Table 118: Global PGM Industry Volume tons Forecast, by Metal Type 2019 & 2032
- Table 119: Global PGM Industry Revenue Million Forecast, by Application 2019 & 2032
- Table 120: Global PGM Industry Volume tons Forecast, by Application 2019 & 2032
- Table 121: Global PGM Industry Revenue Million Forecast, by Country 2019 & 2032
- Table 122: Global PGM Industry Volume tons Forecast, by Country 2019 & 2032
- Table 123: Saudi Arabia PGM Industry Revenue (Million) Forecast, by Application 2019 & 2032
- Table 124: Saudi Arabia PGM Industry Volume (tons) Forecast, by Application 2019 & 2032
- Table 125: South Africa PGM Industry Revenue (Million) Forecast, by Application 2019 & 2032
- Table 126: South Africa PGM Industry Volume (tons) Forecast, by Application 2019 & 2032
- Table 127: Rest of Middle East and Africa PGM Industry Revenue (Million) Forecast, by Application 2019 & 2032
- Table 128: Rest of Middle East and Africa PGM Industry Volume (tons) Forecast, by Application 2019 & 2032
Frequently Asked Questions
1. What is the projected Compound Annual Growth Rate (CAGR) of the PGM Industry?
The projected CAGR is approximately 4.48%.
2. Which companies are prominent players in the PGM Industry?
Key companies in the market include ANGLO AMERICAN PLATINUM LIMITED, Implats Platinum Limited, Vale*List Not Exhaustive, Norilsk Nickel, African Rainbow Minerals Limited, GLENCORE, Northam Platinum Holdings Limited, Johnson Matthey, Sibanye-Stillwater, Platinum Group Metals Ltd.
3. What are the main segments of the PGM Industry?
The market segments include Metal Type, Application.
4. Can you provide details about the market size?
The market size is estimated to be USD XX Million as of 2022.
5. What are some drivers contributing to market growth?
Growing Demand for Catalytic Converters from the Automotive Industry; Increasing Demand for Platinum. Palladium. and Ruthenium from the Electronics Industry; Growing Jewelry Consumption in Asia-Pacific Countries.
6. What are the notable trends driving market growth?
Autocatalysts Segment to Dominate the Market.
7. Are there any restraints impacting market growth?
High Costs Involved in Production and Maintenance; Other Restraints.
8. Can you provide examples of recent developments in the market?
November 2023: Sibanye-Stillwater agreed to acquire Reldan, a metal recycler based in the United States. Reldan is a Pennsylvania-based recycling group that reprocesses various waste streams, including industrial and electronic waste, to recycle green precious metals such as platinum and palladium.
9. What pricing options are available for accessing the report?
Pricing options include single-user, multi-user, and enterprise licenses priced at USD 4750, USD 5250, and USD 8750 respectively.
10. Is the market size provided in terms of value or volume?
The market size is provided in terms of value, measured in Million and volume, measured in tons.
11. Are there any specific market keywords associated with the report?
Yes, the market keyword associated with the report is "PGM Industry," which aids in identifying and referencing the specific market segment covered.
12. How do I determine which pricing option suits my needs best?
The pricing options vary based on user requirements and access needs. Individual users may opt for single-user licenses, while businesses requiring broader access may choose multi-user or enterprise licenses for cost-effective access to the report.
13. Are there any additional resources or data provided in the PGM Industry report?
While the report offers comprehensive insights, it's advisable to review the specific contents or supplementary materials provided to ascertain if additional resources or data are available.
14. How can I stay updated on further developments or reports in the PGM Industry?
To stay informed about further developments, trends, and reports in the PGM Industry, consider subscribing to industry newsletters, following relevant companies and organizations, or regularly checking reputable industry news sources and publications.
Methodology
Step 1 - Identification of Relevant Samples Size from Population Database


Step 2 - Approaches for Defining Global Market Size (Value, Volume* & Price*)

Note*: In applicable scenarios
Step 3 - Data Sources
Primary Research
- Web Analytics
- Survey Reports
- Research Institute
- Latest Research Reports
- Opinion Leaders
Secondary Research
- Annual Reports
- White Paper
- Latest Press Release
- Industry Association
- Paid Database
- Investor Presentations

Step 4 - Data Triangulation
Involves using different sources of information in order to increase the validity of a study
These sources are likely to be stakeholders in a program - participants, other researchers, program staff, other community members, and so on.
Then we put all data in single framework & apply various statistical tools to find out the dynamic on the market.
During the analysis stage, feedback from the stakeholder groups would be compared to determine areas of agreement as well as areas of divergence
